MDT LongEntry $0.073
Target $0.088
Observations: As long as we don't close bellow 0.072 its bullish for me.
MDT

Piggyback the profiteers After some conversation with a young single mom and what she goes through to get her and her 2 yr old diabetes meds @ $13hr...f to the big pharma and f to the health care that does not cover such a life saving drug. It's not a conspiracy...it's a cultural failure to recognize how far we have come in such a short time. Some will call it profiteering...sure but it's also about what is done with those profits...what could be done. So I'm in on medtronic with the mission to take their pillaging and raping of the target audience, get some profits and help someone that needs help with their medication.
www.diabetes.ca you can donate as well....I just want to take the strain off someone I know personally.


MDTUSDTHello to you all. Mars Signals team wishes you high profits at all times.
The price has experienced a lot of decline, we expect it to be the end of the decline and be able to touch the top targets over time.
Warning: This is just a suggestion to you and we do not guarantee profits.
Wish you luck!


MDT price target raised to 133; pent-up demand provides tailwindMDT price target was just upgraded to $133 by Citi. I see it overshooting that in the long run. Elective surgeries have been put off and doctor visits have been down throughout the pandemic so the amount of pent-up demand for surgical/medical care is going to be through the roof. With an aging population, healthcare is a MUST as a sector to allocate to.
MDT is an excellent way to play this sector. After periods of consolidation, MDT looks ready to head towards it's price target. My guess is it hits $150 before it reaches any significant resistance.
In terms of fundamentals, their current ratio is 2.1020, meaning they could pay their current liabilities 2 times over if sh*t hit the fan and business came to a complete halt. Highly unlikely, but if it did happen, you would be sheltered for a period of time.


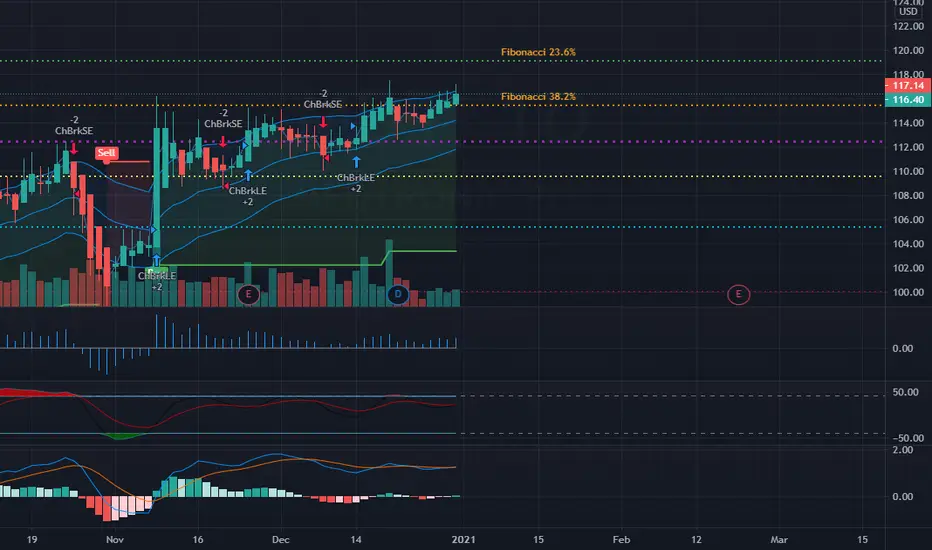
MDT BreakoutMDT breakout through 120.05. This volatility contraction pattern is my bread and butter. With markets extended i'm not looking to push trades right now. But this set up is allowing a tight risk entry.

Measurable Data Token (MDT) Conquers MA200, 100% Target Mapped We are looking at MDTBTC (Measurable Data Token) on the daily timeframe.
Notice the black line on the chart, this is the same indicator we just used on the BEAMBTC chart (visit my profile), this one can either work as support or resistance depending on where it stands on the chart.
When MA200 is below the current price, it can be used as support.
When MA200 is trading above the current price, it can be considered resistance.
With this strong resistance level now taken out, prices moving and closing above it, the doors are open for more on this pair.
We can start with 35%+ followed by 100%+.
This is only mid-term, there can be more long-term.
Thanks a lot for reading.
Namaste.

Great consolidation before HUGE IMPULSE!📈Hey, wolves🔥
There is a symmetrical triangle on 1h frame on MDT/USDT crypto pair.
There was a strong bearish sentiment before. So this formation could be a confirmation of continuation trend. Or not?
According to Elliott Waves theory all the waves are done and now the price is heading to the breakout.
Follow the chart and look for the breakout.
If you enjoy my FREE Technical Analysis , support the idea with a big LIKE👍 and don't forget to SUBSCRIBE my channel, you won't miss anything!
Feel free to leave comments✉️
And always remember: "we don't predict, we react".


Long | MDTNYSE:MDT
Possible Scenario: LONG
Evidence: Price Action
This is my idea and could be wrong 100%.

MDT Continues... Gaining StrengthWe might have a very good start to this week with so many altcoins pairs posting small growth in preparing for big/strong growth.
MDTBTC now starts to move up after hitting a new low, its prices are now above EMA10 and EMA21.
The volume is still slow, signaling that the real bullish action is yet to come.
Wait patiently because patience is the key to winning when we trade.
It is not about buying and selling...
Our strategy is based on knowing how to wait.
The results will speak for themselves.
Be happy/grateful for any successful wins...
Learn from the loss...
Take responsibility for your own actions and whatever happens... Come back, try again, keep on persisting, learning, and in the end, you will be a big winner because cryptocurrency is the future of money, that's what is becoming evident as trillions and trillions of fiat currency continue to be printed all around the world.
Namaste.

Resistance Broken (MDT/BTC)MDT has succeeded to break very strong resistance which is equal to MA50 today.
Now, it's trying to stay above them and keep itself above 100 sats.
MA20 is closing the gap between MA50. We may see a Ma20xMa50 cross soon.
Targets:
1. 135 satoshi
2. 157 satoshi
Stop-Loss: 94 satoshi
Happy Trading! ☺️✌️😊
What do you think? Any comment? 👇👇👇

✳️Measurable Data Token/USDT (16/11) View + Plan #MDT $MDTMDT is in a strong bull run and it is heading to 0.024$. However, the 0.018$ zone is still a strong price zone that MDT has not been able to conquer successfully, so there will still exist a strong selling force.
📈BUY- LONG
-Buy close to 0.014-0.0145$, stoploss if B
-Buy more 0.018-0.0185$ if A, stoploss if B
-Buy:0.01-0.0105$, stoploss if B
📉SELL-SHORT
-Sell: 0.018-0.0185$, stoploss if A
-Sell: 0.024-0.0245$, stoploss if A
-Sell close to 0.014-0.0145$ if B, stoploss if A
-Sell close to 0.01-0.0105$ if B, stoploss if A
❓Details:
Condition A : "If 1D candle closes ABOVE this zone"
Condition B : "If 1D candle closes BELOW this zone"

MDT measurable Data Token Daily Chart - MDTBTC MDTUSDT MDTUSDMDT measurable Data Token Daily Chart - MDTBTC MDTUSDT MDTUSD


