Stock Market Forecast | BTC TSLA NVDA AAPL AMZN META MSFTWelcome to your essential weekly guide for navigating the dynamic stock market! In this in-depth analysis, we provide a comprehensive stock market forecast covering key movers like the S&P 500 CME_MINI:ES1! (SPY) and Nasdaq 100 CME_MINI:NQ1! NASDAQ:NDX (QQQ), alongside a detailed Bitcoin ( CRYPTOCAP:BTC ) analysis. We dive deep into major large-cap stocks, including Tesla (TSLA), Nvidia (NVDA), Apple (AAPL), Amazon (AMZN), Meta (META), and Microsoft (MSFT), offering crucial insights for your day trading and investing strategies.
This video breaks down complex market movements using advanced technical analysis, identifying critical support and resistance levels. We also analyze sector rotation, market sentiment, dark pool activity, and upcoming earnings reports, integrating key macroeconomic data to pinpoint high-probability market scenarios for the week ahead. Whether you're focused on individual stocks or broader market trends, our financial analysis aims to equip you with actionable knowledge. Discover the future of the stock market and gain valuable trading tips to stay ahead!
Timestamps are provided below so you can easily jump to specific tickers and chart analysis that matter most to your portfolio.
0:00 Intro
0:14 Sector Data & Rotation
1:49 Sentiment Data
2:07 Dark Pools (QQQ / PSQ)
4:03 Rate Cut Odds
4:29 Earnings Calendar
4:53 Economic Data Next Week
5:21 SPY Technicals
7:36 MAG7 Dark Pool Context
9:23 QQQ Technicals
11:58 Bitcoin Technicals
18:01 Tesla (TSLA)
20:02 Meta (META)
23:50 Amazon (AMZN)
26:30 Microsoft (MSFT)
30:18 Google (GOOGL)
32:15 Apple (AAPL)
34:12 Nvidia (NVDA)
35:39 Wrap Up
Meta

BUY for META at Discounted Price - AI CAPEX Priced In!Market sentiment dragging prices down due to concerns over AI CAPEX, but from what I see, these are one time costs with sustained future ROI and non-linear positive scaling effect on META's family of apps and advertising services.
Catalysts upcoming include META's AI Frontier models release - Avocado.
META has also not fully leveraged profit margins on threads and whatsapp unlike instagram and facebook which has global advertising footprint.
BUY @ below 685
TARGET @ 850, 1000, Long hold

META - a deeeeep pullback soon META had solid bull run and probably this gonna follow rest of the names in this pullback.
Short it anywhere with some longer expiry puts. My preference would be Enter and Exit with good R:R zones and take profits. Expecting a fast move to the downside soon.
I prefer to use round number targets as those zones have good liquidity for puts.
Target 1 - 680
Target 2 - 600
Target 3 - 555
Target 4 - 500
Target 5 - 450
Target 6 - 400

Meta will pull back and will test new ATH in 2 or 3 weeksMeta will pull back and will test new ATH in 2 or 3 weeks

SLV - Parabolic Exhaustion Play - $100 Puts Feb 13📉 Pattern Recognition Setup
AMEX:SLV just completed a 68% run from $65 to $110 in under 3 months. This isn’t normal commodity ETF behavior - this is meme-stock price action.
Key Observation:
The current parabolic structure mirrors the prior $30→$48 spike that collapsed violently after hitting exhaustion (see bar pattern overlay on daily). Same RSI divergence, same volume behavior, same exhaustion signature.
Technical Confluence:
• RSI: 74 (overbought with multiple bear divergence signals)
• Structure: Double top at $110 resistance zone
• Volume: 8h chart shows peak Volume surges mark local Tops/Bottoms
• Pattern Target: $88.91 measured move
• Historical Precedent: Prior parabolic collapse followed identical setup
Trade Details:
Entry: $100 Puts, Feb 13 expiration
Trigger: Close below $105 on 4H timeframe
Target: $88-90 zone
Stop: Reclaim and hold above $110 invalidates pattern
Risk Management:
This is a defined-risk speculation on technical pattern completion. When parabolic runs exhaust at resistance with stacked divergence, retracements are swift and violent - not gradual. Size accordingly.
Timeline: 11 trading days for execution
This is my own thoughts put together by Claude.ai
This is my own charting and my own words and thoughts gathered into a presentable form.

100% Win RateI have identified a strong quantitative setup for Meta Platforms. The historical data suggests a highly robust edge following this specific trend signal.
Key Statistics:
* Signal: Price close over MA200
* Historical Win Rate (1 Year): 100.00%
* Average Return (1 Year): +69.15%
* Backtest Period: 2012 – 2026
Analysis:
The data suggests that META has an exceptionally strong "edge" following this signal. Most notably, the 1-year holding period has a perfect historical track record with a 100% win rate across all 7 tracked trades.
Momentum appears to accelerate significantly after the 2-months mark, where win rates jump to 84.62% and average returns move into double digits. This setup historically rewards the patient investor rather than short-term traders.

Meta - Preparing a major buying opportunity!🤩Meta ( NASDAQ:META ) is clearly heading higher:
🔎Analysis summary:
Just recently Meta once again retested the major resistance trendline. This retest was followed by a decent correction of about -25%, perfectly playing out. Now, Meta is retesting major support and is already setting up for another potential buying opportunity.
📝Levels to watch:
$650 and $500
SwingTraderPhil
SwingTrading.Simplified. | Investing.Simplified. | #LONGTERMVISION

QS V4 ELITE — META Weekly Mean-Reversion SignalMETA QuantSignals V4 Weekly 2026-01-29
Directional Bias
Primary Bias: Bearish (Mean Reversion)
Conviction: Moderate
Regime: Neutral (Counter-trend pullback)
🧠 Why This Trade Works (Quick Read)
META is overbought (Weekly RSI 71.2)
Price is pressed into $744 hard resistance
Stock is +13% above 50-DMA → stretched
Broad tech selling (QQQ -1.29%) increases downside pressure
Katy AI targets $675–680, aligning with 200-DMA
🎯 Key Levels
Resistance: $744 (Gamma Wall)
Near-Term Support: $720
Major Support / Target Zone: $680–675
Weekly VWAP: $686.79
🛠️ Trade Setup (Institutional Style)
Expiration: This Friday (Weekly)
Ideal Entry: Near $732–738 rejection
Risk: Defined (premium only)
🎯 Targets
Target 1: $720 (Partial trim)
Target 2: $700–690
Stretch Target: $680–675 (Katy AI + 200DMA)
🛑 Risk Management
Invalidation: Clean break & hold above $745
Max Risk: 1–2% of account
Rule: No averaging down
Options Flow Read
Put/Call: 1.0 (Neutral)
Interpretation: Late call buyers at resistance → fuel for pullback
Smart Money: Quiet put positioning at $727.5P / $732.5P

Three Trades to Watch: 30 January 2026The final week of January has delivered the volatility traders were promised. We are witnessing a historic decoupling in precious metals and a rise in META and TSLA following better than expected earnings reports.
Here is the technical and fundamental alpha you need to capture the momentum.
1. Gold ( CRYPTOCAP:XAUT ): The Unstoppable Breakout
While Bitcoin consolidates, Gold has chosen violence. The asset has shattered multi-year resistance levels to enter true price discovery mode. The "Digital Gold" narrative may be pausing, but the original safe haven is breaking out, driven by renewed central bank accumulation and persistent inflation fears for the 2026 fiscal year.
The Central Bank Put:
The breakout isn't just retail speculation; it is structural. Global central banks, particularly in the East, have accelerated gold accumulation to diversify reserves away from fiat treasuries. This creates a "price floor" that didn't exist in previous cycles. Furthermore, real rates have decoupled from gold prices—historically, high rates crushed gold. In 2026, gold is rallying despite rates, signalling a total loss of faith in sovereign debt sustainability. It is also significantly outperforming Bitcoin (BTC) during its current phase of consolidation, cementing its role as the preferred safe-haven asset for this cycle.
Trader’s Takeaway : Do not short a parabolic breakout in price discovery. Watch for a retest of the breakout level to build long exposure. The trend is your friend until the daily structure breaks.
2. Meta ( NASDAQ:META ): The Efficiency Engine Roars
Meta’s Q4 earnings release on Wednesday silenced the bears. Defying fears of a "Capex Trap", Meta reported better-than-expected revenue growth and demonstrated that its massive AI spend is finally converting to ad-revenue efficiency.
AI Monetisation
The bear case was that Zuckerberg was burning cash on AI with no return. The Q4 report dismantled this. The "Family of Apps" operating income surged, driven by AI-powered ad targeting that has restored conversion rates to pre-IOS14 levels. Crucially, the Reality Labs loss narrowed slightly, showing that the "Year of Efficiency" wasn't a one-off gimmick—it's the new operating standard.
Technical Analysis: The Gap and Go
Pattern : The post-earnings action formed a classic "Runaway Gap." Unlike exhaustion gaps, this occurs midway through a trend, signalling a continuation of the move.
Volume Profile : We saw a massive volume node at the earnings open. This suggests institutions stepped in to defend the price, creating a "line in the sand" for bulls.
Moving Averages : The price has reclaimed the 50-day EMA with conviction. As long as the price stays above the gap fill, the momentum remains bullish.
The Funding Edge : The difference in holding costs is staggering. Analysis of funding rates over the last 32 hours shows that while Hyperliquid’s annualized rate spiked as high as 18%—averaging nearly 8%—BitMEX funding rates remained flat at 0.00%.
3. Tesla ( NASDAQ:TSLA ): The Growth Story Resets
Tesla delivered a surprise earnings beat in Q4 2025, reporting adjusted EPS of $0.50 (vs. ~$0.45 expected), which helped steady the stock despite a 3% year-over-year revenue decline.
Margin Stabilisation
The fear was a race to the bottom on EV pricing. However, Tesla revealed that auto gross margins (ex-credits) have bottomed and are ticking up. This "margin trough" is the signal institutional allocators were waiting for. Additionally, Energy Storage revenue grew triple-digits YoY, finally becoming a material contributor to the bottom line, diversifying the risk away from pure auto sales.
The Funding Rate Arbitrage Opportunity on BitMEX:
The rush into Tesla longs caused financing costs to explode on retail-heavy exchanges. Data from earnings day reveals that Hyperliquid funding rates for TSLA skyrocketed to over 100% APR at peak volatility. In stark contrast, BitMEX funding held firm at 0.00%.

Meta Platforms Shares Rise Above $700 After Earnings ReleaseMeta Platforms (META) Shares Rise Above $700 After Earnings Release
Yesterday, Meta Platforms published its fourth-quarter 2025 earnings report, which made a strong impression. In after-hours trading, META shares surged by more than 10% at one point, reaching around $740.
Why META Shares Are Rising
The company not only met analysts’ expectations but significantly exceeded them:
→ Earnings per share (EPS): actual $8.88 (expected $8.19–8.21), up 11% year-on-year.
→ Revenue: actual $59.9bn (forecast around $58.35bn).
In addition, the media highlighted several positive factors:
→ A strong outlook for 2026.
→ A high operating margin of around 41%, demonstrating strong business efficiency despite substantial spending.
→ Continued growth in advertising services: the company has integrated AI into ad delivery, with growth seen both in ad pricing (+6%) and the number of impressions (+18%).
A particularly important development was Mark Zuckerberg’s statement that the Reality Labs division is expected to pass its peak loss this year. This reassured investors concerned about prolonged cash burn related to capital expenditure.
Technical Analysis of the META Chart
On higher timeframes, the price remains in an uptrend. In January, the lower boundary of the long-term channel once again acted as support (indicated by the arrow).
In pre-market trading, META is quoted around $715–720. If the main session opens in this area, two observations appear especially important:
1 → The price is breaking upwards out of a descending channel (shown in red), which can be interpreted as an intermediate correction — a classic bull flag — within the broader prevailing uptrend.
2 → The price is moving above a key area that includes the psychological $700 level, which has acted as both support and resistance since July 2025. This zone may now provide a base for bulls in their attempt to move towards the median of the long-term channel.
This article represents the opinion of the Companies operating under the FXOpen brand only. It is not to be construed as an offer, solicitation, or recommendation with respect to products and services provided by the Companies operating under the FXOpen brand, nor is it to be considered financial advice.

Technical Analysis – Meta Platforms Inc (META)Meta Platforms needs little introduction. The company continues to show strong long-term growth and has been one of the best-performing stocks in the market over the past few years.
The stock comes from a major bullish phase that started in 2023, during which it gained over +600%, with healthy pullbacks occurring within the dominant uptrend.
Market Structure & Volume Analysis
Over the past few months, the stock has entered a retracement phase, which remains technically well-controlled.
Key points:
the correction was contained at the first Point of Control (POC_1), calculated using volume from the top distribution area
price reacted both at POC_1 and at the ascending weekly trendline
two strong bullish reactions occurred in this confluence area (yellow circles), confirming it as a key support zone
Bullish Scenario
For a bullish continuation scenario, price needs to:
break above the descending weekly trendline, which is currently being challenged
ideally confirm the breakout with a pullback (retest), turning the trendline into dynamic support
A successful retest would strengthen the probability of trend continuation in line with the primary bullish trend.
⚠️ Trading Note
As long as price holds above POC_1 and the ascending weekly trendline, the broader bullish bias remains intact.
Failure to decisively break the descending weekly trendline would keep the stock in a consolidation/correction phase.

Earnings at the Pivot: Can Price Reclaim the $680 Gap?Meta is testing the prior earnings gap area, with $680 acting as the key pivot.
Whether price can reclaim and hold above this level depends on tomorrow’s Q4 earnings after the close.
Until then, it’s a wait-for-direction setup rather than a conviction trade.

META Platforms Options Ahead of EarningsIf you missed buying META before the rally:
Now analyzing the options chain and the chart patterns of META Platforms prior to the earnings report this week,
I would consider purchasing the 670usd strike price Calls with
an expiration date of 2028-1-21,
for a premium of approximately $167.80.
If these options prove to be profitable prior to the earnings release, I would sell at least half of them.

Stock Market Forecast | BTC TSLA NVDA AAPL AMZN META MSFTStock Market Forecast | CRYPTOCAP:BTC TSLA NVDA AAPL AMZN META MSFT
SP:SPX CME_MINI:ES1! CME_MINI:NQ1!
Weekly stock market analysis covering the S&P 500 (SPY), Nasdaq 100 (QQQ), Bitcoin (BTC), and major large-cap stocks. In this video, we break down technical charts, key support and resistance levels, sector rotation, market sentiment, dark pool activity, earnings, and macroeconomic data to identify high-probability market scenarios for the week ahead.
Timestamps are included below so you can jump directly to specific tickers and chart analysis.
0:00 Intro & Market Overview
0:58 Sector & Sentiment Data
2:10 MAG 7 ETF / Dark Pools
5:12 ARK / Innovation & Small Caps
6:34 Earnings & Economic Calendar
8:44 S&P 500 (SPY)
12:12 Nasdaq 100 (QQQ)
15:22 Bitcoin (BTC)
22:15 Tesla (TSLA)
25:00 Meta (META)
26:30 Amazon (AMZN)
28:00 Microsoft (MSFT)
32:58 Google (GOOGL)
36:27 Apple (AAPL)
39:38 Nvidia (NVDA)
42:40 Outro

META Revisits Key Support with Bullish Reversal PatternMeta Platforms ( NASDAQ:META ) continues to exhibit a resilient bullish structure on the daily timeframe.
Following a significant move identified in late 2025, the price has undergone a standard period of consolidation and healthy pullbacks, which is common for mega-cap technology stocks.
Technical Observations:
I am currently observing a clear W-pattern formation (double bottom) developing on the chart. This structure is often a reliable signal of a bullish reversal or trend continuation.
Furthermore, the price has successfully returned to retest an established support zone (the ascending trendline), which may have provided the necessary liquidity for a move toward higher targets.
The confluence of the retest and the pattern formation suggests that the previous bullish momentum remains intact, provided the current support levels are defended by buyers.
Potential Levels of Interest:
Entry Consideration: Near the $658 area.
Invalidation Level (Stop Loss): Below $596.
Upside Objective: Targeting the $800 psychological level.
Risk Disclosure and Conduct:
Trading involves significant risk. This analysis represents a personal technical perspective and is provided for educational and informational purposes only. It does not constitute investment advice, financial planning, or an inducement to buy or sell any security.
Individual traders should conduct their own thorough research and ensure any positions align with their personal risk tolerance and broader strategy.
What are your thoughts on the current price action for META? Does the current macro environment support a breakout, or do you see a different structural development? Feel free to share your technical perspective in the comments.
Look at the previous analysis:

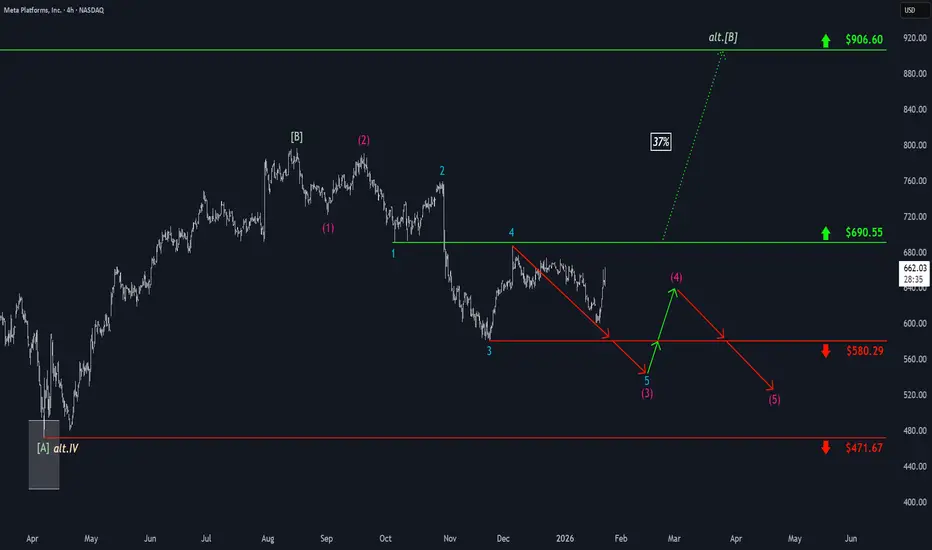
Meta: Counter-Reaction!Meta initially sold off toward the support at $580.29 as planned but recently experienced a counter-reaction as it neared this level. Primarily, we anticipate that the stock will soon turn downward to continue the ongoing bearish impulse. The magenta wave (3) is expected to set its low below the $580.29 level. After a moderate recovery in wave (4), we expect further declines. However, should stronger upward momentum push the stock above the resistance at $690.55, we may have to prepare for a new corrective high of green wave alt. near the $906.60 mark (probability: 37%). Primarily, however, we consider the regular wave as already complete.
META Can rise As It Forms A Bullish W PatternMETA Can rise As It Forms A Bullish W Pattern
Meta has been finding support and in the past couple of days it has started forming a base which can lead to a breakout. If this breakout sustains, we can have a possible formation of bullish W pattern. Targets are self evident.
Lets wait and watch and always this is not and advice but just an observation. Risk management is extremely important as always.
Follow for more. Please support this analysis by liking, commenting, and sharing with friends, colleagues, traders, and trading communities. Thanks👍🙂

SPY 20JAN 2026 READ DESCRIPTIONSpy is about to hit this level. Just be careful if you are short.
Market can easily bounce and go up from here.
I am travelling and will try to update spy weekly asap.

Stock Market Forecast | BTC TSLA NVDA AAPL AMZN META MSFT0:00 Intro & Overview
0:22 Sector Data & Sentiment
2:42 Dark Pools (RSP & MAG7)
6:44 S&P 500 (SPY)
9:21 Nasdaq 100 (QQQ)
11:37 Bitcoin (BTC)
15:04 Tesla (TSLA)
18:17 Meta (META)
22:03 Amazon (AMZN)
23:25 Microsoft (MSFT)
26:54 Google (GOOGL)
31:16 Apple (AAPL)
34:58 Nvidia (NVDA)
37:26 Outro
Stock Market Forecast | BTC TSLA NVDA AAPL AMZN META MSFT
SP:SPX AMEX:SPY CME_MINI:ES1! CME_MINI:NQ1!

Is META a Good Buy ? - AnalysisWhy Meta Stock Has Dropped from Prior Highs
Heavy AI and Infrastructure Spending
Meta is spending massive amounts on AI infrastructure and data centers (increased CAPEX) tens of billions per year, which increases expenses and spooks investors worried about returns on that capital. This spending has been compared unfavorably to past initiatives like the metaverse.
Earnings Disappointments (Tax and Charge Items)
Meta reported huge one-time charges (like a $16 B tax hit), pushing EPS much lower than expected. Even though revenue was strong, investors focus on earnings per share misses, which can cause steep sell-offs.
CapEx Outlook and Rising Expenses
Future budgets include significantly higher expenses for 2026 and beyond, especially compensation for AI talent and infrastructure, which reduces near-term profitability expectations.
Profit Volatility Relative to Expectations
Meta’s third-quarter results showed revenue growth but lower than anticipated profits, a classic catalyst for price declines in high-growth stocks.
Macro & Sector Rotation
Tech stocks overall have seen periods of rotation into other sectors. Aggressive spending without clear near-term ROI tends to amplify volatility in growth tech. Bottom line: Meta’s decline isn’t usually due to revenue collapse, it’s tied to higher costs, big tax impacts, investor expectations around AI ROI, and macro tech sentiment.
Key Financial Metrics (Fundamentals)
Here’s how Meta looks from a fundamentals perspective:
-Current price: ~$620+ (still below historical highs)
-Market cap: ~$1.8 T
-Profit margin: ~30.9%, strong tech profitability level
-Return on Equity (ROE): ~32–33%, very high for large cap tech
-Return on Assets (ROA): ~18%, excellent efficiency
-Revenue (TTM): ~$189 B
-Net Income (TTM): ~$58.5 B
-Free Cash Flow: ~$44.8 B
-Cash on hand: Over $40 B
-Debt/Eq: relatively low (~0.15–0.26 depending on source)
-P/E: ~31–32 times earnings, moderate for FAANG/Magnificent Seven stocks
Takeaway: Meta is financially very strong, generating large profits, cash flow, and solid returns on capital, with low debt relative to equity.
Bullish Case :
Huge cash flow and profitability
Meta generates tens of billions in free cash flow annually, strong cushion for investments and shareholder returns.
Advertising dominance
Its core platforms (Facebook, Instagram, WhatsApp) still monetize very effectively, driving revenue growth.
Strong balance sheet and low leverage
High cash, low debt → less financial risk relative to spending.
AI monetization potential
Meta’s AI tools (e.g., Advantage+ ads) are broadening engagement and could drive future top-line growth, differentiating it from rivals.
Analyst price targets and sentiment
Many analysts still rate Meta as a Strong Buy with targets above current levels (e.g., ~$825 consensus).
Part of tech “Magnificent Seven”
Peer group includes top AI/tech innovators, which can help re-rating if tech sentiment improves.
Cons Case :
Very heavy capital expenditure
Billions in annual spending on AI hardware and data centers without clear near-term revenue payoff makes some investors nervous.
Profit swings due to tax/one-offs
Big unexpected charges (like the ~$16 B tax hit) hurt EPS and can distort investor perceptions.
Short-term earnings pressure
Despite revenue growth, growing expenses can compress margins and temporarily lower profit growth estimates.
Valuation still not cheap
P/E in low-30s isn’t “deep value”, investors expect growth acceleration to justify it.
Competitive threats
TikTok and other AI-driven platforms continue to eat engagement/time, creating pressure on ad growth.
Market volatility and tech sentiment risk
Broader macro and tech sector shifts can weigh on share price even if Meta fundamentals are good.
Disclaimer:
This analysis is for informational and educational purposes only and does not constitute financial advice, investment recommendation, or an offer to buy or sell any securities. Asset prices, valuations, and performance metrics are subject to change and may be outdated. Always conduct your own due diligence and consult with a licensed financial advisor before making investment decisions. The information presented may contain inaccuracies and should not be solely relied upon for financial decisions. I am not a licensed financial advisor or professional trader. I am not personally liable for your own losses; this is not financial advice.

$META and $METU have found their floor; price target: $750+.Make the move today - you'll thank me later
Average 12‑month target:
~$823–$835 (based on 49–59 analysts).
Zacks reports: $839.67, range: $685–$1,117

META printing identical pattern as the 2022 Bear Cycle.Meta Platforms (META) is on the 5th straight week of sideways price action within the 1W MA50 (blue trend-line) and 1W MA100 (green trend-line). If we exclude the marginal break of December 08, this is the 11th straight week within this range.
Following the mid-August All Time High (ATH), the stock has technically entered a strong downtrend, the strongest since February - March 2025 and its only Support is the 1W MA100.
This looks identical with the start of the previous Bear Cycle. The Bull Cycles that preceded both peaked on the month of August (2021 and 2025 respectively) and right now (January) we are in a similar position as January 2022, with the 1W MA100 supporting, while the 1W RSI is just below 45.00. On top of that, add the fact that the current 1W RSI has been has been under a huge Lower Highs Bearish Divergence since March 04 2024.
With both patterns involving also a Higher Lows support, which after it broke in 2022 led to a Bear Cycle bottom just below the 1.236 Fibonacci extension, we expect META to repeat this if the 1W MA100 breaks and target $360 (Fib 1.236) towards the end of the year. Notice that this would make a perfect contact with the 1M MA100 (black trend-line).
It has to be noted at this stage that the 2022 Bear Cycle was extremely strong due to the dismal fundamentals. It wasn't just the macroeconomic environment (Inflation Crisis, Ukr-Rus war) but also the Metaverse disappointment. It is highly unlikely to get another such strong Bear Cycle, unless a similar bearish catalyst emerges.
---
** Please LIKE 👍, FOLLOW ✅, SHARE 🙌 and COMMENT ✍ if you enjoy this idea! Also share your ideas and charts in the comments section below! This is best way to keep it relevant, support us, keep the content here free and allow the idea to reach as many people as possible. **
---
💸💸💸💸💸💸
👇 👇 👇 👇 👇 👇

DVA LOOKING GOOD 13 Jan 2026Dva is looking very good to create long positions. I am creatkng some long positions here. Not for trading but in my portfolio as the level looks very good but just being conservative because of the market.
I will update the price action analysis soon
