SilverOver the last 10 trading days, silver futures have exhibited a strong bullish trend, extending a powerful rally that began in late 2025. The price has advanced from roughly $88–90/oz to above $105/oz, with successive higher highs and higher lows
Surpassed ~$100/oz decisively and sustained above this psychological threshold toward recent highs near ~$110/oz
The rally has been supported by risk-on flows as the US dollar softened and safe-haven and industrial demand factors strengthened. Speculative positioning and ETF inflows have underpinned upside interest, though sentiment signals indicate extended bullishness and potential for corrections..
Like and Share
Metals

Are we ready for rugged Gold?No mean inversion no pricing. let's see why Gold is so high without testing its mean inversion. 2009 style correction may hit the market.

DOGECOIN - Return Of The Doge?!DOGE remains within a larger 5-wave impulsive structure.
Price is currently developing wave 4, a corrective pullback within the broader bullish trend.
Wave 4 typically retraces a portion of wave 3, and the 38.2% Fibonacci level is one of the most common retracement zones in strong impulses. Current price action is approaching that region, aligning with a potential buy zone.
At this stage, the structure suggests correction - not trend reversal.
Plan
- Allow wave 4 to complete within the projected buy zone
- Look for lower-timeframe confirmation of reversal (trendline break, BOS etc)
- Position for wave 5 continuation once structure confirms
If momentum returns, wave 5 would be expected to produce a similar impulsive character to prior advances.
Goodluck and as always, trade safe!

GOLD - Keep An Eye On This!Gold is currently unfolding an ABC correction on the higher timeframe.
Wave A completed with a clear impulsive move.
Price is now developing wave B, which is taking the form of a complex W-X-Y structure.
At this stage:
- Wave W has completed
- We are currently in wave X
- Expecting one more minor move lower before wave Y begins
The expectation is for wave Y to complete wave B near projected resistance, before the larger corrective sequence resumes.
Plan
- Allow wave X to finish
- Look for signs of reversal into wave Y
- Monitor completion of wave B for the next higher-timeframe move
This remains a corrective phase. Patience is key while the structure completes.
What do you guys think?
Goodluck and as always, trade safe!

Bearish potential detected for EMREntry conditions:
(i) lower share price for ASX:EMR along with swing of DMI indicator towards bearishness and RSI downwards, and
(ii) observing market reaction around the share price of $6.34 (prior support from 06-Feb).
Depending on risk tolerance, the stop loss for the trade would be:
(i) above the declining yearly VWAP on the daily chart (currently $6.94), or
(ii) above the recent potential resistance level from the open of 21st January ($7.22).

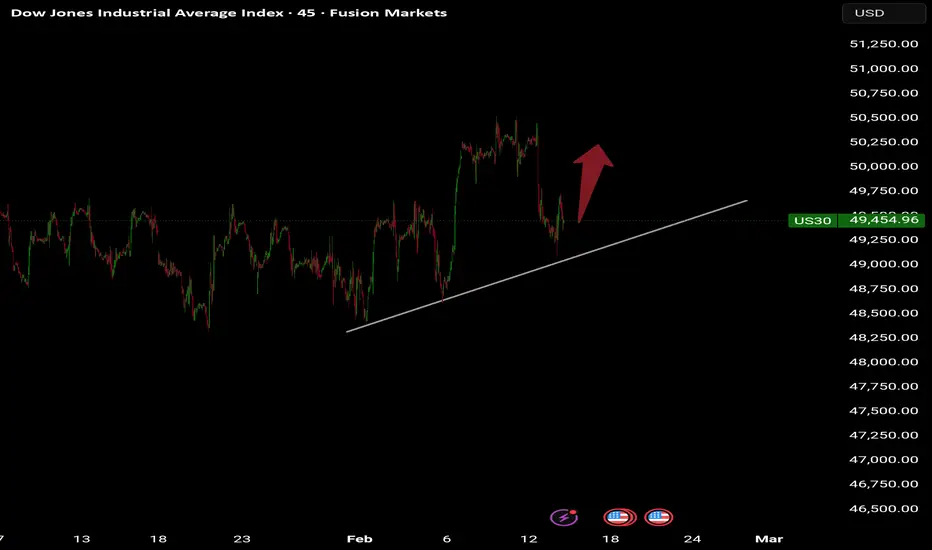
US30 to RISE?Waiting for the markets to open and waiting patiently for confirmations to go LONG on US30.
Gold Technical Outlook - Bullish Structure Still Intact?Gold is currently trading near 5042 and moving within a rising structure after forming a strong base from the February lows. Price is respecting the ascending trendline and holding above the key demand zone around 4900-4950 which keeps the short term bullish structure intact. However the market is still capped below the range high and weak high area near 5110-5130 showing hesitation and liquidity resting above. Price is holding above the rising trendline and the 5116 but is still struggling below the range high and weak high zone. This structure suggests accumulation where a minor pullback into support could be followed by a continuation move toward the upper channel and liquidity zone around 5300-5400.
Trade Plan
Buy Zone: 4950 – 4900
Buy Trigger: Clean breakout and close above 5115 – 5120 with continuation momentum
Targets: 5170 → 5290 → 5350-4000
Invalidation: H4 or Daily close below 4880
Bias : Bullish continuation favored while price holds above the demand zone and trendline. Pullbacks are considered buying opportunities not selling zones.
Note
Please risk management in trading is a Key so use your money accordingly. If you like the idea then please like and boost. Thank you and Good Luck!

XAUUSD (H4) – Structural OverviewMarket Context:
Price is trading inside a mid-range structure.
Equal highs / liquidity resting near 5,100 – 5,120 zone (PWH / PDH area).
H4 FVG above acting as premium supply.
Clear internal liquidity below around 4,888 – 4,878 (PDL / PWL area).
Recent impulse shows bullish retracement into resistance.
🔎 Technical Bias (Conditional Short Setup)
1️⃣ Liquidity Perspective
Buy-side liquidity resting above 5,100.
Market likely to sweep highs before expansion.
H4 FVG (red zone) = premium sell area.
2️⃣ Structure Logic
Range high respected multiple times.
Weak highs forming → possible liquidity grab.
If price taps 5,100–5,120 and shows rejection → short continuation becomes valid.
🎯 Potential Short Plan (IF confirmation forms)
Entry Zone:
5,095 – 5,120 (Premium / FVG / Liquidity sweep)
Invalidation:
Strong H4 close above 5,130–5,150
Targets:
TP1: 5,045 (range mid / PDH)
TP2: 4,888 (PDL liquidity)
Extended: 4,800 (H4 imbalance)
📌 Alternative Scenario
If price fails to sweep highs and instead breaks above with strong displacement:
→ Market may expand toward 5,250–5,300 liquidity.
No confirmation = No trade.
🧠 Confluences Used
Liquidity theory (BSL / SSL)
Premium vs Discount range
H4 Fair Value Gap
Range structure
Internal liquidity targeting
⚠️ Risk Management Reminder
Risk small (1% or less per idea).
Wait for confirmation (lower timeframe CHoCH / displacement).
Avoid anticipating entries without reaction.

SILVER: Bullish Continuation is Highly Probable! Here is Why:
It is essential that we apply multitimeframe technical analysis and there is no better example of why that is the case than the current SILVER chart which, if analyzed properly, clearly points in the upward direction.
Disclosure: I am part of Trade Nation's Influencer program and receive a monthly fee for using their TradingView charts in my analysis.
❤️ Please, support our work with like & comment! ❤️

$FCX – The Copper Supercycle Breakout!!?The Pattern: NYSE:FCX has completed a massive, 10-year W-Bottom. The first trough was set in 2016 at **$3.52**, followed by a second higher low in 2020 at $4.82. The recent monthly close above the $60.00 neckline validates this multi-year trend reversal.
The Log Target: On a logarithmic scale, the measured move from the $3.52 low to the $60.00 neckline implies a potential technical target in the $1,000+ range if the full percentage-based move replicates. While that is a long-term "moonshot," the immediate linear target sits at roughly $116.48.
Macro Tailwinds: Copper is the "new oil" for the green energy transition and AI infrastructure. Institutions like J.P. Morgan and UBS project a severe supply deficit in 2026, targeting copper prices between $12,500 and $13,000 per metric ton.
Why this is a "Solid" Buy at Support:
Infrastructure Demand: Global demand for copper is accelerating due to EVs, data centers (AI), and grid upgrades, while mine supply growth has fallen to just +1.4% for 2026.
Analyst Backing: Currently, 88% of Wall Street analysts rate NYSE:FCX as a "Strong Buy" or "Buy," with median price targets moving higher as earnings estimates are revised upward.

ETH/USDT | Going above 2100 (READ THE CAPTION)Well hello folks, Amirali here.
By examining the hourly chart of ETHUSDT we can see that after going below the $2000 level last week, it bounced back up and went up all the way to 2108, before dropping back and then going into the consolidation phase.
As long as ETHUSDT keeps itself above the 2050 level, it can go back up to 2150. However, if it goes below 2045 and stabilizes there, another drop would be likely.
Targets for ETHUSDT: 2080, 2095, 2110, 2125, 2140 and 2050.
If ETHUSDT fails to keep itself above: 2040, 2025, 2010 and 1995.

XAUUSD 1H Outlook: Range Rebuild After a Sharp Sell-Off XAUUSD 1H Outlook: Range Rebuild After a Sharp Sell-Off (Liquidity Above, Demand Below)
Gold is currently rebounding into the prior distribution area after the impulsive breakdown. The price action on 1H suggests a controlled recovery (stair-step), but the market is still trading inside a broader supply-to-demand rotation, which keeps today’s bias two-sided: upside liquidity grab first, then potential fade back into support.
Market Structure (1H)
The drop from the top formed a clear bearish displacement, followed by a base-building recovery.
Current leg looks like a retest/mean-reversion toward the mid-range, not a confirmed trend reversal yet.
Expect price to probe liquidity above recent swing highs before deciding continuation.
Key Levels (Support & Resistance)
Resistance
R1: 5045–5055 (current pivot / mid-range supply reaction zone)
R2: 5090–5110 (upper distribution band / likely liquidity magnet)
R3: 5135–5145 (weak highs / premium supply, ideal “stop-run” area)
Support
S1: 4985–5000 (first demand shelf / intraday support)
S2: 4930–4950 (major demand zone on chart, key for bullish defense)
S3: 4660–4680 (strong low / extreme sell-side liquidity area)
Fibonacci Map (From the breakdown swing high → swing low)
0.5–0.618 retracement aligns with the 5090–5110 zone (high-probability reaction area).
0.786+ retracement aligns with 5135–5145 (classic “last squeeze” zone before a fade).
EMA + RSI Read (Execution Filters)
EMA(50/200) on 1H: price is recovering, but unless we reclaim and hold above the faster EMA cluster, upside is likely corrective.
RSI(14): if RSI prints lower highs while price pushes into 5090–5145, that’s a strong divergence signal for a short setup.
Trading Plans (Intraday)
Plan A: Buy the Dip (safer, demand-based)
Wait for a pullback into 4985–5000 or 4930–4950
Confirm with bullish rejection + RSI reclaim 50
Targets: 5045–5055 → 5090–5110
Invalidation: clean 1H close below the demand zone you bought
Plan B: Sell the Squeeze (premium fade)
Let price run stops into 5090–5110 first; ideal extension into 5135–5145
Look for sweep + bearish engulf / displacement and RSI divergence
Targets: 5045 → 5000 → 4950
Invalidation: 1H acceptance above the supply zone (not just a wick)
What I’m Watching Today
If price keeps holding above 4985–5000, the market can squeeze higher into 5090–5110 and potentially 5135–5145 to clean out late shorts. The higher it squeezes into premium, the better the odds of a mean-reversion sell back toward 5000/4950.

Vale momentum, copper growth, and cashVale’s price has been in a strong uptrend, and last week's pullback looks like a normal pause rather than a breakdown: OBV is still trending higher, confirming that volume is flowing with the advance, while an ADX in the low‑40s signals a strong, established trend rather than a choppy range. In the earnings report I really liked the dividends, the growth in base metals/copper specifically, and if iron ore prices actually recover this is going to be an amazing value stock.


BTC back on rise?BTC is gaining strength. Expecting to reach the 75k zone and if breaks through it to hit around 80k.

GOLD Local Short! Sell!
Hello,Traders!
GOLD retraced with strong bullish pullback into premium after discount reaction. Structure remains bearish overall, and 3H horizontal supply is likely to be mitigated again. Expect rejection from supply and continuation toward sell-side liquidity below.Time Frame 3H.
Sell!
Comment and subscribe to help us grow!
Check out other forecasts below too!
Disclosure: I am part of Trade Nation's Influencer program and receive a monthly fee for using their TradingView charts in my analysis.

GOLD PULLBACK AHEAD|SHORT|
✅XAUUSD strong bullish retracement into premium after sell-side liquidity sweep. Price approaching 3H supply where resting sell orders sit. Expect mitigation of supply and bearish reaction targeting internal discount liquidity below.Time Frame 3H.
SHORT🔥
✅Like and subscribe to never miss a new idea!✅

Gold Short Trigger — PRZ Rejection or One More Push?This Gold( OANDA:XAUUSD ) idea is focused on the 15-minute timeframe and is in line with the previous 1-hour idea I shared, where the first target was reached.
Now, let’s see if on the 15-minute chart we can spot a short trigger for gold—stay with me!
Gold appears to be moving within an ascending channel (possible) over the past few hours and is currently near a Potential Reversal Zone (PRZ) and a Time Reversal Zone (TRZ).
I expect gold, upon entering these reversal areas, to resume its decline and fall at least toward the lower line of the ascending channel, around $4,987. If the lower line of the descending channel breaks, we could anticipate a further drop toward the support zone($4,914-$4,878).
First Target: $4,987
Second Target: Support zone($4,914-$4,878)
Third Target: $4,827
Stop Loss(SL): $5,087
Points may shift as the market evolves
What’s your view for the final trading hours of this week? And what trend do you expect for gold next week? Let me know!
💡 Please respect each other's opinions and express agreement or disagreement politely.
📌 Gold Analyze (XAUUSD), 15-minute time frame.
🛑 Always set a Stop Loss(SL) for every position you open.
✅ This is just my idea; I’d love to see your thoughts too!
🔥 If you find it helpful, please BOOST this post and share it with your friends.

A downturn is imminent - 10 Year Treasury Note based analysisIn recent years, many of us acknowledge that the term "recession" has been appearing in news and social media outlets at an increasing rate. While it acts as great clickbait, most sources tend to avoid to avoid a more fundamentals data driven approach, but rather are preferential an opinionated viewpoint from which their viewers can relate. Here I propose a more decisive graphical proof of why I believe some sort of downturn is on the (medium term) horizon, using the 10 year US treasury bond as the foundation, and comparing its recent movements to other typical recession indicators at a long timeframe.
The top graph shows the US YoY interest rate divided by the US 10 year note. Bonds and the interest rate are very closely economically correlated, deviations in the ratio between these two factors provides a very strong indicator (historically) for recession territory. 7 out of 8 times where the white line around 1.2 has been crossed on the 3M chart, as shown by the bottom graph, unemployment is quick to follow with rapid and sharp increases (beginning from red vertical lines).
This white line acts as the point of no return for the economy medium term. The maximum threshold by which historically the balance of the economy tips in one direction, bursting bubbles in favor of what people call a recession, and eventual return to an equilibrium (stability). This was hit in December 2022. While its very hard to tell the exact point where the downturn begins after this point, its obvious (based off this chart alone) one is around the corner.
By no means is this solid proof of anything in the future, but a very simplified graphical comparison between the ratio of two major economic data trends and their historical impact on the rate unemployment. If these historic trends continue to remain strong (as they have done with 88% accuracy since 1971) we should expect a significant economic downturn on the medium term timeframe, between 3-18 months from now. This is not financial advice, derive what you will from this data, let this idea act only as a point of interest - however, I urge sensible and thoughtful investing/trading on medium/short term timeframes with a bias towards the downside and continues high volatility.

GOLD - Consolidation ahead of the news? Will the trend continue?FX:XAUUSD is attempting to recover to $5,000 after a sharp 3.5% drop on Thursday. There are no clear reasons for this. All market attention is focused on today's US inflation report - CPI.
Yesterday's gold sell-off was caused not only by technical factors, but also by capital flight to the dollar amid renewed fears surrounding AI. There was no news driver, the market was overstretched, and the sharp momentum of the dollar triggered sell-offs (liquidations) in the markets.
Despite strong NFP, the market is still pricing in at least two rate cuts this year.
Ahead is CPI — the main trigger: Forecast — Core CPI slowdown to 2.5% y/y. If inflation turns out to be higher than expected, the market will reassess the Fed's plans, which will strengthen the dollar and hit gold.
High volatility is inevitable today.
Resistance levels: 4990, 5100
Support levels: 4944, 4902
Technically, local and global trends are bullish, and any correction could quickly end in growth, especially from strong levels. A breakout of 4990 and maintaining the price above this level could confirm the bullish nature of the market. On news amid high volatility, the market may test the support of the trend and the range of 4878 - 4812.
Negative scenario: a breakout and close below 4800 could trigger a fall to 4700 - 4600.
Best regards, R. Linda!

BTC/USDT | Going back above 70,000? (READ THE CAPTION)After sweeping the initial Buyside Liquidity, BTCUSDT experienced a small correction and then went back higher to 69,482. Currently it's being traded at 69,100. If BTC stabilizes above 69,000, it could go higher to 71,000. But if it fails to hold above there in the coming 2 to 4 hours, it could drop lower to 67,000. However, as long as BTC stays above 66,000, it can still go and retest the resistances above to reach 71,000.
Targets for BTC, should it stay above 69,000: 69,500, 70,000, 70,500 and 71,000.
If it fails: 68,000, 67,500 and 67,000.

USD/JPY | Where to next? USDJPY continued last week's trend of dropping further in price until NFP came out on Wednesday, after a surge in price, it dropped again and then started to consolidate between the IFVG and the demand zone.
Currently USDJPY is being traded at 152.82, if it bounces back up from the Demand Zone, it can go a bit higher and retest the IFVG. If it goes through the IFVG, it can go all the way up to 154.65, however, if it fails to stabilize above 153.60, abort mission.
Targets: 153.00, 153.50, 154.00, 154.30 and 154.65.

NZD/USD | CPI aftermath! (READ THE CAPTION)As you can see in the 30m chart of NZDUSD, last night it had a dramatic fall in price just like the other Forex pairs, and then it continued to drop further and further to 0.6014. With the CPI news coming out, it went up to 0.6043 and then it dropped and went back up several times.
Now, it is being traded at 0.6037, just above the Feb 13th NDOG. If it stabilizes above 0.6040, I expect it to go higher. But if it fails to stabilize there, I expect another drop for AUDUSD.
If it stabilizes above 0.6040: 0.6048, 0.6056 and 0.6064.
If it fails: 0.6030, 0.6022 and 0.6014.
