Gold Analysis Key Changes from the Previous Chart
Entry Triggered/Price Reaction: The price dropped into the support zone of the previous analysis (around 4,179.000) and has since bounced strongly.
Current Status: The price is now trading significantly higher, having cleared the initial Take Profit 1 (TP1) target of 4,203.400 and is currently testing the major resistance area of the previous day's high/Take Profit 2 (TP2).
New Structure: The price has now formed a clear bullish breakout from the previous consolidation area, creating a new, higher demand zone.
Trade Interpretation and Next Steps
The original "Buy Limit" trade (Entry 4,179.000, TP2 4,220.400) would have resulted in a significant unrealized gain.
If a long position was entered at 4,179.000: The current position is in profit and should be monitored for a break of the 4,245.00 area. The stop-loss should be moved to secure profit (e.g., to the previous TP2 level of 4,220.400 or the original entry).
Current Action (Waiting for New Setup): The price is consolidating right below the recent high.
New Buy Scenario: Look for a sustained, strong candle close above 4,245.00 to signal a breakout continuation towards the next major resistance (mentioned in news as 4,252 or 4,300).
Sell/Correction Scenario: If the price rejects the high (4,245.00) and breaks back below 4,220.400 (previous TP2/current support), it may lead to a deeper retracement toward the 4,203.400 level.
The overall sentiment is bullish, but the immediate price action suggests a battle at the $4,240 - $4,245 resistance zone before the next significant move.
Metals

ChatGPT said: XAU/USD – Key Levels & Trade Plan🌐 MARKET CONTEXT
The gold market is currently grappling with a blend of safe-haven demand from heightened geopolitical and economic uncertainty, and the counter-force of a strong USD and shifting expectations on Federal Reserve policy. For example, soft U.S. data earlier this week reinforced hopes for a rate cut — driving gold higher.
Trading Economics
+3
Reuters
+3
Forex
+3
Analysts note that gold may remain in a corrective or consolidative phase ahead of further major macro prints (inflation, labor, Fed commentary).
Outlook Business
+1
Sentiment snapshot:
Gold benefits when risk-off and real yields fall → bullish.
Gold suffers if USD strengthens or the Fed signals caution → bearish.
Heading into the London → New York sessions, expect volatility and a tug-of-war between liquidity grabs and structural reactions.
Bias today: Conditionally bullish (on demand zones) but ready for bearish rejection from supply.
📉 TECHNICAL ANALYSIS (SMC + Liquidity Structure)
Price appears to be in a wider swing, with identifiable supply clusters above and demand zones below.
Look for structural signals: a BOS (Break of Structure) for continuation, or a CHoCH (Change of Character) for reversal.
Liquidity behaviour:
Supply: zones where price may enter, sweep for stop-losses, then reverse (trap buys then sell).
Demand: zones where price may drop, sweep low liquidity, then bounce → good long setups.
Confirmation: watch for liquidity sweep + rejection candle + smaller-timeframe structure (M5/M15) before committing.
Example logic: If price hits the sell zone (4,343-4,041) and shows a wick above then selling momentum → short scenario. If price retraces into buy zones (4,121-4,123) or lower and shows a reversal pattern → long scenario.
🔑 KEY PRICE ZONES
4,343 – 4,041 ▶️ Sell Zone – major supply cluster; possible reversal trigger.
4,247 – 4,246 ▶️ Sell Zone – secondary supply for shorter term.
4,174 – 4,172 ▶️ Buy Zone – structural demand; medium-term long opportunity.
4,121 – 4,123 ▶️ Buy Zone – lower demand entry; intraday long focus.
Stop-loss levels:
For 4,343-4,041 Sell: Stop-loss at 4,349.
For 4,247-4,246 Sell: Stop-loss at 4,253.
For Buy 4,174-4,172: Stop-loss at 4,166.
For Buy 4,121-4,123: Stop-loss at 4,115.
⚙️ TRADE SETUPS
✅ BUY SCENARIO 1 – STRUCTURAL DEMAND (MEDIUM)
Entry: 4,174 – 4,172
Stop-loss: 4,166
TP1: ~4,200 TP2: ~4,240 TP3: Open
Logic: Price returns to this demand zone and confirms via sweep/rejection → long bias.
✅ BUY SCENARIO 2 – INTRADAY REACTION DEMAND
Entry: 4,121 – 4,123
Stop-loss: 4,115
TP1: ~4,150 TP2: ~4,190 TP3: Open
Logic: Reactive long from lower demand base; good for London session.
⚠️ SELL SCENARIO 1 – PRIMARY SUPPLY REJECTION
Entry: 4,343 – 4,041
Stop-loss: 4,349
TP1: ~4,200 TP2: ~4,120 TP3: ~4,046
Logic: Price into major supply zone; wait for clear rejection (wick, reversal candle) then short.
⚠️ SELL SCENARIO 2 – SECONDARY SUPPLY
Entry: 4,247 – 4,246
Stop-loss: 4,253
TP1: ~4,200 TP2: ~4,160 TP3: ~4,121
Logic: Shorter-term supply zone; less range but still valid if momentum falters.
🧠 NOTES / SESSION PLAN
London session: focus on buy setups from 4,121 and 4,174 zones.
New York session: monitor sell setups if price reaches 4,247-4,246 or 4,343-4,041 with rejection.
Avoid trading blindly into zones without confirmation – wait for structure on M5/M15.
Risk management: each trade risking ≤ 2% account; alter size accordingly.
Be alert for macro data/voxpops from Fed that may trigger stop-runs and false breakouts.
Trail stops once TP1 is achieved; consider reducing position after strong move.
🏁 CONCLUSION
Today’s bias: conditional bullish but remains flexible to bearish reversal.
Primary long zones: 4,174-4,172 and 4,121-4,123.
Primary short zones: 4,343-4,041 (major) and 4,247-4,246 (secondary).
Trade with discipline — entry only after confirmation, strict stop-loss, and clear risk/reward.

Stop!Loss|Market View: SILVER🙌 Stop!Loss team welcomes you❗️
In this post, we're going to talk about the near-term outlook for SILVER ☝️
Potential trade setup:
🔔Entry level: 52.10719
💰TP: 48.72093
⛔️SL: 53.72120
"Market View" - a brief analysis of trading instruments, covering the most important aspects of the FOREX market.
👇 In the comments 👇 you can type the trading instrument you'd like to analyze, and we'll talk about it in our next posts.
💬 Description: The price is currently potentially forming a double-top reversal pattern. There's a large accumulation of buyers near 53-54, and if they manage to maintain the price at these levels, silver will rise toward 56. However, if the price reaches 52, we can expect a pullback to 48-49, from where, in the longer term, a decline to 40-42 is possible.
Thanks for your support 🚀
Profits for all ✅

XAUUSD H1 – Liquidity shift ahead: patience before next moveAfter a sharp impulsive leg, Gold (XAUUSD) is now moving within a narrow intraday range — balancing between a fresh Buy Zone (4190–4185) and a potential Sell Zone (4242–4246).
This structure suggests that Smart Money may be engineering liquidity on both sides before committing to the next directional move.
The current BMS at 4180 confirms bullish intent, but the premium area near 4240+ aligns with FIB 1.5–1.618 extensions, making it a high-probability zone for a short-term reaction or liquidity grab before continuation.
Meanwhile, the Buy Zone (4190–4185) remains a clean mitigation area in confluence with prior displacement — a classic “re-entry pocket” if price retraces to rebalance inefficiency.
💎 Trading Outlook
SELL ZONE: 4242 – 4246 (SL 4250) → Watch for a liquidity sweep and reaction confirmation.
BUY ZONE: 4190 – 4185 (SL 4180) → Wait for CHoCH confirmation before long entries.
TARGET: 4240 → 4246 → 4210 (liquidity ladder setup).
At this stage, chasing impulsive candles offers little edge.
The better approach is to let liquidity build, wait for reaction, and trade confirmation — not emotion. 🌙
💭 Karina’s Note
Every imbalance tells a story — of where liquidity was taken and where it will be delivered next.
Your patience is the real entry. 💛
This is my personal view based on SMC principles – not financial advice.
✨ Like & Follow for daily London session updates ✨

XAU/USD – Bearish Pullback Suggests a Deeper Correction Ahead Gold is showing clear signs of weakening momentum on the H1 timeframe as price forms a flat-top rejection near 4,232–4,235, a zone where buyers have repeatedly failed to break higher. This signals the early stage of a potential deeper correction.
Current price action shows a weak technical pullback into EMA9, while the newly formed lower high – lower low structure confirms short-term bearish pressure. A descending trendline has developed, indicating sellers are gradually regaining control.
Key Technical Levels
Resistance
4,232 – 4,235: Major rejection zone (flat-top structure).
EMA9 around 4,194: Acting as dynamic resistance during the pullback.
Support
4,115 – 4,120: Critical neckline of the structure; a break opens room for deeper downside.
3,985 – 4,000: Strong support, aligning with the previous major swing low.
Technical Breakdown – Tools & Signals
Fibonacci: Previous decline bounced at the 38.2% level; the weak reaction suggests price may return to test 50%–61.8%, aligning with 4,115.
Trendline: The short-term descending trendline is guiding the correction. Only a clean break above it will shift momentum.
EMA9: Price is testing but failing to reclaim the EMA, showing fading buying strength.
RSI: Bearish divergence from the previous top reinforces the downside scenario.
Trading Strategy
1. Sell the Pullback (Primary Setup)
Entry: 4,205 – 4,215 (EMA9 + descending trendline confluence)
Target 1: 4,115
Target 2: 3,985
Stop-loss: 4,245 (above flat-top resistance)
2. Sell on Breakdown
Condition: H1 candle closes below 4,115
Target: 3,985
Stop-loss: 4,145
3. Short-term Buy (Only with clear reversal signals)
Buy Zone: 3,985 – 4,000
Reason: This is a major demand zone with historical strong reactions.
Market Outlook
Short-term structure is shifting bearish. The current recovery appears corrective, not impulsive—suggesting sellers may soon take over again unless price breaks above 4,215–4,225.
If this analysis helps your trading, feel free to follow for more daily XAU/USD strategies.

GOLD H1 – Gold Awaits U.S. PPI Data for Directional Clarity🟡 XAUUSD – Intraday Smart Money Plan | by Ryan_TitanTrader (13/11)
📈 Market Context
Gold is consolidating after a strong impulsive leg, with intraday traders now focused on the upcoming U.S. Producer Price Index (PPI) release — a key inflation metric that often shapes Fed expectations.
• A hot PPI reading could strengthen the USD and trigger a sell-off from premium levels.
• A softer print may weaken the dollar, encouraging another liquidity grab above 4250.
Institutional order flow shows potential for engineered liquidity sweeps around both extremes before the next directional push.
🔎 Technical Analysis (1H / SMC Structure)
• Structure: Still bullish overall, but showing early distribution near the 4250 handle.
• Premium Zone: 4255–4253 aligns with an unmitigated supply and prior buy-side liquidity pool — a prime short setup if price reacts after a liquidity sweep.
• Discount Zone: 4168–4166 sits within the recent FVG and above EMA100 — a valid area for re-accumulation and continuation if price corrects deeper.
• Liquidity: Equal highs at 4255 and lows near 4156 signal potential stop-hunt traps before a decisive move.
🔴 Sell Setup (Premium Reaction Zone)
• Entry: 4,255 – 4,253
• Stop-Loss: 4,265
• Take-Profit Targets:
→ 4,182 (previous BOS zone)
→ 4,148 (mid-range equilibrium)
→ 4,110 (discount reaction zone)
📌 Valid only if price sweeps buy-side liquidity and confirms bearish BOS on M5–M15.
🟢 Buy Setup (Discount Reaction Zone)
• Entry: 4,166 – 4,168
• Stop-Loss: 4,156
• Take-Profit Targets:
→ 4,210 (short-term liquidity pocket)
→ 4,248 (imbalance fill zone)
→ 4,255 (final liquidity target)
📌 Valid only if price mitigates the FVG and reclaims structure with bullish BOS confirmation.
⚠️ Risk Management Notes
• Wait for PPI volatility before entering trades.
• Avoid trading mid-range (4180–4210) – low R/R zone.
• Scale out partials near liquidity points and trail stops post-confirmation.
• Maintain disciplined risk: 1–2% max per setup.
Summary
Gold is in pre-news equilibrium, with both buy- and sell-side liquidity pools clearly defined:
• Sell zone: 4255–4253 (premium reaction area)
• Buy zone: 4168–4166 (discount re-entry area)
Expect engineered liquidity grabs before a decisive move — patience and structure confirmation remain key.
📍Follow @Ryan_TitanTrader for real-time Smart Money updates ⚡

Risk appetite will return again! With all the FUD that's going around in the market, I look back to dr. copper! Sometimes it's important to look back at the fundamentals and then you'll realize, everything is playing out the way it should.
Extreme bearish deviation from the mean on the COPPER/GOLD ratio
Massive macro pitchfork bottom reoccurring
Small caps can't catch a breath
All while talks of QE just being around the corner!
I don't believe the current liquidity strain on the system (High SOFR spreads, Large TGA build up, Lowest reverse repo reserves, Low bank reserves) will last too long before the printer restarts. Powell knows this!

Gold price analysis November 13
Gold continues to maintain its bullish momentum after successfully breaking above the 4150 resistance zone. This breakout confirms the strength of the uptrend, with the recently broken area now acting as a solid support base. The next target that buyers are likely aiming for is around 4250, before testing the all-time high zone.
From a trading perspective, the focus remains on BUY setups—either on breakout entries or pullbacks to support. As long as price holds above 4150, the bias stays bullish and traders can consider holding positions to extend profits along the trend.
BUY setup: Watch for price reaction around 4150 support
💬 Feel free to share your thoughts and analysis below. I’d love to hear different perspectives from the community!

Will gold continue to fall?Gold finally saw a correction, closing lower on the daily chart. However, it's worth noting the technical aspects: the retracement in the NY market on the daily chart didn't break the 5-day moving average, and after finding support at 4145, it rebounded sharply. Currently, the latest 5-day moving average on the daily chart is moving up to around 4157, and the 10-day and 7-day moving averages are trending upwards. Gold prices are maintaining their position within the upper Bollinger Band channel on the daily chart, and the RSI indicator is above the midline.
On the shorter-term 4-hour chart, moving averages are converging, and gold prices are maintaining their position within the upper Bollinger Band channel. The RSI indicator is pulling back and trading near the midline. The main trading strategy for Friday is to buy low and sell high, expecting gold to trade in a wide range, potentially continuing its intraday correction followed by a further rise, then a pullback after reaching a high in the US session. Gold's strength is driven by both safe-haven demand and expectations of a potential Fed rate cut. Intraday trading will depend on its performance against key resistance levels, as well as the correlation between the dollar and US Treasury yields. However, the current trend remains primarily upward with limited downside potential.
Key Levels:
First Support: 4152, Second Support: 4130, Third Support: 4100
First Resistance: 4208, Second Resistance: 4225, Third Resistance: 4250
Gold Intraday Trading Strategy:
Buy: 4150-4155, SL: 4140, TP: 4175-4185;
Sell: 4230-4235, SL: 4245, TP: 4215-4205;
More Analysis →

**“Friday Play: Watching GC for a potential continuation lowerAfter the 4240 liquidity clear. Today’s open (4174.9) is my decision point.
Two scenarios I’m stalking:
1️⃣ Break & retest below 4174 → downside continuation into the H4 bullish FVG (4060–4090).
2️⃣ Sweep above 4200–4215 → rejection → short from premium pricing.
Friday loves completing unfinished business — but only if orderflow confirms. Patience first.”**

Gold 30-Min — Volume Buy & Sell Reversals Triggered⚡Base : Hanzo Trading Alpha Algorithm
The algorithm calculates volatility displacement vs liquidity recovery, identifying where probability meets imbalance.
It trades only where precision, volume, and manipulation intersect —only logic.
✈️ Technical Reasons
/ Direction — LONG / Reversal 4178
☄️Bullish momentum confirmed through strong candle body.
☄️Structure shifted with higher-low near key demand base.
☄️Volume expanding confirms order-flow alignment upward.
☄️Buyers reclaimed imbalance with sustained clean break.
☄️Algorithm detects rising momentum under low liquidity.
✈️ Technical Reasons
/ Direction — SHORT / Reversal 4242
☄️Bearish rejection confirmed through sharp candle body.
☄️Lower-high forming beneath resistance supply region.
☄️Volume decreasing confirms exhaustion in price rally.
☄️Sellers regained imbalance with heavy top rejection.
☄️Algorithm detects fading demand and shift to control.
⚙️ Hanzo Alpha Trading Protocol
The Alpha Candle defines the day’s real control zone — the first battle of momentum.
From this origin, the Volume Window reveals where the next precision strike begins.
⚙️ Hanzo Volume Window / Map
Window tracked from 10:30 — mapping true market behavior.
POC alignment exposes institutional bias and breakout potential zones.
⚙️ Hanzo Delta Window / Pulse
Delta window monitors real buying vs. selling power behind each move.
Tracks volume aggression to expose who controls the candle — buyers or sellers.
When Delta aligns with Volume Map, momentum becomes undeniable.

GOLD DAILY CHART ROUTE MAPHey everyone,
Please review our Daily Chart Route Map, now featuring updated levels for tracking Golds movement.
We continue to track our refreshed proprietary Goldturn Channel, our unique method for constructing ascending channels. Price action is now testing the swing range and the swing range seems to be holding support as expected. This swing range support also falls inline with the channel half line providing stronger support.
As long as ema5 remains above the swing zone we expect price to play between this range until the full updated long term swing is completed into 4145. An ema5 break below the swing range will open the lower channel floor for test, currently sitting at 3824
As always, we will keep you all updated with regular updates throughout the week and how we manage the active ideas and setups. Thank you all for your likes, comments and follows, we really appreciate it!
Mr Gold
GoldViewFX

Silver turns negative but is this really a double top?Gold and silver have turned lower along with global indices, as risk sentiment turns sour. With silver prices having formed a potential double top at record highs above $54, should investors be concerned with this renewed selling pressure?
Well, firstly is it really a double top pattern? It is still a tentative bearish signal, the fact that prices have reversed after nearing the old high. This could be a false signal so we should be careful in drawing any conclusions from it yet. A double top without break of the neckline is not of itself a significantly bearish sign, but a waring for the late buyers, nonetheless. As a minimum, silver will need to break and close below $50 for me to turn decisively bearish on silver again. Dip-buying rules, until the charts tell us otherwise.
Key levels shown on chart.
By Fawad Razaqzada, market analyst with FOREX.com

XAU/USD – Rate Cut Hope vs Supply Trap?🌐 MARKET CONTEXT
Gold is trading near elevated levels as markets increasingly price in a rate cut by Federal Reserve in December. Spot gold climbed above US$4,130/oz driven by a weaker dollar and relief over the U.S. government shutdown ending.
Reuters
+2
Saxo Bank
+2
Despite this strength, analysts still view gold as being in a corrective range, awaiting key U.S. inflation data and monetary-policy signals.
The Economic Times
+1
Sentiment is tilted toward risk-on for gold (i.e., bullish) given dovish expectations, but the upside is capped by supply zones and the possibility of a rejection if data surprises to the upside for the dollar.
For the upcoming London → New York sessions, expect volatility and trading around structural zones rather than trending breakout.
Bias for today: Conditional bullish, but prepared for a bearish bias if supply triggers rejection.
📉 TECHNICAL ANALYSIS (SMC + Liquidity Structure)
Price is in a broad up-trend, but currently approaching high-probability supply zones where prior imbalances may repeat.
Key structures to monitor:
A potential BOS (Break of Structure) upward if demand zones hold.
A potential CHoCH (Change of Character) if supply rejects and price turns lower.
Demand zones: strong structural support and liquidity pools lie lower in the 3,900s region.
Supply zones: clusters of untested supply exist near 4,080 + where stop-runs and trap buys may occur.
Confirmation factors: liquidity sweeps (stop-loss hunts), fake breakout then reversal, mid-timeframe (M5/M15) rejection candles.
Example logic: If price enters 4,080-4,078 zone and shows a wick, then rally fails → likely a supply trap and short scenario. Conversely, if price falls into 3,990-3,988 and sweeps then reverses → possible CHoCH to bullish.
🔑 KEY PRICE ZONES
4,080 – 4,078 ▶️ Sell Zone – High-probability supply, reactive short.
4,161 – 4,163 ▶️ Buy Zone – Higher structural support / breakout-target area for long.
4,081 – 4,083 ▶️ Buy Zone – Mid-structural demand zone, smaller long setup.
3,990 – 3,988 ▶️ Buy Zone – Deep support, high reward if confirmed.
Stop-loss levels:
For sell zone: 4,086
For buy zone (4,161): 4,155
For buy zone (4,081): 4,075
For buy zone (3,990): 3,982
⚙️ TRADE SETUPS
✅ BUY SCENARIO 1 – STRUCTURAL HIGH BUY
Entry: 4,161 – 4,163
Stop-loss: 4,155
TP1: ~4,180 TP2: ~4,210 TP3: Open
Logic: A strong bounce in this zone indicates continuation of bullish structure, valid for London session.
✅ BUY SCENARIO 2 – MID-DEMAND REACTION
Entry: 4,081 – 4,083
Stop-loss: 4,075
TP1: ~4,100 TP2: ~4,135 TP3: Open
Logic: Reactive long in mid-structure; lower risk, good for intraday.
✅ BUY SCENARIO 3 – DEEP SUPPORT ACCUMULATION
Entry: 3,990 – 3,988
Stop-loss: 3,982
TP1: ~4,020 TP2: ~4,060 TP3: ~4,100+
Logic: High reward scenario if price sweeps down and reverses from strong support.
⚠️ SELL SCENARIO – NY SESSION SUPPLY REJECTION
Entry: 4,080 – 4,078
Stop-loss: 4,086
TP1: ~4,040 TP2: ~3,990 TP3: ~3,930
Logic: Supply zone with liquidity; if price enters and shows rejection → shift to short bias.
🧠 NOTES / SESSION PLAN
London session: focus on buy setups from zones at 4,081 and 3,990.
NY session: monitor sell scenario around 4,080–4,078 for reactive short.
Avoid entering right on news release; wait for structure confirmation (M5/M15).
Maintain risk ≤ 2% per trade; trail stops after TP1 hit.
Be aware of macro risk: U.S. inflation data and Fed commentary may cause sudden moves.
If price gets stuck or choppy in zone without confirmation → stay out rather than forcing a trade.
🏁 CONCLUSION
Today’s bias: conditional bullish, favouring longs from confirmed support zones 4,161–4,163, 4,081–4,083, and 3,990–3,988.
But remain ready to switch to a bearish scenario if price triggers the supply zone at 4,080–4,078 and displays rejection.
Trade with discipline, wait for confirmation, and manage risk strictly.

USDCAD still going DOWN.USDCAD is in a pullback and showing signs of pulling back down with about 1:2 RR.

Daily Outlook on GSVR Guanajuato Silver CompanyThis is my updated daily outlook on TSXV:GSVR . The last outlook has played out pretty well so far (see linked publications), will the next leg?
We are at the point in the chart were yellow wave (3) could be underway, if so we should see a strong move higher with GSVR potentially moving 150+ %.
More comments on the chart.

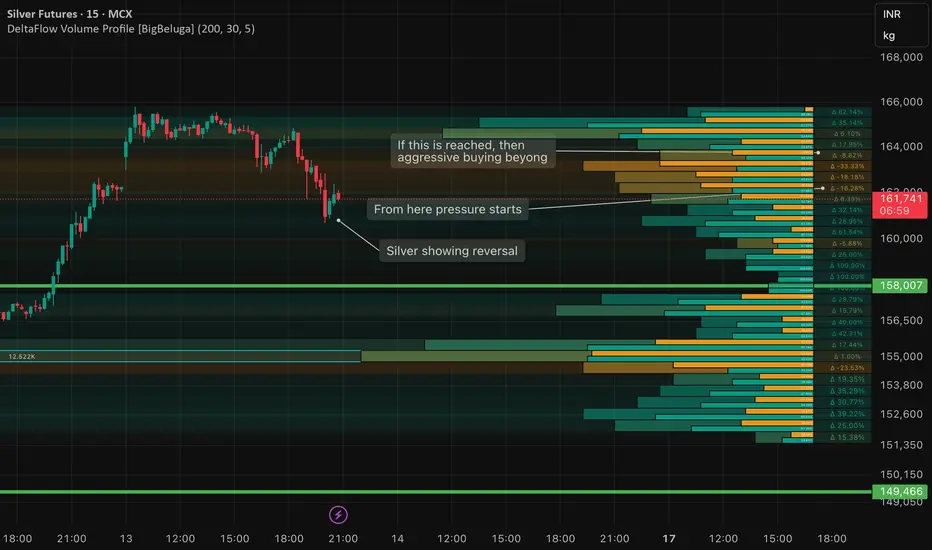
SILVER showing reversal from lower levels as US Govt reopensSilver crashes and wipes away entire day's gain by falling around 3000 points on MCX and is now showing a reversal on 15 min chart as investors turned to precious metals as a hedge against rising global uncertainties. Hopes of upcoming Federal Reserve rate cuts—driven by signs of a softening US job market—also boosted sentiment. Supply-side worries added further support, with India’s wedding season increasing demand and concerns emerging over possible US tariffs on silver. Additionally, the US Department of the Interior recently classified silver, copper, and metallurgical coal as “critical minerals,” underscoring their strategic economic importance. This new status could pave the way for Section 232 investigations and potential trade restrictions, similar to the actions taken on copper earlier this year.
US100 – Consolidation Between FVGs, Watching for Bullish BreakouHello traders,
On the daily timeframe, NASDAQ (US100) is currently consolidating between a bullish and a bearish Fair Value Gap (FVG). Both sides present clear liquidity areas, and the market is preparing for its next directional move.
From my perspective, I’d like to see the price tap into the bullish FVG first, react from that zone, and then invalidate the bearish FVG on its way higher.
If this scenario plays out, the next targets would be the equal highs (EQH) and eventually a new all-time high (ATH).
However, if a daily candle closes below the bullish FVG, this idea becomes invalid and we could expect further downside movement.
For now, I remain bullish while the bullish FVG holds. 📈
💌It is my honor to share your comments with me💌
🔎 DYOR
💡Wait for the update!

Silver Cup & Handle formation!In Daily charts, the Silver seems to be forming a "Cup & Handle" formation that may drop the price around 52...

GOLD: Big Pullback Loading Before a 4400 Rally?Bias: Bullish – Buy-the-Dip Strategy
Approach: Smart Money Concepts (SMC)
🌐 Market Context
Gold continues to show a strong recovery, maintaining a clear bullish structure across the H1, H4, and Daily timeframes.
Institutional order flow remains firmly on the buy-side as:
Liquidity on H1/H4 highs is being swept consistently
Pullbacks are respecting Demand Order Blocks (OBs)
Multiple Breaks of Structure (BOS) confirm bullish continuation
However, the region 4280 – 4330 (FVG + major trap zone) has historically triggered strong distribution – making it a likely area for liquidity hunts and fake breakouts before any corrective move.
🎯 Key Price Levels
🔴 Resistance Zones (Potential Distribution Areas)
4274 – 4295
4330 – 4345 (FVG + Biggest Trap Zone)
Expect volatility and sharp reactions here – suitable for partial profit-taking, not for chasing buy entries.
🟢 Support / Buy Zones (Institutional Demand Areas)
1️⃣ BUY Opportunity – Shallow Pullback (High Probability)
Entry: 4170 – 4190 (H4 OB + BOS retest)
SL: Below 4170
TP1: 4275
TP2: 4360 – 4400
➡️ This is today’s primary setup. Requires clear bullish confirmation on entry.
2️⃣ BUY Opportunity – Deep Pullback (High R:R Setup)
Entry: 4100 – 4120 (Deep OB + liquidity sweep level)
SL: Below 4100
TP1: 4275
TP2: 4360 – 4400
➡️ Best scenario if the market retraces deeply — exceptional Risk:Reward.
📉 Why Selling Is Not a Priority
Despite resistance overhead, the market remains:
Bullish in structure
Supported by demand zones
Without a confirmed Market Structure Shift (MSS) → Bearish BOS
Therefore, selling remains counter-trend and not part of the main trading plan today.
📈 Institutional Technical Outlook (H1/H4)
1. Price approaching 4280 – 4330 trap zone
Expect:
Liquidity sweeps
Wick-driven false breakouts
Short-term corrections back into OB before continuing upwards
2. Liquidity Map
4170 liquidity pool below current price → likely target for engineered pullback
4300 – 4350 equal highs → attractive upside draw for smart money
🧠 Professional Trade Plan Summary
✔️ Do not chase breakouts near resistance
✔️ Wait for price to retrace into:
4170 – 4190
4100 – 4120
✔️ Main targets:
TP1: 4275
TP2: 4360 – 4400
✔️ At TP1:
Secure 50%
Move SL to Break-Even
✔️ Plan invalidation if price closes below 4100
📌 Notes for Large-Capital Traders (UK/EU)
Today’s environment is ideal for high-quality, low-frequency entries at institutional demand zones.
Avoid buying at highs; patience will deliver the best setups.
This plan follows a clean institutional trend-following methodology — suitable for accounts prioritising consistency and low drawdown.
📊 Daily Bias: Strong BUY
⏳ Waiting for pullback towards 4170 – 4190 or 4100 – 4120
🚀 Targeting 4360 – 4400 over the next sessions

XAUUSD Short: Rejection From Supply Targets $4,070 Demand LineHello traders! Gold (XAUUSD) is showing signs of a potential corrective move after a strong bullish rally from the $3,950–$3,970 Demand Zone, where multiple fake breakouts confirmed the presence of strong buyers. This area coincides with the ascending Demand Line, which has provided consistent support for price growth. Each touch on this line has led to notable bullish impulses, signaling accumulation and strengthening buyer momentum.
Currently, the price approached the $4,140–$4,160 Supply Zone, which aligns with both a Supply Line and the neckline of a previous Double Top pattern. This confluence area represents a critical resistance zone where sellers have historically regained control. The current rejection from this level suggests that a short-term pullback could be underway as the market seeks to retest lower support.
I expect the first key area to watch is the $4,070 pivot level, which aligns with the Demand Line. This zone is expected to act as dynamic support for a potential rebound. If price holds above this level, the bullish structure remains valid, with a possible retest of the $4,150–$4,160 Supply Zone. However, a confirmed break below $4,070 could trigger a deeper correction toward the $3,950 Demand Zone, where fresh buying opportunities may emerge. Manage your risk!

Gold Tries Another JumpThere is clear upward pressure coming to gold from silver. Perhaps another leg higher to 4270? I'm waiting for a breakout to enter position.

XAUUSD: Market Analysis and Strategy for November 13Gold Technical Analysis:
Daily Resistance: 4275, Support: 4050
4-Hour Resistance: 4240, Support: 4155
1-Hour Resistance: 4240, Support: 4210
Technically, the monthly and weekly charts still indicate an upward trend. The daily chart shows a very standard and gradually completing "rounded bottom" pattern. The current candlestick pattern presents key resistance around 4262-4275, a previous support/resistance level. Historically, a downward correction is likely. We need to be cautious on Thursday and Friday, focusing on the support zone of 4160/4155, and also monitoring the continuation of the trend after a breakout above 4300. If the price falls back below 4080, a target of 4000 could be reached. The main strategy for gold in the near term is to continue the upward trend!
Looking at the 1-hour chart, the moving averages are diverging upwards, providing support. Note the Bollinger Bands are narrowing upwards, and the MACD/KDJ indicators are providing upward momentum. Today, Thursday, the risk of a bearish market is increasing, and the short-term market continuity remains to be seen. During the European and American sessions, pay attention to whether the price can stabilize around the 4204 support level.
The first strategy is to buy at the current price, which is relatively risky. A safer strategy is to look for pullbacks to around 4204/4200 to enter the market.
A cautious strategy:
BUY: 4204~4200
