GOLD: Bullish Above 4151 as Fed Cut Odds Hit 80%FX:XAUUSD is trading above 4151, supported by a weaker U.S. dollar and rising expectations of Federal Reserve policy easing.
Recent U.S. data added to this momentum:
-PPI inflation showed signs of slowing
-Retail sales and consumer confidence came in weaker
-Market expectations for a December Fed rate cut have climbed to 80%
However, progress in Russia–Ukraine negotiations is capping aggressive upside movement.
Today, markets focus on jobless claims and durable goods orders, both of which could shape short-term volatility.
Gold is holding steadily above 4151, which supports continuation of the bullish momentum toward 4172 and 4207.
A breakout above 4207 would open the path toward 4236–4237.
If the price closes a 1H candle below 4150, a correction toward 4128 is expected.
Pivot Line: 4151
Resistance: 4172 · 4207 · 4236
Support: 4140 · 4128 · 4113
Metals

Gold H1 – Will 4212 Hold and Drop to 4160 Today?🟡 XAUUSD – Intraday Smart Money Plan | by Ryan_TitanTrader (27/11)
📈 Market Context
Gold is currently trading within a rising institutional channel after strong H1 displacement. The market is compressing into a liquidity-rich consolidation phase — a classic Smart Money trap environment before engineered expansion.
What Smart Money desks are targeting today:
• Expectation of USD strength shaping bearish bias
• Liquidity sweeps above internal range highs
• Consolidation fakeouts to induce retail mis-positioning
• CHoCH/BOS confirmation required before real directional move
The chart shows equal liquidity zones positioned at premium (sell opportunity) and discount (re-entry buy region).
🔎 Technical Framework – Smart Money Structure (H1)
Current state = Accumulation / Redistribution phase
Liquidity map highlighted zones:
• Premium liquidity zone: 4212 – 4214 (target for short trap)
• Discount liquidity origin zone: 4165 – 4163 (higher timeframe demand re-entry)
• Equilibrium / Chop zone: 4180 – 4195 (no trade unless displaced)
• Trendline support: ~4173 region (must break for downside continuation)
Expected sequence:
Sweep → CHoCH/MSS → BOS → Displacement → Retest (FVG/OB) → Expansion
🎯 Trade Plans for Today
🔴 SELL GOLD 4212 – 4214 | SL 4222
Thesis: Liquidity sweep at premium highs before bearish displacement
Entry activation rules (must wait):
• Price taps 4214 liquidity pocket
• Bearish CHoCH/MSS + BOS down on M5–M15
• Entry taken at FVG fill or order block retest after BOS
Targets:
1. 4200 (first reaction)
2. 4187 – 4185 (BOS retest zone)
3. 4170 (channel mid-equilibrium)
4. 4165 – 4163 (H1 demand retest / profit core)
🟢 BUY GOLD 4165 – 4163 | SL 4143
Thesis: Discount origin tap for impulse continuation buy
Entry activation rules (must wait):
• Price sweeps into 4163 pool
• Bullish CHoCH/MSS + BOS up on M5–M15
• Strong bullish rejection wick + FVG fill confirmation
Targets:
1. 4185 – 4187 reclaim zone
2. 4200+ institutional expansion target
3. 4212+ premium revisit
⚠️ Risk Management
• Avoid trading inside 4180 – 4195 unless displaced
• Do NOT interpret sweeps as trend entries — they are traps
• SL = structure invalidation, no averaging in consolidation
• Reduce size during monetary headlines unless MSS confirms
📝 Summary
Gold is currently in engineered liquidity mode. Expect either:
• Sweep 4214 → MSS/BOS down → drop into 4163 discount retest,
or
• Tap 4163 → bullish MSS/BOS up → expand toward 4200 – 4212+
Today = confirmation-based execution only, not trend chasing.
📍 Follow @Ryan_TitanTrader for daily Smart Money updates.

CopperXCUUSD
- Bullish Channel as an corrective pattern in Short Time Frame
- Resistance Level
- RSI - Divergence
- Completed " 1234 " Impulsive Waves
- BSL

GOLD Sellers In Panic! BUY!
My dear friends,
Please, find my technical outlook for GOLD below:
The price is coiling around a solid key level - 4164.3
Bias - Bullish
Technical Indicators: Pivot Points Low anticipates a potential price reversal.
Super trend shows a clear buy, giving a perfect indicators' convergence.
Goal - 4176.6
Safe Stop Loss - 4157.5
About Used Indicators:
The pivot point itself is simply the average of the high, low and closing prices from the previous trading day.
Disclosure: I am part of Trade Nation's Influencer program and receive a monthly fee for using their TradingView charts in my analysis.
———————————
WISH YOU ALL LUCK

USDJPY: bullish potential 🛠 Technical Analysis: On the 4-hour timeframe, USDJPY remains in a strong uptrend, moving within an ascending channel and respecting a key ascending trendline. The "Global bullish signal" (Golden Cross) is in effect, with the price currently pulling back into a bull flag pattern, finding support at the 155.380 level and the 50 SMA. The projected setup anticipates a bullish bounce from this strong confluence of support, leading to a breakout from the consolidation pattern to re-test the upper channel resistance.
🌍 Fundamental Analysis: The Yen is finding short-term support from today's firm Tokyo CPI data (2.7% YoY), which is fueling speculation that the Bank of Japan may hike interest rates again as soon as December. This fundamental pressure is causing the current pullback, while the US Dollar is experiencing very thin liquidity following the Thanksgiving holiday. Traders are now watching to see if the dominant, long-term technical uptrend can absorb this news and resume its upward path.
❗️ Trade Parameters (BUY) ❗️
➡️ Entry Point: Buy on breakout of the local resistance (approx. 156.476)
🎯 Take Profit: 159.593
🔴 Stop Loss: 155.242
⚠️ Disclaimer: This is a potential trade idea based on current analysis; market conditions and price direction are subject to change based on news factors and volatility.

Gold Eyes 4,110 — USD Weakness Could Fuel the Next Leg Up!!Hey Traders,
In today's trading session we are monitoring GOLD (XAUUSD) for a potential buying opportunity around the 4,110 zone. Gold continues to trade firmly within an established uptrend, and the current pullback is bringing price right into a key support + trend confluence at 4,110 — a zone where buyers have consistently stepped in.
Macro context supports this setup:
The US Dollar has been losing momentum, pressured by rising expectations of a December FED rate cut and increasingly soft economic data. Weak labor market signals, cooler inflation trends, and shifting rate expectations have collectively weighed on the DXY.
A softening USD typically acts as a tailwind for gold, especially in environments where monetary policy is turning more accommodative.
If the Dollar continues to slide, it could provide the catalyst needed for Gold to resume its bullish leg off the 4,110 support zone.
Trade safe,
Joe

DeGRAM | GOLD is correcting📊 Technical Analysis
● XAU/USD rejected the upper boundary of the ascending channel and the 4,185–4,195 resistance area, producing a sharp bearish reaction and breaking intraday momentum.
● Price is retesting the mid-channel zone, and failure to reclaim 4,175 increases the probability of a drop toward 4,167 and the deeper support at 4,155.
💡 Fundamental Analysis
● Gold is pressured by a mild rebound in U.S. yields after stronger jobless-claims data, limiting short-term upside.
✨ Summary
● Bearish bias below 4,175. Targets: 4,167 → 4,155. Resistance: 4,185.
-------------------
Share your opinion in the comments and support the idea with a like. Thanks for your support!
Gold Buyers Regain Momentum — Aiming for 4,240 RetestHello traders! Let’s break down the current XAUUSD structure. Gold is trading within a broad ascending structure after forming a strong local bottom around the Support Line, where buyers entered the market and started to push the price higher. This upward movement follows a long corrective phase, during which the price respected the diagonal Support Line multiple times — confirming the presence of a stable bullish trend. Earlier, XAUUSD broke out of the Buyer Zone (4,110–4,120), retested it, and successfully held above it. This zone now acts as a key demand area and the primary level where buyers continue defending the trend. A previous bearish attempt failed here, forming a fake breakout and leading to a new bullish impulse. The price is now approaching the descending Resistance Line, which has repeatedly pushed gold lower during the recent correction. A clean breakout above this trendline may open the way for the price to move toward the major Resistance Level at 4,240.00, which also aligns with the first take-profit area (TP1). This Resistance Level has acted as a strong reaction zone multiple times, causing sharp pullbacks and marking the boundaries of the Seller Zone. Buyers will likely face significant opposition here once again. If gold respects the Buyer Zone and maintains trading above 4,110, the bullish scenario remains intact, and the price may push toward TP1 → 4,240. A confirmed breakout above this level would signal continuation toward higher targets within the broader bullish structure. However, if XAUUSD fails to hold the Buyer Zone and breaks below 4,110, the bullish outlook becomes invalid. In this case, the price may revisit the lower trendline or enter a deeper correction toward previous support areas. For now, the structure remains moderately bullish, with buyers dominating as long as the price stays above demand and respects the ascending Support Line. Please share this idea with your friends and click "Boost" 🚀

GOLD ANALYSIS 11/28/20251. Fundamental Analysis:
a) Economy:
• USD:
The USD is slightly weakening after the holiday period; low market liquidity means the decline is not strong. Investors are waiting for new signals from next week’s data. Gold may spike unexpectedly if Japan intervenes in the Yen, causing USD weakness.
• U.S. Stock Market:
U.S. equities were closed for Thanksgiving. The general trend remains slightly positive with mild risk-on flow, but not strong enough to push gold in the opposite direction.
• FED:
The Fed maintains a “cautious” stance with no new signals. The scenario still leans toward keeping interest rates unchanged, which provides mild support for gold. A change in the Fed Chair increases the probability of rate cuts, which is supportive for gold.
• TRUMP:
The Trump administration continues to move toward corporate tax cuts and promoting domestic production. This creates medium-term pressure on the USD → indirectly supporting gold.
• Gold ETF – SPDR:
SPDR made no buys or sells; holdings remain unchanged. This reflects a wait-and-see sentiment, with no major capital inflow into gold yet.
b) Geopolitics:
No significant developments in the last 24 hours. Global conflicts remain simmering but not strong enough to create a major boost for gold during the holiday session.
c) Market Sentiment:
• The market is still in a sideways state with mild risk-on sentiment.
• Capital has not fully flowed back into gold, so any upside moves mainly come from technical factors rather than fundamental news.
2. Technical Analysis:
The 15-minute chart shows:
• Price has broken out of the 4,155–4,170 accumulation zone with strong upward momentum.
• RSI is rising steeply and has entered extreme overbought → short-term uptrend is intact but a slight correction is expected.
• Price structure has just formed an accumulation pattern.
• Technical target based on range box and projection: 4,207.
• EMA 20–50 are sloping upward, confirming bullish momentum.
Note: Morning breakouts are often retested → watch for BUY entries at the breakout zone.
RESISTANCE: 4,193 – 4,207
SUPPORT: 4,136 – 4,096
3. Yesterday’s Market (27/11/25):
• GOLD traded almost sideways within 4,143 – 4,170 throughout the day due to low liquidity from Thanksgiving.
• SPDR stayed out; the market is waiting for U.S. data to return.
• The accumulation structure lasted 24 hours → this morning’s breakout followed the pattern precisely.
4. Strategy for Today (28/11/25):
🪙 SELL XAUUSD | 4235 – 4233
SL: 4239
TP1: 4227
TP2: 4221
🪙 BUY XAUUSD | 4162 – 4164
SL: 4158
TP1: 4170
TP2: 4176

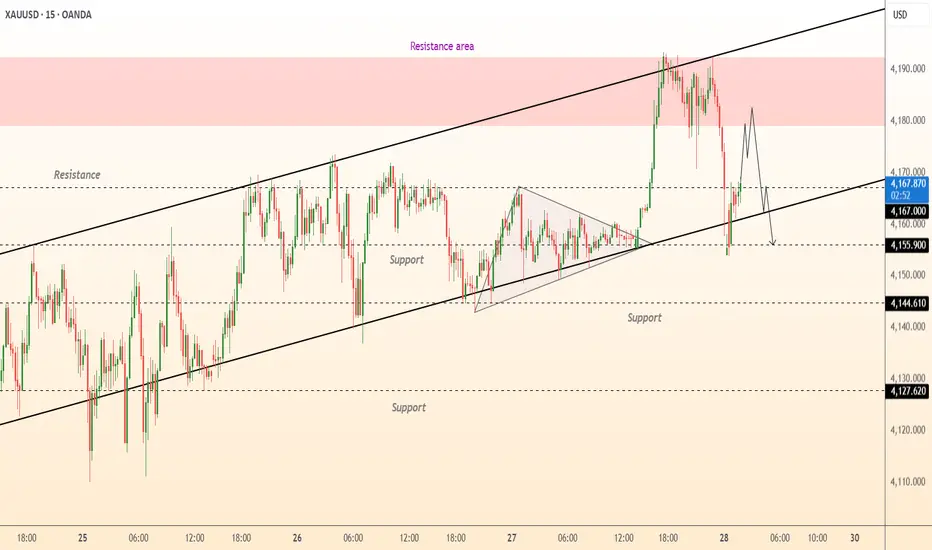
GOLD → Consolidation above 4150 amid a bullish market FX:XAUUSD breaks through 4170 and renews its high to 4193 during the Asian trading session. But further on, the market may consolidate before a possible continuation of growth...
The probability of a Fed rate cut in December remains at 82%. Geopolitical risks (Russia-Ukraine) continue to support demand for safe-haven assets. Weekly growth continues, but consolidation above $4170-4190 is required for the movement to continue.
However, low liquidity is expected on Thursday/Friday due to the holidays in the US. There may not be any strong movement, but volatility could be high during the European/American session...
Focus on the current trading range of 4150-4193...
Resistance levels: 4170, 4193, 4211
Support levels: 4150, 4145, 4139
The market is bullish both globally and locally. Accordingly, within the current trading range, gold may form a long squeeze relative to support and the liquidity zone at 4150. If the fundamental background does not change over the weekend, growth may continue next week...
Best regards, R. Linda!
XAU/USD Intraday Plan | Gold Stuck Between 4142–4167Yesterday we saw a break above the 4142 level, but gold failed to extend higher, resulting in a ranging move between 4142 and 4167. Buyers now need to clear the 4167 minor resistance to push toward 4198.
If price can’t hold and slips back below 4142, we could see a retest of the consolidation range. Continued selling pressure would then shift focus toward the Support Zone.
📌Key levels to watch:
Resistance:
4167
4198
4232
Support:
4142
4098
4052
4016
3968
🔎Fundamental focus:
Today is a U.S. bank holiday, which means trading volume is thinner than usual. Lower liquidity can lead to exaggerated intraday moves, sharper spikes, and occasionally wider spreads, so caution is advised.

GOLG SMC BUY IDEA 4160 DEMAND ZONE📌 SMC Buy-Side Idea (XAUUSD) — Entry 4160
Bias: Bullish
Timeframe: 15m
🔍 Market Structure
Market has broken previous structure with a clean BOS, confirming bullish order flow.
Price retraced back into the 15m Demand Zone (IDM).
4160 is sitting inside discount pricing, aligned with HL formation.
🟦 Entry Plan
Buy Limit: 4160 zone (inside 15m Demand)
Stop Loss: Below HL / Below the demand rejection
Take Profit: Three partial exits
🎯 Targets (3-Stage TP Distribution)
TP1: 4175
TP2: 4185
TP3 (Final): 4200
💡 Why Buy at 4160?
4160 = Perfect discount level
Confluence with 15m demand + IDM
Bullish BOS already printed
Liquidity above HH targeting 4200
📈 Expectation
If bulls defend 4160 demand, price should move toward 4175 → 4185 → 4200, sweeping all buy-side liquidity.

GOLD BEARS ARE STRONG HERE|SHORT
GOLD SIGNAL
Trade Direction: short
Entry Level: 4,173.52
Target Level: 3,864.42
Stop Loss: 4,378.26
RISK PROFILE
Risk level: medium
Suggested risk: 1%
Timeframe: 1D
Disclosure: I am part of Trade Nation's Influencer program and receive a monthly fee for using their TradingView charts in my analysis.
✅LIKE AND COMMENT MY IDEAS✅

MarketBreakdown | USDJPY, EURCHF, Dollar Index, Silver XAGUSD
Here are the updates & outlook for multiple instruments in my watch list.
1️⃣ #USDJPY 4H time frame 🇺🇸🇯🇵
USDJPY is trading in a strong uptrend on a daily.
After the market updated the last high, it started a correctional movement.
We see an intraday downtrend now.
I think that the pair found a bottom and is going to rise soon.
Look for a bullish breakout of 156.75 level as your signal.
It will confirm a violation of a bearish trend and a highly probable start of a new bullish wave.
2️⃣ #EURCHF daily time frame 🇪🇺🇨🇭
I see a confirmed bullish change of character and a violation
of a bearish trend.
I think that the market will continue recovering and will grow more soon.
3️⃣ Dollar Index #DXY daily time frame $
The market reached a strong rising trend line and formed
a doji candle on that.
Because the trend is bullish, I will expect a bullish wave.
4️⃣ Silver #XAGUSD daily time frame 🪙
The market is very close to a current all time high.
With the tendency to set higher lows after retracing from that
there is a high chance to see a breakout and a formation of a new higher high soon.
A daily candle close above the levels of the ATH will confirm the violation.
Do you agree with my market breakdown?
❤️Please, support my work with like, thank you!❤️
I am part of Trade Nation's Influencer program and receive a monthly fee for using their TradingView charts in my analysis.

Ethereum OUTCOME!ETH gained strength this week. Waiting to see if it will Break the TrendLine and Cross the Moving Average.

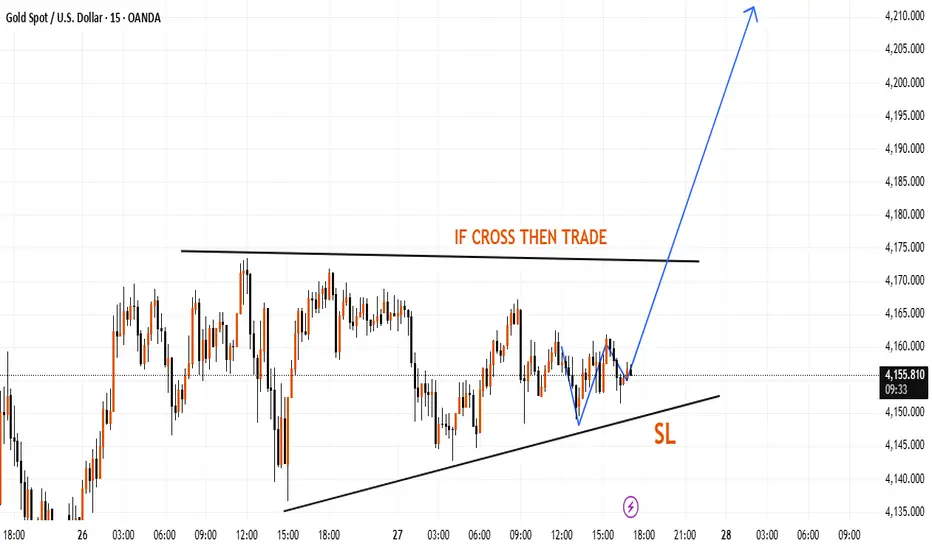
Gold Structure Watching a Possible Breakout ZonePrice is moving inside a rising support line while testing a horizontal barrier above.
If the upper boundary is cleared with strength, the chart may show extended upward momentum.
Current structure also highlights a rising base acting as a nearby risk-control area.
Gold 30-Min — Volume Sell Reversal Triggered⚡Base : Hanzo Trading Alpha Algorithm
The algorithm calculates volatility displacement vs liquidity recovery, identifying where probability meets imbalance.
It trades only where precision, volume, and manipulation intersect —only logic.
✈️ Technical Reasons
/ Direction — SHORT / Reversal 4191 Area
☄️Bearish rejection confirmed through sharp candle body.
☄️Lower-high forming beneath resistance supply region.
☄️Volume decreasing confirms exhaustion in price rally.
☄️Sellers regained imbalance with heavy top rejection.
☄️Algorithm detects fading demand and shift to control.
⚙️ Hanzo Alpha Trading Protocol
The Alpha Candle defines the day’s real control zone — the first battle of momentum.
From this origin, the Volume Window reveals where the next precision strike begins.
⚙️ Hanzo Volume Window / Map
Window tracked from 10:30 — mapping true market behavior.
POC alignment exposes institutional bias and breakout potential zones.
⚙️ Hanzo Delta Window / Pulse
Delta window monitors real buying vs. selling power behind each move.
Tracks volume aggression to expose who controls the candle — buyers or sellers.
When Delta aligns with Volume Map, momentum becomes undeniable.

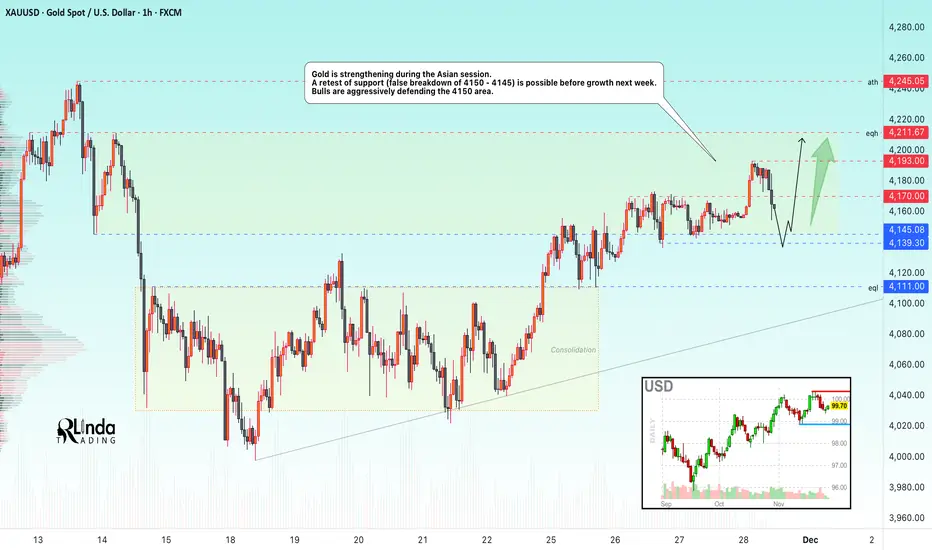
GOLD → Consolidation above the support level of the new rangeFX:XAUUSD is consolidating above 4150 but within the distribution phase after breaking through consolidation. The upward price movement is supported by the weakening of the dollar...
The metal remains on track for a fourth month of growth thanks to expectations of further Fed rate cuts and geopolitical tensions.
Despite strong US data, markets are still pricing in a 76-85% probability of a rate cut in December. The dollar is weakening, although yields are rising slightly.
Against the backdrop of the holiday week in the US, volatility may decrease and gold may consolidate. Talks about a possible peace between Russia and Ukraine could reduce demand for safe-haven assets, but the overall backdrop remains favorable for XAU/USD growth.
Resistance levels: 4170, 4211
Support levels: 4146, 4139
Gold is consolidating above the key support zone of 4140-4146. A long squeeze could trigger a shift in market imbalance in favor of buyers. If the bulls keep the price above 4150, this could trigger further growth, a breakout of 4170, and a retest of 4211.
Best regards, R. Linda!

SILVER Long IdeaWe have a unconfirmed ascending triangle formation at silver. After the daily close on the red lines , formation will be confirmed and we can target easly to the blue area as shown

GOLD (XAUUSD): Another BoS
A quick follow-up for the yesterday's post for Gold.
The price successfully bounced and broke another intraday resistance,
setting one more local higher high on a 4H.
The market will most likely continue rising following the plan
and reach 4205 soon.
❤️Please, support my work with like, thank you!❤️
I am part of Trade Nation's Influencer program and receive a monthly fee for using their TradingView charts in my analysis.

Gold broke through trendline resistance. Bullish.Due to Thanksgiving, overall price fluctuations were limited, mainly range-bound, oscillating within the 4140-70 range, although the daily chart closed higher. Currently, the downtrend line has been temporarily broken, and aggressive buying at higher levels is not recommended until it is firmly established above this level. Looking at the four-hour chart, the gold triangle consolidation pattern remains unchanged, with the downward trendline resistance around 4175. Only a decisive break above this trendline resistance can lead to further upward movement, presenting a new buying opportunity!
On the one-hour chart, the price is repeatedly testing the resistance zone, showing short-term spikes. After the one-hour candlestick firmly establishes itself above 4175, watch for short-term corrections, which could present buying opportunities. Today, continue to monitor the price reaction at the upper trendline of the triangle at 4175, which is also the key level for today's bullish/bearish trend. If it holds above this level, further gains to 4200-4220 are possible.
Key Levels:
First Support: 4152, Second Support: 4140, Third Support: 4122
First Resistance: 4190, Second Resistance: 4208, Third Resistance: 4222
Gold Trading Strategy:
BUY: 4145-4150, SL: 4130, TP: 4170-4180;
SELL: 4200-4205, SL: 4220, TP: 4180-4170;
More Analysis →

Stop!Loss|Market View: NZDUSD🙌 Stop!Loss team welcomes you❗️
In this post, we're going to talk about the near-term outlook for the NZDUSD currency pair☝️
Potential trade setup:
🔔Entry level: 0.57355
💰TP: 0.57796
⛔️SL: 0.57134
"Market View" - a brief analysis of trading instruments, covering the most important aspects of the FOREX market.
👇 In the comments 👇 you can type the trading instrument you'd like to analyze, and we'll talk about it in our next posts.
💬 Description: By the end of the week, the US dollar remains under pressure for the short term, so a rise to 0.58000 is also expected for NZDUSD. A potential buy trade could be initiated by breaking the upper limit of the current accumulation in the triangle pattern that has formed at 0.57300.
Thanks for your support 🚀
Profits for all ✅

XAUUSD – Ascending channel in play, eyes on the 4,240 regionXAUUSD – Ascending channel in play, eyes on the 4,240 region
Brian – Buying the dip within structure, watching for a fade at higher resistance
Market overview & structure
On the H4 chart, gold is trading neatly inside a well-defined ascending channel, printing higher highs and higher lows. The current leg is pushing up towards the 4,237–4,240 area, which lines up with:
The upper boundary of the channel
A key resistance zone
The 1.618 Fibonacci extension and resting liquidity above recent highs
So for now, the broader bias remains bullish, but as price creeps closer to 4,240, the risk of profit-taking and short-term selling naturally increases.
Wave & technical context
This move is an extension of the previous bullish structure after price broke out of the old descending channel and started to build a new bullish one.
Liquidity levels around 4,193 and above suggest the market has been building positions and still has room to drive price into the higher resistance band.
The buy zone around 4,154–4,157, near the lower edge of the channel, is where buyers are likely to step back in to defend the trend.
As long as price holds above 4,150–4,154, the continuation scenario towards 4,240 remains the higher-probability path.
Key zones & trading plan
Primary scenario – Buy with the trend
Buy zone: 4,154–4,157 (channel support + marked buy zone).
Idea: Wait for a pullback towards the lower boundary of the channel, or a brief liquidity sweep into this region, then look for a clear rejection candle on H1/H4 before going long.
Targets:
Short term: 4,190–4,200 (mid-channel / interim liquidity).
Extended: 4,237–4,240 (major resistance + 1.618 Fib extension).
This is a trend-following “buy the dip” setup, more suited to swing and short-term position traders rather than scalpers.
Secondary scenario – Short-term fade from 4,237–4,240
Sell zone: 4,237–4,240 – confluence of strong resistance and the 1.618 Fibonacci extension.
Idea: If price tags this zone and shows clear rejection (long upper wicks, bearish reversal pattern on H1/M15), it may offer a counter-trend short back towards the middle of the channel or the 4,190–4,200 support area.
As this is a counter-trend play:
Keep position size smaller than the main long idea.
Use a tight stop above 4,240 and avoid widening it out of emotion.
Macro and liquidity backdrop
Liquidity is likely to thin out towards the end of the session with the US Thanksgiving period in play, which can lead to the odd sharp spike or stop-hunt, especially around obvious liquidity pools.
On the political front, headlines such as Mr Trump’s comments about “permanently suspending immigration from third-world countries” add to broader policy uncertainty, but the impact on gold is indirect via risk sentiment rather than a direct driver.
It’s also worth noting that silver has been rallying strongly, supported by solar-related demand and supply concerns – a bit of a “silent workhorse” at the moment. That doesn’t remove gold’s role, but it does show that precious metals as a whole are attracting capital.
Strategy & risk management
For now, my focus is on buying dips around 4,154–4,157 in line with the ascending channel, and only looking for tactical shorts if price clearly rejects the 4,237–4,240 band.
I prefer not to open fresh trades when US liquidity is extremely thin or straight into major holiday sessions, as spreads can widen and price can behave erratically.
If we see a decisive close below the buy zone and a clean break of the channel structure, this bullish plan is invalidated – at that point it’s better to step aside and reassess rather than forcing trades.
What do you reckon – does this structure still favour the bulls, or are you leaning towards a deeper correction from the 4,240 region? Feel free to share your view in the comments.
