GOLD 1H CHART ROUTE MAP UPDATE & TRADING PLAN FOR THE WEEKHey Everyone,
Please see our updated 1h chart levels and targets for the coming week.
We are seeing price play between two weighted levels with a gap above at 4114 and a gap below at 4057. We will need to see ema5 cross and lock on either weighted level to determine the next range.
We will see levels tested side by side until one of the weighted levels break and lock to confirm direction for the next range.
We will keep the above in mind when taking buys from dips. Our updated levels and weighted levels will allow us to track the movement down and then catch bounces up.
We will continue to buy dips using our support levels taking 20 to 40 pips. As stated before each of our level structures give 20 to 40 pip bounces, which is enough for a nice entry and exit. If you back test the levels we shared every week for the past 24 months, you can see how effectively they were used to trade with or against short/mid term swings and trends.
The swing range give bigger bounces then our weighted levels that's the difference between weighted levels and swing ranges.
BULLISH TARGET
4114
EMA5 CROSS AND LOCK ABOVE 4114 WILL OPEN THE FOLLOWING BULLISH TARGETS
4175
EMA5 CROSS AND LOCK ABOVE 4175 WILL OPEN THE FOLLOWING BULLISH TARGET
4232
EMA5 CROSS AND LOCK ABOVE 4232 WILL OPEN THE FOLLOWING BULLISH TARGET
4289
EMA5 CROSS AND LOCK ABOVE 4289 WILL OPEN THE FOLLOWING BULLISH TARGET
4361
BEARISH TARGETS
4057
EMA5 CROSS AND LOCK BELOW 4057 WILL OPEN THE FOLLOWING BEARISH TARGET
4006
EMA5 CROSS AND LOCK BELOW 4006 WILL OPEN THE FOLLOWING BEARISH TARGET
3965
EMA5 CROSS AND LOCK BELOW 3965 WILL OPEN THE SWING RANGE
3923
3861
As always, we will keep you all updated with regular updates throughout the week and how we manage the active ideas and setups. Thank you all for your likes, comments and follows, we really appreciate it!
Mr Gold
GoldViewFX
Metals

Silver is close to it's next decisionIn the short-term, Silver is still digesting the next decision.
On the shorter term charts, a couple of H&S patterns have emerged. There is a chance of slight weakness for the remainder of 2025, but I'm not convinced until it falls below $46.
Right now $49 is still solid support.. so it could trend sideways before resuming it's bull run.
The thick yellow line around $39 below is a monthly/weekly gap from Sept... just something to keep an eye on until this enters all-time high territory. If this trends below $45, then the double top measured move could play out down to the gap area.

Gold NY Session Strategy 11/19: Will up to 4162 Gold Daily Plan – SMC Outlook (Nov 20)
Framework: CHoCH – BOS – FVG – POI – Premium/Discount Model
1. Market Context
Gold continues to recover after the sharp drop earlier this week. Price is now approaching the Premium zone of the current bullish swing and tapping into H1 supply. The market shows:
Buyers still in short-term control
Momentum weakening as price reaches resistance
A corrective pullback into Discount is likely before any further expansion
2. Structural Overview (SMC Logic)
🔻 Overall Market Structure
A key BOS formed around 4090–4100 → confirms short-term bullish structure
Follow-up CHoCH signals continuation of the intraday uptrend
Price is moving toward the upper FVG + Supply Zone (4160–4162)
🔸 Orderflow Notes
Strong reaction at the 4140 area → clear presence of passive Sell Limit absorption
Demand POI at 4091–4089 held exceptionally well → main bullish mitigation zone
3. Trading Zones (POI)
✅ BUY Zone (Discount Area)
4091 – 4089
Demand + previous CHoCH + fib 1.272 confluence
Ideal low-risk long setup within Discount
Suggested SL: 4087
BUY Scenario:
Price retraces to POI → shows bullish reaction → long toward Premium.
❗️ SELL Zones (Premium Area)
Aggressive Sell Zone:
4143 – 4145
SL: 4147
Optimal Sell Zone:
4160 – 4162
Major supply + imbalance + fib 2.618 extension
Highest probability for reversal
SL: 4165
4. Trade Scenarios
📌 Primary Scenario (High Probability)
Price retraces into 4091–4089 Demand
Look for CHoCH/BOS confirmation on lower timeframe
Enter BUY → target 4143 → 4160
→ Classic SMC model: Buy from Discount → Sell from Premium.
📌 Alternative Scenario
If price rallies straight into 4143–4162 without retracement:
ONLY enter SELL when a clear bearish CHoCH or strong rejection forms
Target: 4100 → 4090
5. Intraday Bias
→ Bullish in Discount zones – Bearish in Premium zones.
Trade based on orderflow → Do not chase price in the middle range.
6. Summary
BUY: 4091–4089 (SL 4087) → TP: 4140 – 4160
SELL:
• 4143–4145 (SL 4147)
• 4160–4162 (SL 4165)
Wait for confirmation at each POI; avoid mid-range entries.

GOLD The Target Is UP! BUY!
My dear friends,
My technical analysis for GOLD is below:
The market is trading on 4038.3 pivot level.
Bias - Bullish
Technical Indicators: Both Super Trend & Pivot HL indicate a highly probable Bullish continuation.
Target - 4059.3
Recommended Stop Loss - 4026.8
About Used Indicators:
A pivot point is a technical analysis indicator, or calculations, used to determine the overall trend of the market over different time frames.
Disclosure: I am part of Trade Nation's Influencer program and receive a monthly fee for using their TradingView charts in my analysis.
———————————
WISH YOU ALL LUCK

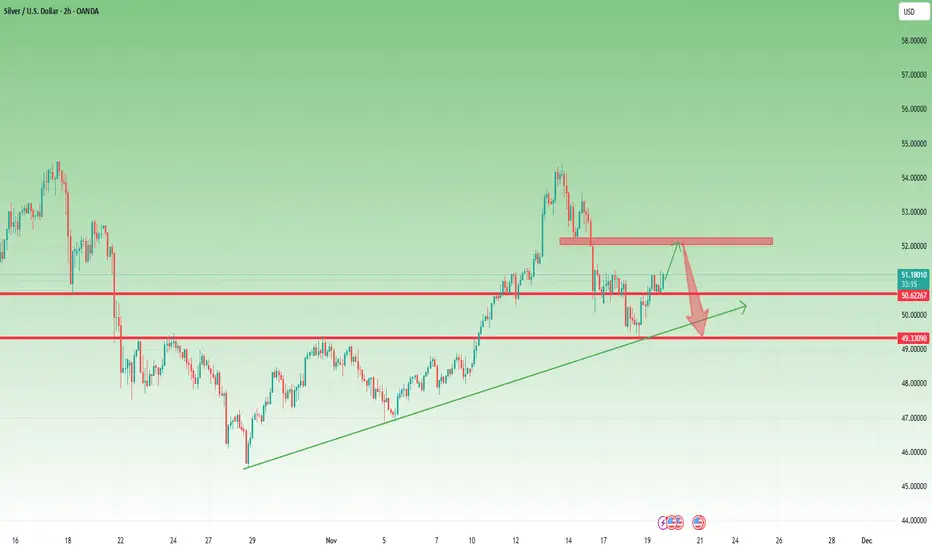
New Leg Up Possible, Yet I Expect Another Decline Toward 491. What Happened Since Yesterday
In yesterday’s analysis, I highlighted the possibility of a rebound from the confluence support and mentioned that Silver could rise toward the 50.50 resistance.
Not only did Silver reach that target — it broke above it, and the price is now trading above 51.00.
The bullish momentum was stronger than expected, confirming buyers stepped in aggressively from support.
2. Current Market Context
With price holding above 51, the short-term chart structure is slightly bullish, and a new leg up is possible in the immediate term.
However, despite this strength, I believe the overall correction is not yet complete. Silver has a habit of producing sharp counter-trend moves before continuing the broader direction.
3. Technical Outlook
Key levels to monitor:
Resistance:
- 52.00 – major short-term barrier; ideal area to search for shorts
- 50.50 – intraday resistance turned support
Support / Downside target:
- 49.00 – the next major support and my preferred downside target
Until Silver breaks and holds above 52, upside continuation remains limited in my view.
4. Trading Plan
My plan is straightforward:
If price reaches the 52 zone, I will look for short entries.
Downside target is 49.
I will reassess the bias only if Silver starts to stabilize well above 52, which would shift the structure back to bullish.
5. Conclusion
Silver exceeded expectations on the rebound, but the larger corrective structure appears intact.
Short-term upside is possible, yet I still expect another leg down, with 49 as the main target.
GOLD: Long Trade with Entry/SL/TP
GOLD
- Classic bullish setup
- Our team expects bullish continuation
SUGGESTED TRADE:
Swing Trade
Long GOLD
Entry Point - 4089.3
Stop Loss - 4079.3
Take Profit - 4109.5
Our Risk - 1%
Start protection of your profits from lower levels
Disclosure: I am part of Trade Nation's Influencer program and receive a monthly fee for using their TradingView charts in my analysis.
❤️ Please, support our work with like & comment! ❤️

SILVER (XAGUSD): Bullish Continuation After Pullback
There is a high chance that Silver will go up from the underlined support.
A bullish breakout if a neckline of an inverted head & shoulders pattern
provides a strong confirmation.
Expect a rise to 53.2 level.
❤️Please, support my work with like, thank you!❤️
I am part of Trade Nation's Influencer program and receive a monthly fee for using their TradingView charts in my analysis.

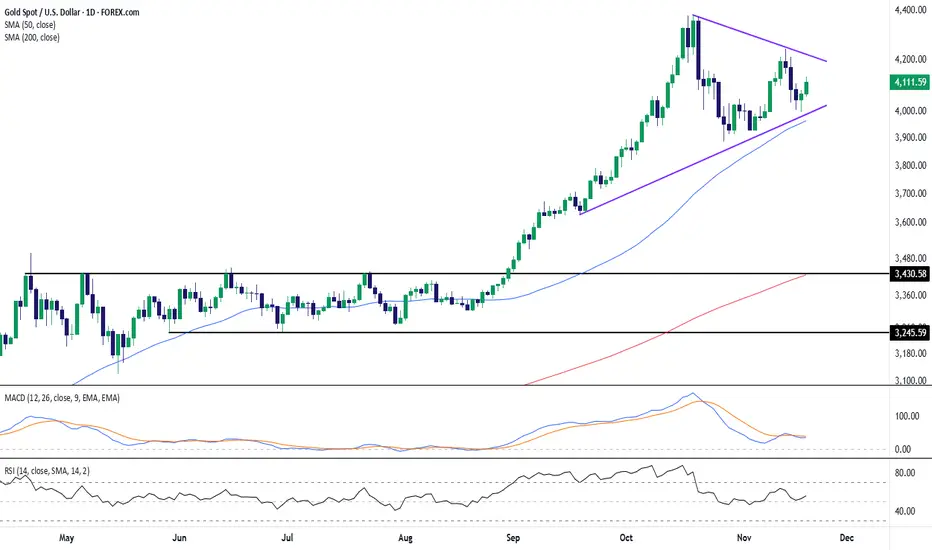
Gold Consolidates Within Symmetrical Triangle as Bulls Defend 4KGold (XAU/USD) continues to trade within a well-defined consolidation pattern following its strong rally earlier in the quarter. The metal is currently forming a symmetrical triangle, bounded by rising support near 4,000 and descending resistance around 4,250. This setup reflects a period of equilibrium between buyers and sellers as momentum stabilizes after recent highs.
The 50-day simple moving average (SMA) near 3,965 remains an important dynamic support, while the 200-day SMA far below at 3,427 indicates the broader uptrend remains intact. Price recently rebounded from the triangle’s lower boundary and the 50-day SMA, suggesting that short-term buyers are still active within the structure.
Momentum readings are neutral to mildly constructive. The MACD lines are flattening after a bearish crossover, signaling reduced downside momentum, while the RSI hovers near 56, consistent with balanced but improving sentiment.
As long as gold remains above the 4,000 region, focus stays on a potential breakout from this converging pattern — with direction likely dictated by whether bulls can overcome the upper trendline resistance or if sellers regain control near that zone.
-MW
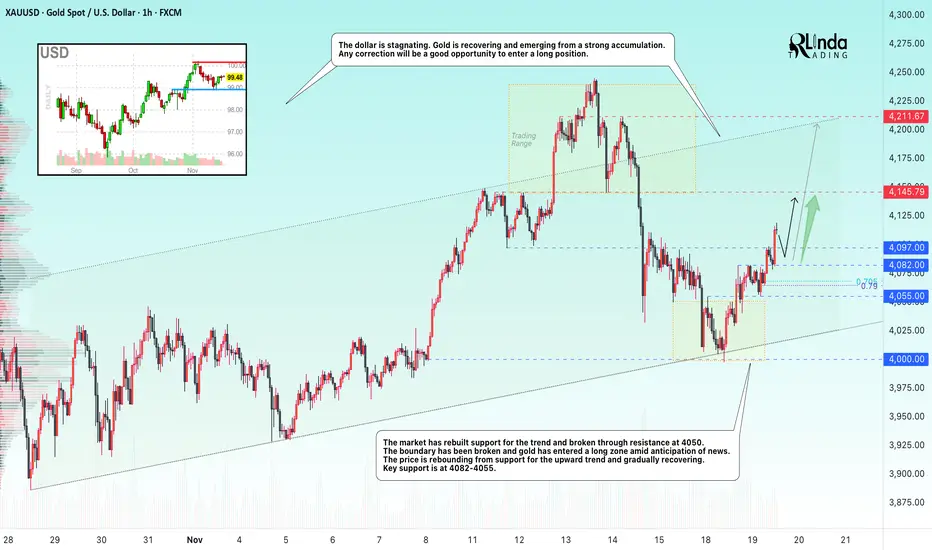
GOLD → Market support, exit from consolidationFX:XAUUSD is feeling market support ahead of the news. The price is rebounding from trend support, breaking through strong resistance and enjoying high interest from bulls...
The rise in demand for defensive assets is driven by concerns about the overvaluation of technology stocks and weak US labor market data. The number of applications for unemployment benefits rose significantly in October. Private employers cut jobs for four weeks. The Fed minutes may show disagreement over the regulator's future policy, and the probability of a rate cut in December is estimated at 50/50. The market's attention is focused on September NFP data (forecast: +50K).
Gold is awaiting signals from the Fed and employment data. The Fed's cautious stance and weak NFP data could support further price growth.
Resistance levels: 4145 - 4211
Support levels: 4097, 4082, 4055
Gold is entering a long zone. Any correction could be a good opportunity to enter the market. Pay attention to key support levels for trend trading...
Best regards, R. Linda!
USDJPY - HUGE BULLISH TO $202 INCOMING!USDJPY is preparing for a huge bullish run in the coming years UPWARDS of $200! This is an amazing investment opportunity for long term traders & investors.
Prepare for this move, as opportunities like this bull run barely come along!
Confluences👇
⭕️Wave 2 Complete (5 Sub-Wave Complex Correction).
⭕️Dollar Index Bullish.
⭕️Bullish Distribution Formed.

XAGUSD H1 | Bearish Reaction off Key ResistanceMomentum: Bearish
Price is currently below the ichimoku cloud.
Sell entry: 51.30
- Strong overlap resistance
- 38.2% Fib retracement
Stop Loss: 52.077
- Pullback resistance
- 50% Fib retracement
Take Profit: 50.097
- Strong overlap support
High Risk Investment Warning
Stratos Markets Limited (tradu.com/uk ), Stratos Europe Ltd (tradu.com/eu ):
CFDs are complex instruments and come with a high risk of losing money rapidly due to leverage. 70% of retail investor accounts lose money when trading CFDs with this provider. You should consider whether you understand how CFDs work and whether you can afford to take the high risk of losing your money.
Stratos Global LLC (tradu.com/en ): Losses can exceed deposits.
Please be advised that the information presented on TradingView is provided to Tradu (‘Company’, ‘we’) by a third-party provider (‘TFA Global Pte Ltd’). Please be reminded that you are solely responsible for the trading decisions on your account. Any information and/or content is intended entirely for research, educational and informational purposes only and does not constitute investment or consultation advice or investment strategy. The information is not tailored to the investment needs of any specific person and therefore does not involve a consideration of any of the investment objectives, financial situation or needs of any viewer that may receive it. Past performance is not a reliable indicator of future results. Actual results may differ materially from those anticipated in forward-looking or past performance statements. We assume no liability as to the accuracy or completeness of any of the information and/or content provided herein and the Company cannot be held responsible for any omission, mistake nor for any loss or damage including without limitation to any loss of profit which may arise from reliance on any information supplied by TFA Global Pte Ltd.

Gold (XAUUSD): Buy setupGold (XAUUSD): Buy setup. Although it has started its move but I think there is still opportunity for us to enter.
Cheers

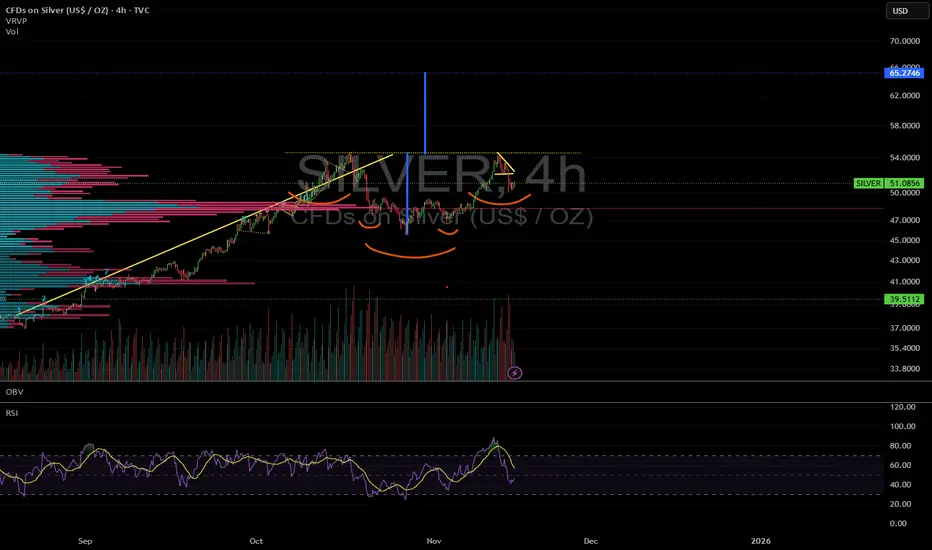
SILVER TO 65 $ ?Silver is undergoing a consolidation in the 47 to 54 $ range recently.
There is an inverse Head and Shoulders pattern forming right now.
The implied price objective of 65 $
At a time where many (even smart) invesors are waiting for a dip down to 40 (and even 30) $ could that be the surprise that hot assets offer in a raging bull market ?
The pattern is there ! Will it play out ?
I am positioned.
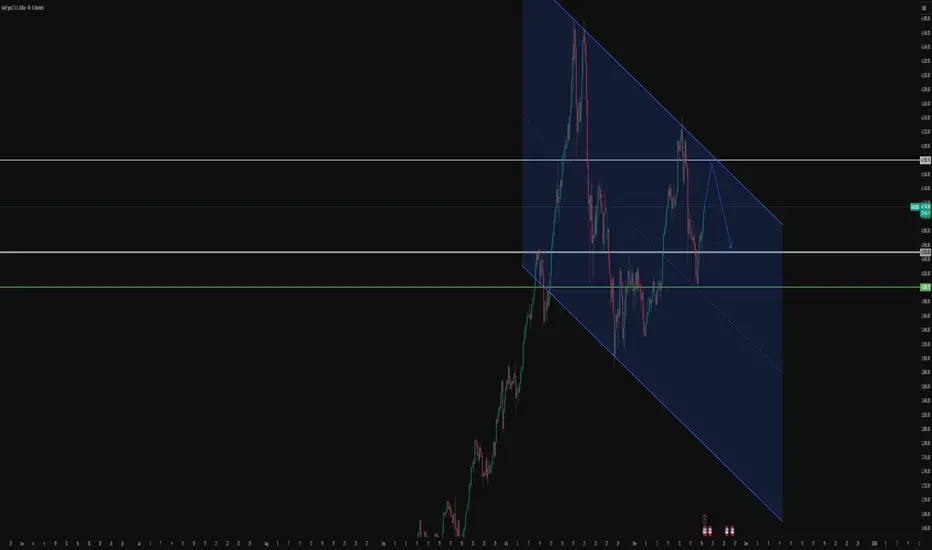
GOLD is expected to rise in a parallel channelGOLD has a bullish momentum as of now, reaching new LH then expected to decline according to my analysis.
Gold Roadmap => Short-termGold ( OANDA:XAUUSD ) is currently moving below the Support zone($4,053 – $4,025) , but given the cluster of supports ahead , we can consider this beak is a fake break .
From an Elliott Wave perspective, it seems that gold has completed its wave 5 near the support lines , and we can anticipate a corrective upward movement .
Also, we can observe positive Regular Divergence (RD+) in consecutive valleys.
I expect Gold to rise to the Resistance zone($4,125 – $4,097) in the next step after breaking the Resistance lines and confronting the $4,073 level .
First Target: $4,091
Second Target: $4,113
Stop Loss(SL): $3,987
Please respect each other's ideas and express them politely if you agree or disagree.
Gold Analyze (XAUUSD), 1-hour time frame.
Be sure to follow the updated ideas.
Do not forget to put a Stop loss for your positions (For every position you want to open).
Please follow your strategy; this is just my idea, and I will gladly see your ideas in this post.
Please do not forget the ✅ ' like ' ✅ button 🙏😊 & Share it with your friends; thanks, and Trade safe.

XAUUSD: Market Analysis and Strategy for November 19thGold Technical Analysis:
Daily Resistance: 4150, Support: 4000
4-Hour Resistance: 4150, Support: 4082
1-Hour Resistance: 4120, Support: 4098
Technically, the weekly candlestick chart shows a rebound, indicating confirmed support. Yesterday's daily chart closed with a hammer pattern after the rise, strengthening confidence in the technical rebound. Intraday, the effectiveness of the Bollinger Middle Band support needs to be monitored. The 4000 level has stabilized in the short term. News and data in the next few trading days will remain a key focus for the market. Now that 4100 has been broken, short-term traders can follow the trend. If the NY market experiences a slight pullback, it's also a good opportunity to buy, targeting the 4220/4250 area. We need to focus on the probability of a December rate cut; if it returns to above 60%, gold could accelerate its upward movement.
Looking at the 1-hour chart, gold rebounded strongly in the European session, with the price action within an upward channel. Having broken through 4100, the short-term trend suggests further continuation. Watch for support levels from the MACD/KDJ indicators. For the European and American sessions, consider buying on a pullback to around 4095/4082.
Trading Strategy:
BUY: 4095~4082
SELL: 4150~4158
More Analysis →

Gold: A counterattack from the bullsGold rebounded yesterday after testing lower levels, initially falling before rising. The weekly chart shows a pullback to near 3998, finding some support. The RSI indicator remains near the midline, and the price is trading around the middle Bollinger Band. On the shorter-term 4-hour chart, moving averages are converging, the RSI is near the midline, and the price is trading between the middle and lower Bollinger Bands. Technically, gold is maintaining a wide-range trading structure. The trading strategy remains to buy low and sell high, with the intraday range to watch being 4040-4110.
Gold opened slightly higher today. The daily chart is forming a contracting triangle pattern, suggesting further upside potential. However, don't forget the release of the Fed meeting minutes during the New York session today; this news could be positive for gold, and upward momentum might be released before the news. Support below 4000 is very strong, and market sentiment has shifted from bearish to bullish. There is a high probability that the rebound will continue today; the trading strategy is to buy on dips, focusing on buying at support levels.
Key Levels:
First Support: 4062, Second Support: 4043, Third Support: 4025
First Resistance: 4090, Second Resistance: 4108, Third Resistance: 4126
Gold Intraday Trading Strategy:
Buy: 4045-4050, SL: 4035, TP: 4070-4080;
Sell: 4115-4120, SL: 4130, TP: 4100-4090;
More Analysis →

XAU/USD – Price Attempts Bullish Structure RecoveryXAU/USD – Price Attempts Bullish Structure Recovery, Key Resistance Ahead
Gold is showing early signs of regaining bullish momentum on the H1 chart after completing a corrective phase. The latest swing low has formed a clean higher low, and price is currently moving within an ascending trendline structure. However, buyers must overcome a stacked resistance zone to confirm a stronger upward leg.
Technical Structure Overview
After the sharp decline from the 4195 – 4220 zone, gold has gradually stabilized and formed a rising structure supported by a short-term trendline. Price is oscillating above the EMA20 and EMA50 on H1, indicating improving bullish sentiment.
RSI is recovering from the mid-range, suggesting momentum is picking up but not yet overbought — a favorable condition for a potential continuation move.
Important Fibonacci & Price Levels
Using the most recent swing high to swing low:
Fibonacci 38.2%: aligns near 4145
Fibonacci 50%: around 4160
Fibonacci 61.8%: at 4176
These Fibonacci clusters overlap with previous consolidation, creating a strong resistance block that the market must break for trend continuation.
Key Support Zones
Support 1: 4095 – 4105 (trendline + structure base)
Support 2: 4068 – 4080 (H1 demand, deeper retest zone)
As long as price stays above 4095, the bullish recovery scenario remains valid.
Key Resistance Zones
Resistance 1: 4145 – 4160 (Fibonacci 38.2% + 50%)
Resistance 2: 4176 – 4190 (Fibonacci 61.8% + liquidity cluster)
This upper block represents the most critical zone of the day, where gold previously reversed sharply.
Trading Scenarios for Today
1. Bullish Continuation Scenario (Primary Bias)
If price retests the 4095 – 4105 support and respects the ascending trendline, buyers may step back in and push gold toward:
First target: 4145 – 4160
Second target: 4176 – 4190
A breakout and H1 close above 4190 would open space for a stronger upside extension.
2. Bearish Rejection Scenario
If gold fails to hold the 4095 support, the bullish structure breaks, and price may revisit:
4068 – 4080
Deeper downside toward 4045 if momentum increases
Strategy Insight
Current price action favors a pullback–buy approach as long as the short-term trendline remains intact. The market is still forming higher lows, showing that buyers are defending structure. Traders should observe how price behaves around the 4095 – 4105 zone to confirm continuation strength.
If you find this analysis helpful, you can save it for later review and follow to receive more high-quality market updates.

Defensive money returns to GOLD as US labor data worsensOANDA:XAUUSD prices maintained a slight decline in the Asian session, trading around $4,075/ounce as the market turned its attention to the Fed meeting minutes. The upside momentum is weakening, but downside pressure remains limited as money flows continue to seek support from the prospect of easing policy.
New data from ADP reinforces the view that the US labor market is losing momentum. The private sector lost an average of 2,500 jobs a week in the four weeks to November 1, as a host of large companies from Amazon to Target announced plans to cut staff. A report from Challenger showed the number of planned layoffs in October was the highest in more than two decades. Jobless claims rose to 1.9 million, and data from the Cleveland Fed showed 39,000 layoff announcements last month.
These signals are emerging just as the market remains concerned about a weakening U.S. economy, even though expectations for rate cuts are not yet firmly established. Still, sentiment has shifted: the FedWatch tool now shows nearly a 50% probability of a rate cut at the Fed’s December meeting, up from below 40% earlier this week. This development has helped gold rebound after three consecutive losing sessions, especially since the precious metal typically benefits in a low-rate environment.
However, gold’s recovery remains relatively fragile. Prices fell more than 3% on Friday and dropped another 1% on Monday as expectations for Fed easing were revised. This has made the market more sensitive to signals from monetary policy and economic data.
The short-term focus is on the minutes of the late-October FOMC meeting and the upcoming nonfarm payrolls report, both to be released this week. Forecasts suggest U.S. job growth may slow to around 55,000 in September—a pace reflecting cooling hiring demand.
Several Fed officials have struck a more dovish tone. Governor Waller described the labor market as “weak” and noted that core inflation is moving closer to the 2% target. Richmond Fed President Thomas Barkin expects upcoming data to offer more clues on the direction of the economy. These comments, combined with the market’s interpretation of soft labor signals, are creating an environment in which each new data point has the potential to significantly impact gold pricing.
In my view, gold is likely to continue trading within a narrow range as the market awaits clearer confirmation from the Fed while simultaneously assessing the risks of a slowing U.S. economy. Rate-cut expectations remain the key factor supporting gold in the current phase.
Technical analysis and suggestions OANDA:XAUUSD
Recovery Trend and Conditions for a New Uptrend
This morning's developments show that gold prices are trying to recover after a long correction, with a bounce back to the $4,070/ounce area, corresponding to the lower border of the medium-term Ascending Channel.
The price structure has remained within the uptrend channel since August, but the momentum has weakened significantly after the price failed twice before the strong resistance zone of $4,216/ounce (Fib 0.236). The $3,972–$3,990/ounce (Fib 0.382) level continues to act as an important buffer zone, and the fact that the price did not break this zone in the recent decline is a positive signal.
RSI hit the oversold zone and is bouncing up, indicating that selling pressure is weakening and the market is entering a rebalancing phase.
For a new uptrend to form, it is necessary:
Necessary condition: price holds above 3,972 USD/ounce, remaining above the rising trend line of the price channel.
Sufficient condition: close above 4,128 USD/ounce and then confirm above 4,216 USD/ounce, the key resistance zone that determines the return to a strong uptrend.
Only when these two conditions are met, the medium-term uptrend structure will be fully restored.
SELL XAUUSD PRICE 4116 - 4114⚡️
↠↠ Stop Loss 4120
→Take Profit 1 4108
↨
→Take Profit 2 4102
BUY XAUUSD PRICE 4025 - 4027⚡️
↠↠ Stop Loss 4021
→Take Profit 1 4033
↨
→Take Profit 2 4039

Gold: Fakeout Completed, Pennant Target is on goingHi guys!
Gold just completed a textbook sequence of bearish structures. After the strong drop that formed the flagpole, price consolidated inside a pennant pattern. This type of setup typically continues in the direction of the prior move, and the measured target sits around $3,946, which aligns with your highlighted zone.
Before breaking lower, price formed an inverse head and shoulders, the reaction to the target of this pattern happened and we saw a clear fakeout right above the trendline.
As long as Gold stays below this broken trendline, the expectation is for a retest/rejection, followed by continuation toward the pennant’s full target.
The overall structure still favors the downside unless the market reclaims the fakeout region convincingly.
Disclaimer: As part of ThinkMarkets’ Influencer Program, I am sponsored to share and publish their charts in my analysis.

XAU/USD Intraday Plan — Critical Resistance AheadGold has shown a strong recovery from the Support Zone, reclaiming the 50MA and breaking above the 4078 resistance, which has now flipped into support. Price is currently trading around 4095, but the 200MA is acting as immediate resistance.
For buyers to continue higher, we need a clean break above 4115, the next key resistance. A confirmed break above this level would open the path toward 4170 and 4232.
If price fails to clear 4115, we could see a rejection back toward the 4078–4053 immediate support area. A break below that zone would expose a deeper pullback into the Support Zone again.
📌 Key Levels to Watch
Resistance:
4115
4170
4232
Support:
4078
4053
4027
3996
🔎Fundamental Focus:
The key event today is the FOMC Meeting Minutes, which could spark volatility depending on whether the tone appears more hawkish or dovish. Traders will be watching closely for clues on upcoming policy direction.

GOLD gaining strength. GOLD is starting to move UP going into the London session. Waiting to reach all time highs before the end of the year.

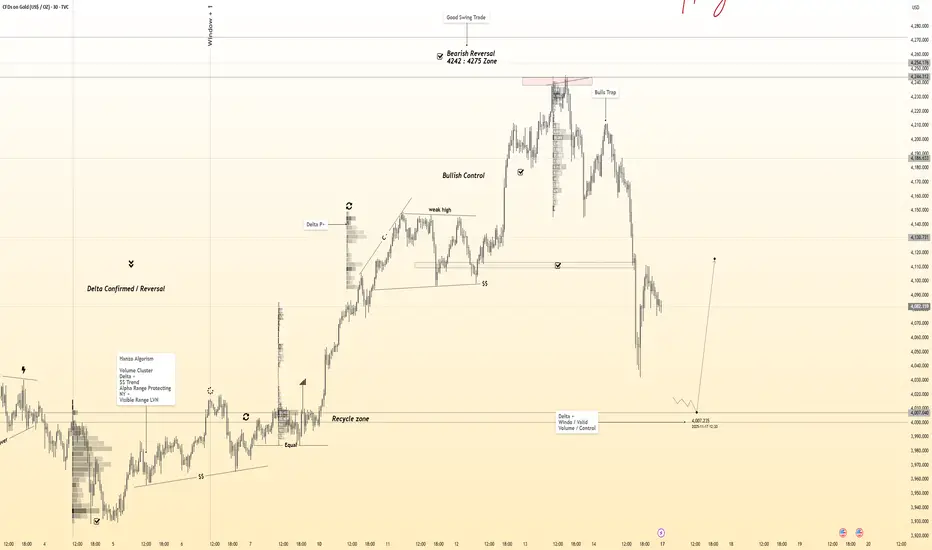
Gold 30-Min — Volume Buy Reversal Triggered⚡Base : Hanzo Trading Alpha Algorithm
The algorithm calculates volatility displacement vs liquidity recovery, identifying where probability meets imbalance.
It trades only where precision, volume, and manipulation intersect —only logic.
✈️ Technical Reasons
/ Direction — LONG / Reversal 4005 Area
☄️Bullish momentum confirmed through strong candle body.
☄️Structure shifted with higher-low near key demand base.
☄️Volume expanding confirms order-flow alignment upward.
☄️Buyers reclaimed imbalance with sustained clean break.
☄️Algorithm detects rising momentum under low liquidity.
⚙️ Hanzo Alpha Trading Protocol
The Alpha Candle defines the day’s real control zone — the first battle of momentum.
From this origin, the Volume Window reveals where the next precision strike begins.
⚙️ Hanzo Volume Window / Map
Window tracked from 10:30 — mapping true market behavior.
POC alignment exposes institutional bias and breakout potential zones.
⚙️ Hanzo Delta Window / Pulse
Delta window monitors real buying vs. selling power behind each move.
Tracks volume aggression to expose who controls the candle — buyers or sellers.
When Delta aligns with Volume Map, momentum becomes undeniable.