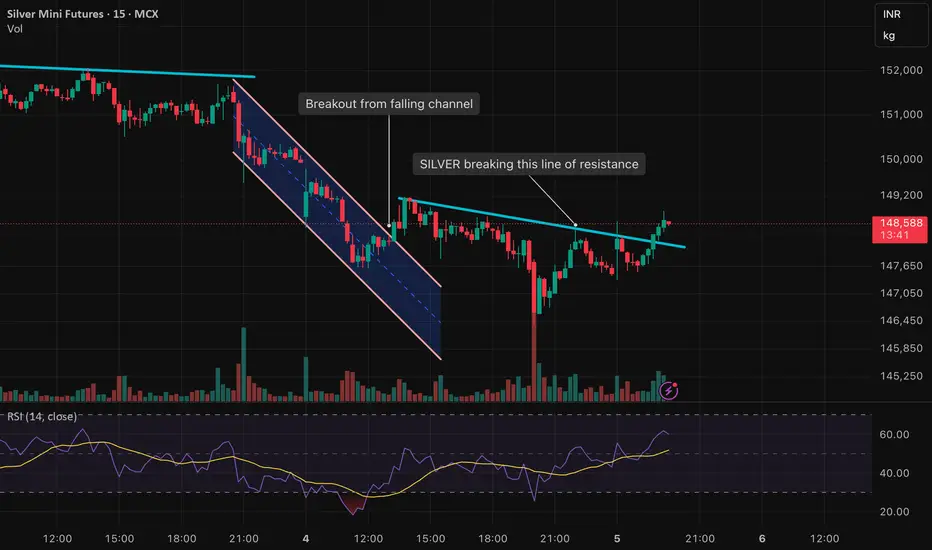
SILVER breaks above Line of ResistanceSILVER price breaks the marked line of resistance. Earlier the chart was respecting this line however this time it broke after US Employment data which is supportive for gold and silvre prices
Metals
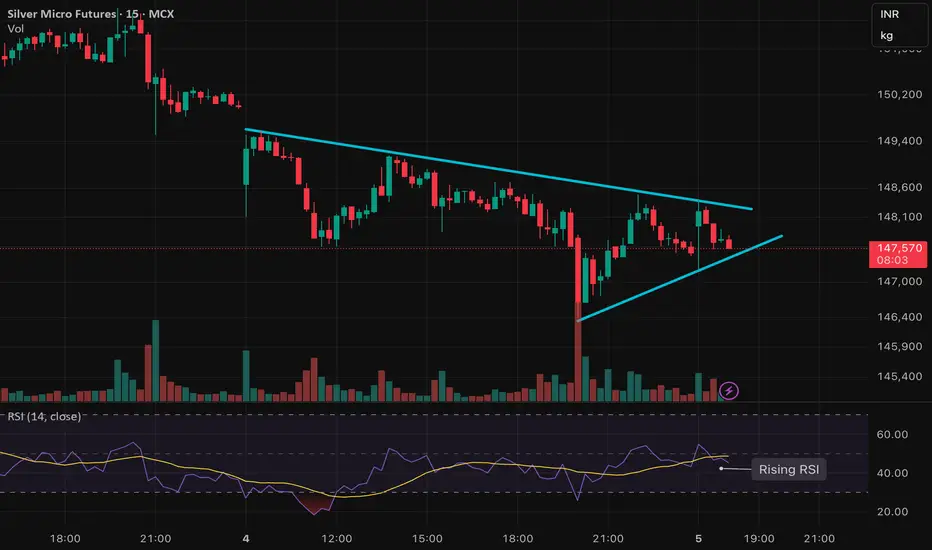
SILVER forming a wedge pattern ready for either side brakoutPrice action on Silver is getting tighter and is now trading inside a wedge formation, which usually leads to a strong move once price breaks out — either up or down. No bias yet, just preparing for momentum on whichever side gives confirmation.
📌 What I’m watching:
• Trendline breakout with volume
• Retest + continuation for safer entries
• Volatility spike around key levels
• RSI & momentum alignment before execution
⚠️ Not a buy/sell call. This is just market observation for educational purposes.
Trade your own plan, manage risk, and respect position sizing.
If you like clean chart breakdowns, price-action setups and real-time market tracking — hit follow so you don’t miss the next update.
Gold Price Targets 3990 After Support ReboundGold (XAU/USD) is trading around 3966, showing bullish momentum after rebounding from the support zone near 3928. The price is moving within an ascending channel, with a short-term target set at 3990. A breakout above this level could push prices toward the next resistance near 4006.

GOLD climbing.GOLD is starting to make it's way up in the NY session after news. Looking for new Higher Highs and Higher lows.

XAU/USD) Bearish trend analysis Read The captionSMC Trading point update
Technical analysis of XAU/USD (Gold Spot) – Bearish Continuation Setup
Timeframe: 1H (Capital.com)
Concepts: Smart Money Concepts (SMC), Trendline Break, FVG & EMA Confluence
---
Market Structure Overview
The uptrend structure was recently broken, confirming a shift to bearish order flow.
Price has broken the ascending trendline, retested near the FVG / premium retracement zone, and is rejecting from the supply area.
The structure and EMAs both support further downside continuation.
---
Key Technical Elements
Retracement Zone (Short Entry Area):
0.5 – 0.79 Fibonacci levels align with the Fair Value Gap (FVG), showing potential for bearish mitigation.
Price currently trading near 0.62–0.705 level (premium zone).
EMA Confluence:
EMA-50 ≈ 3,992
EMA-200 ≈ 4,024
Both EMAs are above price, acting as dynamic resistance.
Trendline Break:
The ascending trendline has been decisively broken and retested, indicating trend reversal confirmation.
---
Targets
Immediate Target (0-level structure): 3,940 zone
Extended Bearish Target: 3,796 — marked as the final target point on the chart
---
Scenario Plan
1. Expect minor retracement to the FVG zone (3,990–4,010).
2. Watch for bearish confirmation (rejection or lower-timeframe BOS).
3. Target downside continuation to 3,796, completing the swing projection.
Mr SMC Trading point
---
Bias:
> Bearish – Market showing structure shift, EMA confluence, and FVG rejection setup aligning toward deeper downside movement.
---
please support boost 🚀 this analysis

GOLD A Fall Expected! SELL!
My dear subscribers,
GOLD looks like it will make a good move, and here are the details:
The market is trading on 3995.7 pivot level.
Bias - Bearish
My Stop Loss - 4003.2
Technical Indicators: Both Super Trend & Pivot HL indicate a highly probable Bearish continuation.
Target - 3983.4
About Used Indicators:
The average true range (ATR) plays an important role in 'Supertrend' as the indicator uses ATR to calculate its value. The ATR indicator signals the degree of price volatility.
Disclosure: I am part of Trade Nation's Influencer program and receive a monthly fee for using their TradingView charts in my analysis.
———————————
WISH YOU ALL LUCK

GOLD: Short Signal with Entry/SL/TP
GOLD
- Classic bearish formation
- Our team expects pullback
SUGGESTED TRADE:
Swing Trade
Short GOLD
Entry - 3982.0
Sl - 3995.9
Tp - 3959.8
Our Risk - 1%
Start protection of your profits from lower levels
Disclosure: I am part of Trade Nation's Influencer program and receive a monthly fee for using their TradingView charts in my analysis.
❤️ Please, support our work with like & comment! ❤️

Shorting Europe Session Gold RallyExpected upside move in Europe session is in play. I will go for another short from here. I'm bearish until the end of US shutdown.

XAU/USD | Gold’s Sharp Breakdown – Bears Still in Control!By analyzing the Gold (XAUUSD) chart on the 2-hour timeframe, we can see that after several days of consolidation, price finally broke down sharply, hitting all our targets at $3,999, $3,985, and $3,947, and extending to $3,928 — delivering over 700 pips in profit.
After reaching the marked demand zone, gold bounced slightly and is now trading around $3,940. However, unless we see strong bullish momentum soon, a deeper decline remains likely. The next potential downside targets are $3,930, $3,915, and $3,905.
Further targets and updates will be shared in the next analysis.
Please support me with your likes and comments to motivate me to share more analysis with you and share your opinion about the possible trend of this chart with me !
Best Regards , Arman Shaban

Gold (XAUUSD): Sell setupGold (XAUUSD): Sell setup. Gold already did a BOS, it is now in the correction phase to continue downward. Any high price is considered cheap for a sell.
Cheers

AUD/JPY (2-hour, FXCM) chart Pattern..AUD/JPY (2-hour, FXCM) chart, here’s what’s visible:
Pair: AUD/JPY
Timeframe: 2H
Current price: around 99.51 JPY
Pattern: price broke below an ascending trendline, retested the underside (around 100.00 JPY), and is moving down with bearish confirmation from the Ichimoku Cloud.
Two blue arrows point to two distinct “Target Point” zones drawn on your chart.
---
🎯 Target Zones
From the chart:
1. First Target Point: around 98.40 JPY
This looks like the first measured move from the recent swing high to the breakout point.
It coincides with a prior horizontal support area.
2. Second Target Point: around 97.20 JPY
This is the extended target (full measured move).
Likely my final downside target if bearish momentum continues.
---
⚙ Quick Summary
Parameter Value
Entry Zone ~99.50
Target 1 (TP1) 98.40 JPY
Target 2 (TP2) 97.20 JPY
Stop-Loss (SL) ~100.20 JPY (above retest / Ichimoku cloud)
Trend Bias Bearish continuation

USD/JPY (2-hour timeframe, FXCM)....USD/JPY (2-hour timeframe, FXCM), here’s what I can interpret:
Pair: USD/JPY
Timeframe: 2H
Current price: around 153.65
Setup: price is following an ascending trendline, with a bullish move from the Ichimoku cloud.
Label on chart: “Target Point” marked above current price level.
🎯 Target Zone
From my chart, the blue arrow points up to the “Target Point” around 155.20 – 155.30 JPY.
That suggests:
Expected bullish continuation toward 155.20-155.30, assuming price respects the trendline and remains above the cloud.
The support area sits near 152.80-153.00, where the trendline and Ichimoku cloud converge.
⚙ Quick Summary
Parameter Value
Entry Zone ~153.6
Target (TP) 155.20 – 155.30
Support / Stop Loss (SL) 152.80 (trendline / cloud bottom)
Risk-Reward Roughly 1 : 2 if stop below 152.8

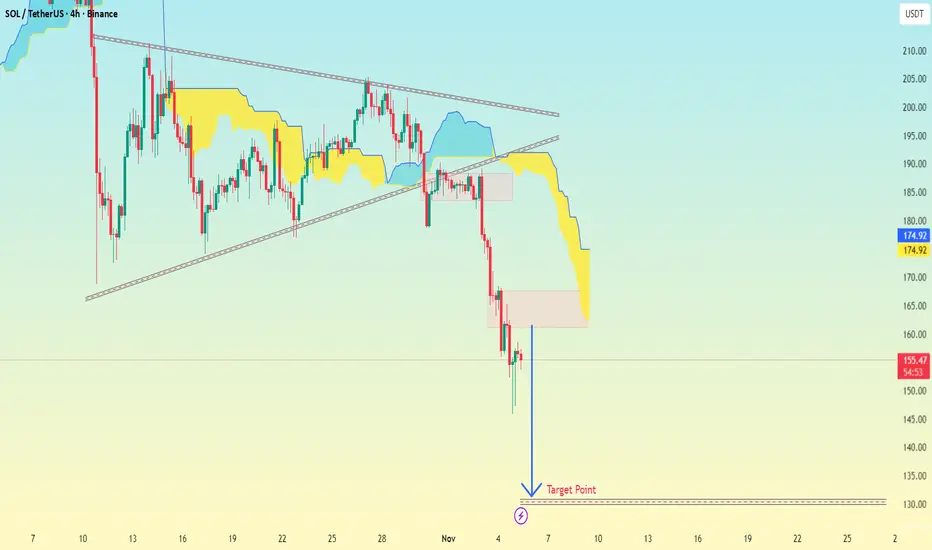
SOL/USDT (Solana vs Tether) Timeframe: 4-hour chart Pattern....SOL/USDT (Solana vs Tether)
Timeframe: 4-hour chart
Exchange: Binance
Analysis tool: Ichimoku Cloud + trendlines
Pattern: my drawn a descending triangle or bearish pennant that recently broke downwards.
Current Price: Around $153.67
Target Point (marked): Around $135 – $137 zone
🎯 Target Zone
From my chart, the “Target Point” label is placed approximately at:
> $135 USDT
This aligns with a measured move projection from the height of the triangle (around $200 down to ~$160), giving a target near $135 — a typical price objective for a bearish breakout.
🧠 Quick Breakdown:
Price broke below support near $160.
The Ichimoku Cloud turned bearish (price below cloud, red span ahead).
Momentum and volume confirm downside continuation.
Target completion likely around $135 – $137, unless support appears earlier.
XAUUSD Long: Demand Line Supporting Move Toward $4,080 TargetHello traders! Gold (XAUUSD) continues to show resilience as price action holds above the key $3,950 Demand Zone, signaling that buyers are still defending this area effectively. After forming a Double Top pattern near the $4,150 Resistance, the market entered a correction phase, which was guided by a clean break below the neckline, followed by a retracement defined by the Fibonacci Arc. This retracement created a series of Pivot Points that now serve as short-term references for buyers and sellers. The price has since found solid support along the Demand Line, aligning with the overall ascending Trend Line that has held firm since early October. Each rejection from this zone has been met with renewed buying pressure, suggesting that the current move could represent a continuation phase within the larger bullish structure.
Currently, gold is trading around the $4,000 level, consolidating just above its Demand Line. If bullish momentum accelerates from this area, we could see a push toward the $4,080 short-term target, followed by a possible test of the $4,150 major resistance — a critical level for confirming a broader breakout.
My base scenario anticipates a gradual upward move toward $4,080, which aligns with both the trend and key resistance confluence. A clean breakout above $4,150 would open the path for a stronger bullish continuation, potentially toward $4,200+. However, a confirmed breakdown below $3,950 could shift short-term sentiment to bearish, exposing the next support area near $3,900. For now, I maintain a bullish bias, expecting further upside momentum as long as the demand structure holds firm. Manage your risk.

XAU/USD – Price Consolidation Signals Potential Downside XAU/USD – Price Consolidation Signals Potential Downside Continuation
Gold (XAU/USD) continues to trade sideways within a wide range structure after multiple failed breakout attempts near the 4,000 USD mark. The current price action suggests that the market may be preparing for a bearish continuation if buyers fail to defend the lower boundary of this range.
Technical Overview:
Main Trend: Bearish bias remains intact on higher timeframes.
Current Structure: Sideways consolidation between 3,890 – 4,030 USD.
Resistance zone: 3,990 – 4,030 USD — previous supply area where sellers consistently stepped in.
Support zone: 3,900 – 3,890 USD — key demand zone and range bottom.
Indicators:
EMA50 (H1) acting as dynamic resistance near 3,985 USD.
RSI (H1) showing a bearish divergence, confirming loss of buying momentum.
Price Action Insight:
The recent swing highs have shown clear lower highs while the price remains capped under the range midpoint. This indicates that sellers are gradually regaining control.
Unless bulls push decisively above 4,000 USD, the probability favors a breakdown scenario targeting the 3,890 USD zone next.
Trading Strategy (Short Bias):
Sell Setup: Look for a rejection or bearish engulfing pattern near 3,985 – 3,995 USD.
Stop Loss: Above 4,030 USD.
Take Profit Targets:
TP1: 3,920 USD
TP2: 3,890 USD
Alternative Scenario:
If price breaks and closes above 4,030 USD with volume, expect a shift in short-term sentiment toward 4,060 – 4,090 USD.
Summary:
Gold remains in a neutral-to-bearish consolidation phase, with the overall sentiment leaning toward another test of the range bottom. Until a breakout occurs, traders can continue to trade the range — selling near resistance and buying at support — with tight risk control.

XAUUSD: Bulls Defend Channel Support, Eyeing $4,130 ReboundHello everyone, here is my breakdown of the current Gold setup.
Market Analysis
Gold (XAUUSD) continues to trade within a well-defined upward channel, showing a clear structure of higher highs and higher lows. After a series of breakouts and retests, the price recently tested the channel support and the key demand zone around $3,900–3,920, confirming buyers’ activity in that area.
Currently, previous fake breakout above the $4,130 resistance area led to a pullback, but the market is now stabilizing and showing early signs of bullish momentum. This zone aligns with both the lower boundary of the ascending channel and a horizontal support area — a technically strong confluence that often attracts long positions.
My Scenario & Strategy
The current setup suggests that as long as the $3,900 support holds, gold remains in a bullish structure. A confirmed bounce from the lower channel boundary would likely trigger a new impulsive move toward the $4,130 resistance zone, which is also the previous breakout area. If buyers manage to break and hold above that resistance, the next potential upside target is around $4,200–$4,250, aligning with the upper boundary of the channel.
My strategy here is to look for bullish confirmation signals (candlestick patterns or volume breakout) near the support zone and aim for long entries with targets toward $4,130 and higher. A daily close below $3,880 would invalidate this scenario and open the door for a deeper correction.
That's the setup I'm tracking. Thank you for your attention, and always manage your risk.

The Market Is Still in Distribution, but Smart Money Moves QuietGold is trading around $3,990, recovering slightly after last week’s sharp sell-off. However, from a Smart Money Concept (SMC) perspective, the market structure continues to show clear bearish intent — with lower highs, unmitigated supply zones, and descending liquidity still controlling price flow.
💭 1️⃣ Market Structure – The Bearish Flow Remains Intact
After several BOS (Break of Structure) and CHoCH (Change of Character) confirmations, the bullish attempts are getting weaker.
Price remains capped under a clean descending trendline, showing how sellers are gradually stepping in at every premium retracement level.
The current market is operating within a distribution phase, where Smart Money continues to build short positions above liquidity zones while trapping late buyers inside minor pullbacks.
The key level 4,043 – 4,050 stands out as the nearest Bearish Order Block (OB) and strong short-term supply. Until this area is decisively broken, Gold remains technically bearish.
🩶 2️⃣ Supply Zones – Where Smart Money Left Their Footprints
Karina is currently watching three critical supply layers:
4,043 – 4,050: Active supply zone aligning with trendline confluence – ideal for short-term sell setups.
4,149 – 4,160: A deeper liquidity pocket where Smart Money previously distributed heavy positions.
4,221 – 4,359: Major macro supply zones – where institutional orders were likely built during October’s highs.
Price is still well below these regions, suggesting that any rally remains corrective rather than impulsive.
🧭 3️⃣ Liquidity Context – The Path of Least Resistance
Below current price, 3,884 – 3,890 forms the next liquidity magnet — a cluster of equal lows and inefficiency gaps that Smart Money might target next.
Above, resting buy-side liquidity around 4,050 gives institutions a perfect opportunity to engineer a small push up before resuming the main downtrend.
This is the same pattern we’ve seen repeatedly: liquidity grab → displacement → continuation.
🌙 4️⃣ Trading Scenario – Flow With the Institutions, Not Against Them
As long as the structure remains below the trendline, Karina maintains a bearish bias.
If price retests 4,043 – 4,050 and shows rejection through a bearish engulfing or sharp rejection wick, short setups will align with SMC logic.
Entry: 4,043 – 4,050
Stop Loss: 4,060
Take Profit: 3,884 – 3,890
The setup offers a clean 1:4 R:R, based purely on structure and liquidity flow — no indicators, no noise.
🌷 5️⃣ Reflection – When Silence Speaks Louder Than Volatility
Gold’s current rhythm is calm yet calculated. Every retracement feels like a whisper from Smart Money — testing patience, not conviction.
For Karina, this is the phase where discipline matters most.
While many chase impulsive moves, Smart Money quietly prepares for the next wave, and the charts tell their story to those patient enough to listen. 🌙
This analysis reflects Karina’s personal view and is not financial advice.
What do you see in today’s Gold structure? Is this retracement a calm before another drop, or the beginning of accumulation? Let’s discuss below 💬

GOLD How to Trade the XAUUSD Range Breakout StrategyLet's cut straight to the chase on Gold (XAU/USD). Right now, the chart isn't giving us much to work with. We are locked solid in a textbook range-bound environment. 😒
If you compare this choppy, sideways action to the clear trends we've seen previously, the difference is stark. There is simply no directional conviction in the market at the moment; we're witnessing classic accumulation/distribution—or just plain indecision.
My focus is simple: Patience is your edge right now. I'm not interested in getting chopped up inside this consolidation zone. We are waiting for a concise, decisive move—a clean breakout—either above the high or below the low of this current range.. and a retest of the range. ⬆️⬇️
Bullish Scenario: A breakout above, followed by a successful re-test and fail. That's our green light for a long position, signaling momentum has shifted North. 🚀
Bearish Scenario: A breakdown and re-test of the range. That's the cue for a short opportunity, confirming bearish momentum. 📉
The breakout and re-test confirmation will be key. Until then, I'll stand aside and preserve capital. No setup, no trade. 🔥

XAU/USD Intraday Plan | Buyers Need 3989 BreakAfter breaking below the 3989 support level yesterday, gold tested the First Reaction Zone as anticipated, where buyers stepped in and defended the area.
Price is now trading around 3968, but still below both the MA50 and MA200, which keeps short-term momentum bearish.
For buyers to regain control, we need a clear break and hold above the 3989 level. A break above this area could open the move toward the 4042 resistance, with 4090 possible if momentum continues.
If price fails to reclaim the 3989 level, we may see another retest of the Reaction Zone. Failure to hold that area could expose the lower Support Zone and potentially the HTF Support Zone below.
📌 Key Levels to Watch:
Resistance:
3989
4042
4090
4120
Support:
3957
3918
3884
3851
3820
3781
🔎 Fundamental Focus:
Today has a few medium-to-high impact U.S. releases, including ADP Employment, and ISM Services PMI, which could influence intraday volatility. Later in the session, President Trump is scheduled to speak, which also has the potential to move markets depending on tone and messaging.

EUR/CAD: Bullish Outlook📈EURCAD formed a significant inverted head and shoulders pattern on a 4-hour timeframe.
The neckline for this pattern is identified between 1.6226 and 1.6210.
Should the price successfully break and close above this neckline, it would indicate a strong bullish signal.
In such a scenario, the market could potentially advance towards the 1.6560 level.
Please note that the neckline currently acts as a robust demand area. Shorting opportunities should only be considered after a confirmed breakout of this level.

XAUUSD: Tension Builds as the Market Awaits DirectionWhat’s really happening here?
If you take a close look at today’s XAUUSD chart, you’ll notice a very dramatic picture: gold prices are being tightly compressed inside a converging triangle pattern.
This is a classic formation that reflects the battle between two market forces:
- Buyers are forming higher lows, showing increasing buying pressure.
- Sellers, on the other hand, continue to hold lower highs, consistently blocking every upward attempt.
As these two trendlines move closer together, the market becomes like a compressed spring; the longer it’s squeezed, the stronger the move will be once it’s released.
So, what does this mean?
In my view, it shows that gold is currently in a highly sensitive accumulation phase, and any breakout could trigger a major move in a new direction.
- If the price breaks above the 4,020 – 4,030 USD resistance zone, it could be the first signal of a new bullish wave targeting 4,070 – 4,100 USD.
- Conversely, if it breaks below the 3,960 USD support, a bearish scenario will likely unfold, pulling the price back toward 3,910 – 3,880 USD.
🔹 How to identify a real breakout (my way):
- Wait for confirmation with a strong closing candle and high volume.
- A successful retest of the broken zone (which now switches roles: resistance → support or vice versa) will serve as a “golden certificate” for a sustainable breakout.
- And remember, false breakouts often occur right before the market truly explodes.
🔹 Risk factors (from my perspective):
- If gold breaks the boundary without volume or with long-wicked candles, it could simply be a trap set by major players.
- Once the price falls back inside the triangle after a breakout, the entire structure becomes invalid.
✅ Conclusion (in my view):
- Gold (XAUUSD) is now in the “calm before the storm” phase.
- Buyers are quietly accumulating near support areas, while sellers defend the last line of resistance.
- A clear and confirmed breakout in either direction could set the stage for a big move this week.
Stay disciplined:
- Wait for breakout + confirmation + retest; that’s how you stay on the right side of the market and avoid false signals.
This is not financial advice, just my personal view of today’s chart — my way.
Trade safely and patiently, because sometimes doing nothing is also a strategy.

SILVER BEARS ARE GAINING STRENGTH|SHORT
SILVER SIGNAL
Trade Direction: short
Entry Level: 4,774.1
Target Level: 4,681.8
Stop Loss: 4,835.8
RISK PROFILE
Risk level: medium
Suggested risk: 1%
Timeframe: 1h
Disclosure: I am part of Trade Nation's Influencer program and receive a monthly fee for using their TradingView charts in my analysis.
✅LIKE AND COMMENT MY IDEAS✅

XAUUSD H4 | Bullish Bounce Off Key SupportGold (XAU/USD) is falling towards the buy entry, which is an overlap support that aligns with the 61.8% Fibonacci retracement and could bounce from this levle to the upside.
Buy entry is at 3,969.18, whic is an overlap support that aligns with the 61.8% Fibonacci retracement
Stop loss is at 3,794.07, which is an overlap support that lines up with the 78.6% Fibonacci retracemnt.
Take profit is at 4,070.26, which is a pullback resistance that lines up with the 38.2% Fibonacci retracement.
Stratos Markets Limited (tradu.com ):
CFDs are complex instruments and come with a high risk of losing money rapidly due to leverage. 68% of retail investor accounts lose money when trading CFDs with this provider. You should consider whether you understand how CFDs work and whether you can afford to take the high risk of losing your money.
Stratos Europe Ltd (tradu.com ):
CFDs are complex instruments and come with a high risk of losing money rapidly due to leverage. 70% of retail investor accounts lose money when trading CFDs with this provider. You should consider whether you understand how CFDs work and whether you can afford to take the high risk of losing your money.
