( Gold Protocol ) Bearish After Break Detected Status: Active Reversal Protocol
Symbol: Gold
Session: London–New York Overlap (Smart Exit Window)
Confidence Level: ★★★★★ ( Hanzo Volume Detected )
☄️ Bearish After Break Out 4005
Reasons
1. Alpha Sequence Engaged
— Smart flow detected within Hanzo precision range.
2. Volume Window Synced
— Session energy aligns with internal volume pulse.
3. Liquidity Cycle Active
— Engineered sweep confirms smart money transition.
4. Time Lock Confirmed
— Market phase locked with directional intent.
5. Volume Map Aligned
— Cluster balance reveals real directional flow.
6. Hanzo Wick Detected
— Manipulation wick verified under Alpha filter.
⤵️Every like & comment on our TradingView posts helps us grow. More engagement means more exposure, which benefits everyone in the community!
Metals

GOLD | Bearish Momentum Holds Below Pivot Zone GOLD | Bearish Momentum Holds Below Pivot Zone
Gold remains under bearish pressure as it trades below the pivot zone at 4,034–4,053, signaling continued weakness amid cautious sentiment ahead of upcoming U.S. data.
🕯 Momentum remains negative, but a breakout above the pivot zone could quickly shift the tone back to bullish.
Key Levels
Pivot Zone: 4,034 – 4,053
Resistance: 4,082 · 4,105 · 4,189
Support: 4,004 · 3,982 · 3,921
Trading Plan:
Sell Setup: Shorts valid below 4,038, targeting 4,004 / 3,982 / 3,921.
Buy Setup: Longs valid only above 4,053, targeting 4,105 / 4,152.
Premium Takeaway
Gold remains in bearish control below 4,053, with potential to drop toward 3,982–3,921.
A confirmed 1H close above 4,053 would shift bias to bullish, opening the path toward 4,105–4,189 in the short term.

SilverXAGUSD
- Completed " 12345 " Impulsive Waves
- Demand Zone
- Fibonacci Level - 50.00% / 61.80%
- RSI - Divergence
- Bullish Channel as an corrective pattern in Short Time Frame

Gold pivotal level at 4067 resistanceGold remains in a neutral trend, with recent price action showing signs of a corrective pullback within the broader uptrend.
Support Zone: 3887 – a key level from previous consolidation.
A bullish rebound from resistance: 4067 would confirm ongoing upside momentum, with potential targets at:
4067 – initial resistance
4110 – psychological and structural level
4165 – extended resistance on the longer-term chart
Bearish Scenario:
A confirmed break and daily close below 3887 would weaken the bullish outlook and suggest deeper downside risk toward:
3844 – minor support
3790 – stronger support and potential demand zone
Outlook:
Neutral bias remains intact while the gold trades around pivotal 4067 level. A sustained break below or above this level could shift momentum.
This communication is for informational purposes only and should not be viewed as any form of recommendation as to a particular course of action or as investment advice. It is not intended as an offer or solicitation for the purchase or sale of any financial instrument or as an official confirmation of any transaction. Opinions, estimates and assumptions expressed herein are made as of the date of this communication and are subject to change without notice. This communication has been prepared based upon information, including market prices, data and other information, believed to be reliable; however, Trade Nation does not warrant its completeness or accuracy. All market prices and market data contained in or attached to this communication are indicative and subject to change without notice.

Silver oversold bounce resistance at 4980The Silver remains in a bullish trend, with recent price action showing signs of a corrective pullback within the broader uptrend.
Support Zone: 4737 – a key level from previous consolidation. Price is currently testing or approaching this level.
A bullish rebound from 4737 would confirm ongoing upside momentum, with potential targets at:
4980 – initial resistance
5066 – psychological and structural level
5166 – extended resistance on the longer-term chart
Bearish Scenario:
A confirmed break and daily close below 4737 would weaken the bullish outlook and suggest deeper downside risk toward:
4667 – minor support
4600 – stronger support and potential demand zone
Outlook:
Bullish bias remains intact while the silver holds above 4737. A sustained break below this level could shift momentum to the downside in the short term.
This communication is for informational purposes only and should not be viewed as any form of recommendation as to a particular course of action or as investment advice. It is not intended as an offer or solicitation for the purchase or sale of any financial instrument or as an official confirmation of any transaction. Opinions, estimates and assumptions expressed herein are made as of the date of this communication and are subject to change without notice. This communication has been prepared based upon information, including market prices, data and other information, believed to be reliable; however, Trade Nation does not warrant its completeness or accuracy. All market prices and market data contained in or attached to this communication are indicative and subject to change without notice.

Gold Trade IdeaGold is testing back 4000. 2 additional resistances also share the 4000 so it will be a strong intraday resistance. The idea came with 3.14 RR.

XAGUSDHello Traders! 👋
What are your thoughts on Silver ?
Silver entered a corrective phase following its recent rally and is now trading below the resistance zone and the broken trendline.
This structure suggests weakening bullish momentum and a potential continuation to the downside once the pullback completes.
We expect price to complete a pullback toward the broken zone and then resume its downward movement toward the identified support levels.
As long as silver remains below the resistance and trendline, the bearish bias stays valid.
A confirmed break and close above resistance would invalidate this scenario.
Don’t forget to like and share your thoughts in the comments! ❤️

GOLD SELLERS WILL DOMINATE THE MARKET|SHORT
GOLD SIGNAL
Trade Direction: short
Entry Level: 4,010.34
Target Level: 3,889.94
Stop Loss: 4,089.87
RISK PROFILE
Risk level: medium
Suggested risk: 1%
Timeframe: 4h
Disclosure: I am part of Trade Nation's Influencer program and receive a monthly fee for using their TradingView charts in my analysis.
✅LIKE AND COMMENT MY IDEAS✅

USDCAD possible fall!USDCAD could be falling today getting into NY session. Waiting for confirmation aa it has been struggling passing the zone it is at.

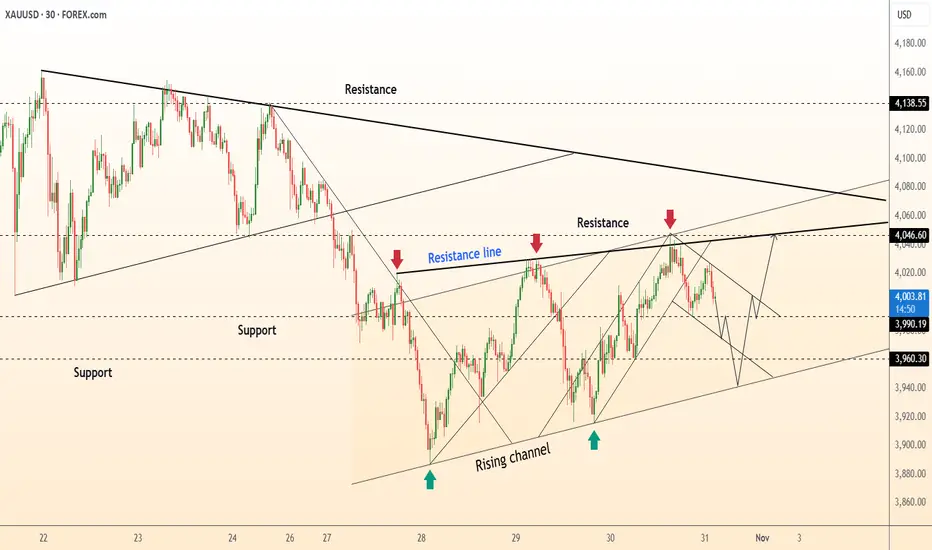
DeGRAM | GOLD is forming a new local ascending structure📊 Technical Analysis
● XAU/USD is forming a rising channel, holding firm above 3,960 support after rejecting from the resistance near 4,046.
● The pattern suggests a continuation of the uptrend as long as price sustains above the channel base, with potential breakout targets toward 4,138.
💡 Fundamental Analysis
● Gold remains supported by a softer dollar and cautious market sentiment ahead of key U.S. employment data, which could further boost safe-haven demand.
✨ Summary
● Long bias above 3,960; targets 4,046–4,138. Rising structure and weaker dollar fundamentals reinforce short-term bullish momentum.
-------------------
Share your opinion in the comments and support the idea with a like. Thanks for your support!
XAUUSD: Market Analysis and Strategy for October 31Gold Technical Analysis:
Daily chart resistance: 4090, support: 3890.
4-hour chart resistance: 4050, support: 3915.
1-hour chart resistance: 4030, support: 3988.
After a double bottom yesterday, gold prices rebounded again, even briefly reaching 4040 today. However, this momentum was short-lived, and prices fell back again during the Asian session. Currently, it's around 4000.
Today is Friday, the end of both the weekly and monthly charts. Various indicators suggest that the gold correction is far from over, so this rebound is merely a small pause in the downtrend and cannot be considered a reversal.
Today's trading strategy is to deal with the market within a range, focusing on support at 3988-3950 and resistance at 4030/4050/4100.
SELL: 4050 near
BUY: 3988 near
Join VIP to get live-time trading guidance

Gold (XAU/USD) Technical AnalysisGold (XAU/USD) Technical Analysis – Potential Rebound Toward Key Resistance Zone
On the 1H timeframe, Gold (XAU/USD) shows signs of a short-term recovery after a period of consolidation near the $4,000 psychological support. Price action has formed a higher low, hinting at potential bullish momentum building up in the short term.
Currently, the market is attempting to recover from the recent dip, and the next upside target lies around the $4,080 – $4,100 resistance zone, where previous supply and structural rejection occurred. This area also aligns with the 38.2% Fibonacci retracement of the recent downward swing, making it a critical level to monitor.
Key Levels to Watch
Resistance: $4,080 – $4,100 (short-term supply zone)
Support: $3,980 – $3,950 (recent swing low area)
Trading Plan
Scenario 1 – Buy on pullback:
If price holds above $3,980 and confirms a higher low, traders may consider buying toward the $4,080–$4,100 zone.
Scenario 2 – Rejection at resistance:
Should price face strong selling pressure at $4,100, it could trigger another correction back toward $3,950. Watch for bearish signals before shorting.
Technical Outlook
Overall, Gold remains in a corrective phase within a broader downtrend. Short-term buyers may drive a recovery toward $4,100 before stronger sellers re-enter the market. A clean breakout above $4,100 could shift intraday sentiment to bullish.

Real Estate vs Gold, Bitcoin, Stock MarketThis chart illustrates relative performance of Real Estate, Stock Market, Gold & Bitcoin through the critical Covid timeline up to recent time

DeGRAM | GOLD formed a rising bottom📊 Technical Analysis
● XAU/USD is trading inside a descending channel, forming a short-term rebound from the support line near 3,945, signaling a potential breakout attempt.
● A move above the 4,025–4,040 resistance zone would confirm a channel break and open the path toward the 4,138 level.
💡 Fundamental Analysis
● Gold finds demand amid geopolitical uncertainty and weaker U.S. Treasury yields, while markets await key inflation data that may limit dollar strength.
✨ Summary
● Long bias above 3,945; target 4,040–4,138. Channel bottom rebound supports a short-term bullish recovery scenario.
-------------------
Share your opinion in the comments and support the idea with a like. Thanks for your support!

Gold is Trading Under The Pressure of a Strong Dollar!!Hey Traders, in today's trading session we are monitoring XAUUSD for a selling opportunity around 4,020 zone, Gold is trading in a downtrend and currently is in a correction phase in which it is approaching the trend at 4,020 support and resistance area.
Trade safe, Joe.

GOLD (XAUUSD): Another Pullback Trade
Gold is testing a major daily resistance that we spotted earlier again today.
It looks like the price may retrace from that one more time.
A bearish breakout of a support line of a rising channel is my
intraday confirmation.
Goal - 3989
❤️Please, support my work with like, thank you!❤️
I am part of Trade Nation's Influencer program and receive a monthly fee for using their TradingView charts in my analysis.

Gold Rebound: Bulls Target 4,130 ResistanceHello, traders, I want share with you my opinion about Gold. Gold has been trading within a broad technical structure, evolving from a strong bullish phase into a corrective descending channel. The previous uptrend was clearly defined by an ascending channel, which guided the price through multiple impulsive rallies and pullbacks. However, after forming a double-top pattern near the 4320 resistance level, buyers began to lose momentum, resulting in a sharp decline. Currently, the price is trading within a well-defined descending channel, where sellers have been maintaining short-term control. After a deep test of the Buyer Zone around 3920, the market has shown early signs of a potential rebound. The asset is now pulling back from this support area and is approaching the resistance line of the descending channel. In my opinion, this upward correction represents a short-term recovery within a larger bearish context. I expect that the price will rally towards the Resistance Level near 4130–4140, where strong selling pressure may reappear. This area is also aligned with the upper boundary of the descending channel, creating a strong confluence zone. A rejection from this resistance line would confirm the continuation of the bearish structure. The next potential move could be a rotation back down towards the Buyer Zone, or even a deeper retest of the Support Line around 3920. My take-profit (TP1) for the corrective rally is placed at 4108, targeting the upper range of the structure before the next potential reversal. Please share this idea with your friends and click Boost 🚀

Stop!Loss|Market View: AUDUSD🙌 Stop!Loss team welcomes you❗️
In this post, we're going to talk about the near-term outlook for the AUDUSD currency pair☝️
Potential trade setup:
🔔Entry level: 0.65191
💰TP: 0.64101
⛔️SL: 0.65706
"Market View" - a brief analysis of trading instruments, covering the most important aspects of the FOREX market.
👇 In the comments 👇 you can type the trading instrument you'd like to analyze, and we'll talk about it in our next posts.
💬 Description: Sell pressure remains particularly strong on the Austrian and New Zealand dollars, with these two pairs expected to see the most significant strengthening of the USD. Currently, there is an open gap near this year's POC level, and a breakout of this level (near short-term support at 0.65230) will likely trigger a downward impulse amid liquidation by buyers (their stop-loss levels).
Thanks for your support 🚀
Profits for all ✅
❗️ Updates on this idea can be found below 👇

Stop!Loss|Market View: USDJPY🙌 Stop!Loss team welcomes you❗️
In this post, we're going to talk about the near-term outlook for the USDJPY currency pair☝️
Potential trade setup:
🔔Entry level: 153.477
💰TP: 155.036
⛔️SL: 152.140
"Market View" - a brief analysis of trading instruments, covering the most important aspects of the FOREX market.
👇 In the comments 👇 you can type the trading instrument you'd like to analyze, and we'll talk about it in our next posts.
💬 Description: The yen continues to accumulate near the 153 resistance area, with a gap in the 148-149 range continuing to attract sellers to open trades. Currently, short-term buy remains the priority, with a breakout of the 153 resistance area toward 154-155 expected.
Thanks for your support 🚀
Profits for all ✅
❗️ Updates on this idea can be found below 👇

Gold Buy at 4080 and sell at 4240Now gold in consolidation mode and trying to book profits and make the retail traders into the trap so for now we need to be patience and buy at 4080 and close at 4240, after the fed interest cut gold will come down so sell at 4240 and wait for long selling till 3966. This method is Wd Gann inspiration i made and am still learning, this one sharing for study purpose so trade with your own analysis.

XAU/USD – Key Decision Point Before the Next Big MoveGold continues to consolidate below the major resistance zone at $4,060–$4,100, after a recovery from the $3,950 area. The market is currently testing an important structure level, and today’s reaction here will determine the next short-term trend.
Technical Outlook (H1 timeframe):
Immediate Resistance: $4,060 – $4,100
Major Resistance: $4,180 – $4,200
Support Zone: $3,950 – $3,900
Key Level to Watch: $4,000
If price breaks and holds above $4,060, bulls may gain momentum toward $4,150 – $4,200, forming a potential short-term continuation pattern.
However, a rejection below $4,060 could trigger another decline toward $3,950, and if that breaks, the next target lies near $3,860.
Trading Strategy:
Bullish Scenario: Wait for a confirmed breakout and retest above $4,060, then target $4,150–$4,200.
Bearish Scenario: Look for rejection signals at $4,060 or a break below $4,000 to sell toward $3,950 and $3,860.
RSI is showing a potential short-term overbought condition, so traders should remain patient and wait for price confirmation before entering.
Stay disciplined—gold is in a key reaction zone, and today’s close could define the next 2–3 sessions.
Follow for more daily gold trading strategies and updates.

Gold Intraday – Oct 31 (No. 1)Starting the day with a clean setup on gold.
Waiting for price to break below 4008 – 4007 zone to confirm short entry.
The structure is showing early weakness after a strong push up yesterday — planning to ride a small intraday drop if it triggers.
Targets are staged near 3980 / 3966 / 3952 (RR 1.0 – 2.0 levels).
Setup remains waiting until breakout is confirmed — no entry yet.
I prefer simple price action over indicators — clean zones, clean risk.
⚠️ Disclaimer: This idea is only my personal market view shared for educational purposes.
It’s not financial advice. Always trade with your own analysis and proper risk management

Gold Futures (MGCZ25) – Monthly Close SetupPrice has ranged all week between 4040 and 3930. With an H4 FVG still sitting above, we might see one last liquidity grab before the next directional move.
⚖️ Neutral bias for now — watching for clean displacement at range extremes.
📍 If price reclaims 4040 → possible push into the H4 FVG.
📍 If it rejects and drops below 4020 → lower FVG fills toward 3930 could be next.
#Gold #Futures #ICT #MarketStructure #NOFOMO
