DeGRAM | GOLD formed a bullish takeover📊 Technical Analysis
● XAU/USD shows a bullish takeover after rebounding from the support line near 4,219, confirming buyers’ control in the short-term structure.
● Price is now trading within an ascending channel, aiming toward the 4,240–4,250 resistance area, with intraday pullbacks likely forming higher lows.
💡 Fundamental Analysis
● Gold gains support from softer U.S. yields and cautious Fed remarks, improving sentiment for safe-haven assets.
✨ Summary
● Long bias above 4,219; objectives 4,240–4,250. Strong bullish candle and favorable macro backdrop confirm short-term upward momentum.
-------------------
Share your opinion in the comments and support the idea with a like. Thanks for your support!
Metals

Gold 1H – Will Dovish Fed Bets Keep Gold Above 4300?XAUUSD – Intraday Trading Plan | by Ryan_TitanTrader
📈 Market Context
Gold prices remain resilient near $4,365 as traders assess the shifting outlook for U.S. monetary policy. After softer inflation data earlier this week, market sentiment has turned cautiously dovish — investors are speculating that the Federal Reserve may cut rates sooner in 2026 if growth indicators weaken further.
However, today's focus is on the U.S. housing and labor data, which could influence short-term volatility. A strong report may revive dollar demand and trigger profit-taking in gold, while weaker readings could boost safe-haven interest and push XAUUSD higher toward 4,400+.
Expect intraday swings as liquidity hunts unfold before any decisive trend confirmation.
🔎 Technical Analysis (1H / SMC Style)
• The structure remains bullish, supported by consecutive Breaks of Structure (BOS) and a clean reaccumulation phase during the 4,230–4,270 consolidation.
• Price recently tapped a premium supply zone near 4,400, where early sellers may attempt short-term reactions.
• The discount demand zone at 4,300–4,302 aligns with a 0.382–0.5 Fibonacci retracement and previous BOS support, offering a high-probability re-entry area for continuation.
• Liquidity sweeps above 4,400–4,398 could attract institutional profit-taking before the next bullish leg resumes.
🔴 Sell Setup: 4400 – 4398
SL: 4410
TP targets: 4340 → 4315
🟢 Buy Setup: 4300 – 4302
SL: 4293
TP targets: 4345 → 4385 → 4410+
⚠️ Risk Management Tips
• Wait for M15 ChoCH/BOS confirmation before entering any setup.
• Expect volatility during U.S. macro data releases — spreads may widen temporarily.
• Use partial take-profits near intraday liquidity zones and trail stops once structure confirms bullish continuation.
✅ Summary
XAUUSD maintains its bullish structure above 4,300. A short-term pullback toward the 4,300–4,302 demand zone could offer another opportunity for buyers to rejoin the trend.
While profit-taking may occur at 4,400, the broader bias remains “Buy the Dip” unless a confirmed shift in structure occurs below 4,293.

Gold's Historic Rally: Why It HappenedGold approaches $4,500 per ounce for the first time in history. Up more than 50% in less than a year. Everyone's asking the same question: Is this a historic breakout, or the setup for a massive crash?
The answer requires looking at three things: what brought us here, where we are technically, and what could go wrong.
PART 1: THE MACRO STORY
Gold doesn't just rally because people are "scared." It rallies because of structural shifts in how the world's largest institutions view money, risk, and trust.
Central Banks Are Buying Gold at Record Pace
Here's a number that should get your attention: Central banks bought 1,045 tons of gold in 2024. That's the second-highest annual total on record.
In 2025, the buying hasn't slowed down. Poland alone has accumulated 67 tons year-to-date. Turkey, India, Kazakhstan, and others are following suit.
But here's what's really happening: This isn't about inflation hedging. If it were, Western central banks (US, Europe) would be buying too. They're not. Instead, emerging market central banks are diversifying away from the dollar.
Why? Because they watched what happened in 2022 when the US froze Russian reserves. When you hold dollar-denominated assets, they can be weaponized. Gold can't be sanctioned. Gold can't be frozen.
Central banks don't panic sell on a 5% dip. When they buy, they hold. This creates a structural price floor. Every pullback gets accumulated.
What this means: Central bank buying is the foundation of this rally, not a temporary catalyst.
The Federal Reserve is Cutting Interest Rates
According to the CME FedWatch Tool, there is a level of certainty that the Fed would cut rates in October 2025, with markets pricing in another cut in December this year.
When interest rates fall, something important happens to gold: its "opportunity cost" decreases.
Here's the simple version: Gold pays no interest. So when bonds also pay almost nothing (after inflation), holding gold looks pretty reasonable. But when real yields are high, bonds look better and gold looks worse.
Right now, the market is pricing in lower real yields ahead. That's bullish for gold. If the Fed doesn't cut as much as the market expects, that changes everything.
What this means: Rate cuts fuel the rally.
Geopolitical Instability & Currency Debasement
Global tensions remain elevated: Middle East instability, US-China friction, and the ongoing Russia-Ukraine conflict. But that's not the real driver here.
The real driver is the loss of faith in government money.
Gold is at an all-time high, not just in US dollars. It's also hitting all-time highs in euros, yen, and yuan. This isn't a dollar story. This is a global reassessment of what "money" actually means.
Meanwhile, the US national debt is over $35 trillion. Debt-to-GDP is at World War II levels. Other countries (Japan, Europe) are in similar situations, printing money and running massive deficits.
When governments print excessively, investors need a hedge. Gold can't be printed.
What this means: As long as deficits remain high and geopolitical chaos persists, gold has structural demand that goes beyond cycles.
The Bottom Line
Three powerful forces are all pushing in the same direction:
Central banks structurally accumulating gold (de-dollarization)
The Fed cutting rates (lower real yields = gold support)
Global monetary instability (currency debasement = safe-haven bid)
This combination hasn't existed in most traders' lifetimes. That's why this rally feels different. And why it's lasted this long.

GOLD BULLISH We have seen gold to be in a strong bullish momentum as its has broken the 4000 price margin and still keeps buying,This is the active trend channnel of gold as the path still leads to 4400,4420 .
4315 and 4360 are key liquidity zones

Stop!Loss|Market View: BTCUSD🙌 Stop!Loss team welcomes you❗️
In this post, we're going to talk about the near-term outlook for the BTCUSD ☝️
Potential trade setup:
🔔Entry level: 107,294.21
💰TP: 99,296.41
⛔️SL: 113,888.88
"Market View" - a brief analysis of trading instruments, covering the most important aspects of the FOREX market.
👇 In the comments 👇 you can type the trading instrument you'd like to analyze, and we'll talk about it in our next posts.
💬 Description: Given the technical accumulation of the price near the lower border of the accumulation area 110,500 - 121,810, as well as a decline in open interest in the BTC futures market (medium- to long-term picture), a breakout of the lower border of the indicated accumulation area is expected. The key target is near 100,000, with a further decline to 90,000 expected.
Thanks for your support 🚀
Profits for all ✅
❗️ Updates on this idea can be found below 👇

How to Short Gold as a Stock Trader and Profit on the DropGold is at historically high levels due to several key factors
Geopolitical Tensions: Trade disputes, regional conflicts, and global uncertainty are pushing investors toward safe-haven assets like gold
Monetary Policy Expectations: Anticipated interest rate cuts reduce the opportunity cost of holding gold, making it more attractive compared to bonds or cash
Weakening U.S. Dollar: A softer dollar makes gold cheaper for international buyers, boosting demand
Central Bank and Institutional Demand: Many central banks are increasing gold reserves, and institutional investors are allocating more to gold as a hedge against economic instability
Market Sentiment and Speculation: Bullish sentiment and speculative positioning are adding upward pressure on prices
If these factors start to ease, such as trade tensions reducing (highly likely with the next Trump Tweet), interest rates staying the same or even rising (less likely), or the dollar strengthening (likely), gold could start to pull back and given how aggressive its run has been, it could be a significant pull back.
For investors looking to profit from declines, inverse gold ETFs provide a way to benefit when prices fall, offering a strategic tool for hedging or directional trading.
They are a MUCH riskier type of trade - especially leverage ETFs so please do your research beforehand and definitely do not invest any money you can't do without if it all goes horribly wrong and Gold does indeed continue to head up past $5k.
Crazy times - hence probably why Gold is doing so well.
Buyer / bear - beware :)

Gold Price Analysis – October 17, 2025Gold Price Analysis – October 17, 2025 | XAU/USD Short-Term Outlook
Gold continues its strong bullish momentum, extending gains above the 4,300 level after breaking out of the ascending trendline that has guided the market since late September. The recent rally reached a local peak near 4,345 USD, showing signs of temporary exhaustion as buyers start to take profits.
Technical Overview
On the 1H timeframe, price structure remains bullish, yet a short-term correction could be in play. The last impulse leg formed an over-extended wave, and the current retracement may retest lower supports before resuming the main trend.
Immediate Support: 4,280 – 4,300
Next Key Support Zones:
• 4,080 (previous breakout base)
• 3,962 (Fibonacci 0.382 retracement)
• 3,830 (major demand zone)
Resistance: 4,450 – 4,455 (local target / expansion level)
Trading Scenarios
1. Buy-the-Dip Setup:
Watch for bullish confirmation between 4,280 – 4,300. If price stabilizes here, bulls could target 4,450 with stops below 4,270.
2. Correction Scenario:
If momentum fades and 4,280 breaks decisively, a deeper correction toward 4,080 – 3,960 is likely before the next wave up.
Indicators & Confluence
EMA structure: Still stacked bullishly.
RSI: Overbought but holding above 60, suggesting trend strength.
Fibonacci & trendline confluence: Aligns near 4,080, reinforcing the “buy-on-dip” bias.
Summary:
Despite short-term pullbacks, gold’s macro trend remains bullish, supported by strong momentum and rising demand for safe-haven assets. Traders should look for retracement entries rather than chasing tops.
Follow for more intraday strategies and Fibonacci-based trade ideas. Save this post if you find it useful — consistency builds mastery.

GOLD sets new record amid global risk waveSpot OANDA:XAUUSD continued to break out in the Asian trading session on Thursday morning (October 16), hitting a record high of $4,239.07/ounce, as investors increasingly sought the precious metal as a safe haven from increasingly complex fluctuations in the global economy.
In the previous session, gold closed at $4,207.85/ounce, up $65.94 (equivalent to 1.59%), and continued to increase by more than $25 today. Since the beginning of the week, gold prices have increased by nearly 5%, continuing a strong upward trend since mid-August.
The rise in gold prices comes as the US Federal Reserve (Fed) signals it will maintain its easy monetary policy path. Speaking this week, Fed Chairman Jerome Powell said the central bank is “on track” to cut its benchmark interest rate by another 0.25% later this month, in response to signs of weakening growth and external uncertainty. Lower borrowing costs typically increase the appeal of non-yielding gold compared to bonds and currencies.
Meanwhile, US President Donald Trump’s latest comments have added to the market’s tension. Responding to a reporter’s question about trade relations with China, Mr. Trump said: “Yes, we are in a trade war right now.”
This statement, quoted by Bloomberg News, has raised concerns about long-term damage to the global economy, a factor that often drives capital flows to safe-haven assets such as gold.
In addition, the risk of a US government shutdown and the “downdraft effect” when investors simultaneously sell bonds and foreign currencies to switch to holding gold and safe-haven assets, further strengthening the precious metal’s price increase.
Strong central bank gold buying has also played a significant role in the rally. Personally, I believe that much of this year’s rally has been “driven by physical demand”, as many central banks “aggressively add to reserves to hedge against sovereign debt risks and expansionary monetary policies”.
So far, gold prices have risen more than 60% in 2025, reflecting a clear shift in global investment thinking, where gold has once again asserted its central role as a source of financial confidence in times of political and monetary uncertainty.
Technical Analysis OANDA:XAUUSD
Spot XAUUUSD continues to maintain a strong uptrend, currently trading around $4,239/ounce, up nearly 0.75% on the day and approaching the 0.618 Fibonacci resistance zone at $4,213 – $4,286, corresponding to the top of the short-term rising channel.
Trend Structure
• The medium-term uptrend remains solid, with a series of steadily rising candles and the MA50 maintaining a strong upward slope, reinforcing the bullish momentum.
• The uptrend channel remains effective, with prices currently hovering at the upper boundary of the channel, indicating that the buying momentum is too strong in the short term.
• The RSI remains above 70, indicating a technically overbought state, but there is no clear reversal signal yet; this usually signals a slight correction before the uptrend continues.
Key Technical Zones
• Resistance: 4.286 (0.786 Fib) and 4.378 (100% extension target).
• Support: 4.162 (0.5 Fib), 4.059 (old confluence – dynamic support), further 3.947 (balance).
Intraday Scenario
• The main trend remains bullish, but the risk of a short-term correction increases as prices approach the Fibonacci resistance zone.
• Day traders can wait for a buyback around $4,160 – $4,180, the confluence between the 0.5 Fib and the midline of the rising channel, where bottom-fishing buying is likely to emerge.
• The short-term target is $4,280 – $4,300/oz, corresponding to the upper boundary of the rising channel.
• Technical stop-loss should be placed below $4,050 (psychological support and short-term MA).
Overview
Speculative money still dominates, but the market is showing signs of needing a “technical breather” to consolidate the new price base. In the context of the Fed easing signals and escalating geopolitical tensions, the main uptrend of gold is not yet threatened, but short-term trading should prioritize the strategy of buying on corrections instead of chasing high prices.
SELL XAUUSD PRICE 4298 - 4296⚡️
↠↠ Stop Loss 4302
→Take Profit 1 4290
↨
→Take Profit 2 4284
BUY XAUUSD PRICE 4144 - 4146⚡️
↠↠ Stop Loss 4140
→Take Profit 1 4152
↨
→Take Profit 2 4158

XAUUSD: Detecting the Rising Wedge PatternOANDA:XAUUSD has experienced a significant rise recently, but we are currently seeing the formation of a Rising Wedge pattern, which often signals buyer exhaustion and a potential reversal toward a bearish trend. As the structure tightens near the top, the upward momentum starts to weaken, indicating that the buying pressure is fading.
A strong breakout below the trendline would confirm selling pressure and could signal a move toward the 4,130 level. However, until that happens, patience is key. It’s important to wait for a clear breakout with high volume to avoid false signals.
In summary, don’t rush into the market too early. Caution and waiting for a clear signal are essential to maximize your chances of success. Best of luck and happy trading!

XAUUSD Maintains Uptrend – Potential Retest AheadHello everyone,
Today, observing the H1 gold chart, I notice that buying pressure remains strong, but recent minor pullbacks indicate the market is seeking balance before the next move. XAUUSD continues a clear uptrend with higher highs and higher lows, alongside multiple Fair Value Gaps (FVGs) forming and filling. The Ichimoku cloud lies beneath the price, sloping upward, creating a solid buffer, while volume slightly narrows near peak candles, signalling a healthy retest before a breakout.
Key support zones around 4210–4205 and 4190–4185 could allow minor retracements to “clean” liquidity before challenging resistance at 4238–4245 and moving toward 4268–4275. Conversely, if these supports weaken, selling pressure could drag the price down to 4168–4160 before the uptrend resumes.
On the macro side, Fed rate-cut expectations remain the primary support for gold. Recent statements by Chair Powell were dovish, and the Beige Book shows slower growth in some regions, usually pulling yields down and softening the USD. US–China geopolitical tensions and the risk of a prolonged government shutdown also drive safe-haven demand, while central bank and ETF net purchases continue, reinforcing the trend through pullbacks. Positive USD/yield data may only trigger technical retracements before the broader trend persists.
What do you think — will XAUUSD retest successfully or undergo a deeper pullback before breaking higher?
Gold Still Running Hot — No Real Pullback YetPrice exploded out of the 15m FVG during Thursday’s Asian session and hasn’t looked back. Took a long right off that 8PM impulsive candle, scaling in as we broke back above the Previous Daily High.
Now we’re holding steady above 4345 — the midpoint of the Asian range looks like short-term support. If bulls defend this level, we could see continuation toward 4380–4400.
Friday bias: Bullish, unless 4340 gives out.
No clean pullback = no reason to force entries. Let the market prove it.
#GoldFutures #MGC #ICTConcepts #NOFOMO #DayTrading

GOLD (XAU/USD) – FINAL GRAND CYCLE ANALYSIS🟡 GOLD (XAU/USD) – FINAL GRAND CYCLE ANALYSIS
"The Rise of Real Money in a Failing Fiat World"
Elliott Waves | Fibonacci | Smart Money | Macro Fundamentals | Market Structure
📆 Date: October 12, 2025
📈 Current Price: ~$4,017/oz
🕰️ Timeframe: 1950s – 2060+
🔍 Focus: Multi-decade forecast grounded in wave theory and fundamental macro shifts
🌐 SUPER CYCLE STRUCTURE – GOLD'S MONETARY EVOLUTION
🔵 Wave I (1971–1980): The Rebirth of Gold
Gold surged from ~$35 to ~$850 after the collapse of the Bretton Woods system.
Nixon ended USD-to-gold convertibility, exposing the world to pure fiat for the first time.
Geopolitical shocks like the OPEC oil embargo and soaring inflation shattered trust in paper money.
Gold reasserted itself as a monetary anchor , not just a commodity.
🔴 Wave II (1980–1999): The Great Rejection
A 19-year bear market saw gold bleed down to ~$250.
Volcker’s rate hikes tamed inflation; fiat regained trust temporarily.
The dollar surged, stocks soared, and central banks sold gold reserves.
This corrective wave reflected confidence in debt-based growth and fiat stability — a long, deceptive calm.
🟢 Wave III (1999–~2045?): The Real Money Renaissance
This is the main secular bull market wave , subdivided into five impulsive macro waves.
Gold is now in Wave iii of III — the most explosive, powerful phase — and will likely reprice in a way that reflects systemic risk, not just inflation.
📈 MACRO & MICRO STRUCTURE – CURRENT WAVE BREAKDOWN
🟢 Macro Wave I (1999–2011): The First Awakening
Gold rose from $250 to ~$1,920.
Triggered by the dot-com crash, 9/11, 2008 crisis, and early QE programs.
This was the smart money accumulation phase , when institutions quietly began hedging systemic risk.
🔴 Macro Wave II (2011–2015): The Disbelief Phase
Gold corrected 45% to ~$1,050.
Fed tapering, rising dollar, and low CPI caused a temporary return to confidence in fiat.
This reset investor sentiment and created institutional demand zones.
🟢 Macro Wave III (2015–~2026): The Fiat Reckoning (Now Unfolding)
Subdivided into five micro-waves:
Wave i (2015–2020): Broke out of 4-year base; fueled by Brexit, rate cuts, and China accumulation.
Wave ii (2020–2022): ABC pullback post-COVID; reloaded from key SMC demand zones.
Wave iii (2022–Now): We're here. Most vertical and extended move yet. Price currently at ~$4,000; next targets are $6,552, $22,744, and $78,940 , all aligning with Fibonacci extensions (2.618, 3.618, 4.618).
Wave iv (projected 2026–2031): Likely major correction after parabolic move.
Wave v (projected 2031–2045): Final blow-off top in Supercycle III.
🧠 FUNDAMENTAL DRIVERS – BY WAVE
🔹 Wave I Fundamentals (1999–2011):
Post-dot-com capital rotation.
9/11 and geopolitical tension.
2008 GFC and collapse of banking trust.
Introduction of QE and zero interest rates.
Gold ETFs (like GLD) launched, enabling broader exposure.
🔸 Wave II Fundamentals (2011–2015):
QE fatigue: “It didn’t cause inflation.”
USD strength.
Confidence returned to stocks.
Retail dumped gold — but central banks quietly accumulated .
🔹 Wave III Fundamentals (2015–2026):
$30+ trillion in global QE during COVID.
Global real rates deeply negative.
Energy crisis and supply chain fragility.
War-driven risk premiums (Russia-Ukraine, Middle East, China-Taiwan).
De-dollarization: BRICS accumulation, gold in cross-border settlements.
Institutional shift toward real assets as fiat credibility wanes.
🔸 Wave IV (Projected 2026–2031):
A likely correction tied to:
CBDC adoption and capital controls.
Temporary resurgence in tech or USD-based confidence.
Reforms that appear to restore fiscal sanity.
But this will be the last opportunity to enter before the endgame move.
🔹 Wave V (2031–2045+):
Fiat collapse becomes mainstream.
USD potentially dethroned.
Gold-backed CBDCs or DeFi hybrids launched.
Mass exodus from fiat into real money.
Final revaluation of gold to reflect not inflation, but lost confidence in the entire financial system.
📐 FIBONACCI EXTENSIONS – PRICE TARGETS WITH WAVE ALIGNMENT
🟢 Wave I topped at 1.618 Fib ($1,887) — aligned with 2011 ATH.
🟢 Wave III (in progress):
2.618 Fib: $6,552 (expected peak of wave iii).
3.618 Fib: $22,744 (potential macro Wave III top).
4.618 Fib: $78,940 (if confidence fully collapses).
🟢 Wave V (projected): May extend toward $100,000–$250,000+ under systemic collapse or gold-backed reset conditions.
All targets line up perfectly with logarithmic channel projections , Elliott wave extensions , and long-term order flow structure .
🧠 SMART MONEY CONCEPTS & PRICE ACTION CONFIRMATION
✅ BoS (Breaks of Structure) at each wave change validated bullish continuation (2016, 2020, 2023).
✅ Order Blocks and liquidity grabs created institutional entry zones — especially at 2018–2019 lows and 2022 dips.
✅ Demand zones respected across key Fibonacci retracements (0.382 and 0.618).
✅ Current wave iii is a textbook price discovery phase with minimal resistance.
This entire market structure is institutionally driven , not retail fueled — a true stealth bull.
📊 MARKET CYCLE PSYCHOLOGY OVERLAY
1999–2004: Disbelief – “Gold is dead.”
2005–2011: Awareness – “Gold might work.”
2011–2015: Denial – “It’s just a bubble.”
2016–2020: Hope – “Maybe gold’s not done.”
2022–2026: Euphoria – “Gold will never go down.”
2026–2033: Fear → Capitulation – Wave IV
2033–2045: Mania – “Gold to the moon!” — Wave V blow-off.
🚨 FINAL SYNTHESIS
We are witnessing the greatest revaluation of monetary value in modern history . Gold is transitioning from:
A hedge against inflation → to
A hedge against central banks → to
A hedge against the entire fiat system.
📌 Final Position Summary:
🔄 Current Location: Wave iii of III of Supercycle III
🎯 Immediate Target: $6,552 (2.618 Fib)
💡 Medium-Term: $22,744 (3.618 Fib)
🔥 Parabolic Scenario: $78,940 (4.618 Fib)
💀 Systemic Reset Target: $100,000–$250,000+
🧠 Conclusion:
This is not just a chart. This is a map of the collapse of fiat trust and the ascendance of sound money . Gold is no longer just an asset — it’s insurance on the system.
🌊 "Those who understand the waves will ride them. Those who don’t will be swallowed by the tide." - FIBCOS
📘 Disclaimer: This is a structural, educational market outlook. Not financial advice. Please do your own due diligence and risk management.
#XAUUSD #Gold #GoldAnalysis #ElliottWave #Fibonacci #SmartMoneyConcepts #PriceAction #TechnicalAnalysis #MarketStructure #Commodities #InflationHedge #MacroEconomics #CentralBanks #BRICS #MonetaryReset

Gold Broke The ceiling of the Bullish Flag to claim $4K Pivot The price of gold has consecutively surge in price for the past 2 months to break the ceiling of the bullish flag pattern formed based on the 4-hour chart.
The asset has gained 35% so far earning almost $1200 prior the surge. With investors sentiment shifting to the asset Gold might claim the 4k resistant this last quarter.
With the RSI at 83, the asset is currently overbought with possible retracement to the $4200 Zone before the next legged up.

GOLDI think this chart is bullish to 6400$ and complete TVC:GOLD 2-leg target.
Best support for pullback 1900$ to 900$ that i think not touch this supports but this rally is very strange.
Please control your money management.

Gold traders - White House to speak on China shortlyGold’s impressive rally has been powered by a mix of rate-cut expectations, political risk, central bank buying, and dollar weakness.
Gold traders’ focus this week has been on the escalating U.S.–China trade tensions though.
Markets are standing by for a statement from the White House, expected within the hour.
We’ll post updates here once the White House statement is released and markets begin to react.

GOLD → The aggressive trend continues. Focus on 4240FX:XAUUSD continues to break records, testing the $4,240 level amid a weakening dollar and sustained demand for safe-haven assets. The risks of a correction are growing as economic news releases approach.
Key supporting factors: Statements by US officials about China's “seizure of supply chains” and retaliatory measures are keeping markets on edge. US shutdown: The government shutdown is costing the economy $15 billion a week, increasing uncertainty. The probability of a rate cut in October and December is ~95%, which is putting pressure on the dollar. However, statements by Fed officials may adjust market expectations.
The bullish trend for gold remains unchanged. Any corrections will be seen as a buying opportunity. Key benchmarks are the development of the trade conflict and negotiations on the resumption of the US government.
Support levels: 4212, 4203
Resistance levels: 4234, 4235, 4250
Within the uptrend, it is worth waiting for a correction to support in order to open positions more profitably. There are no reasons for a trend reversal, and the fundamental background is bullish. We expect a retest of support before growth. However, a breakout of the 4234-4239 zone could trigger further growth!
Best regards, R. Linda!

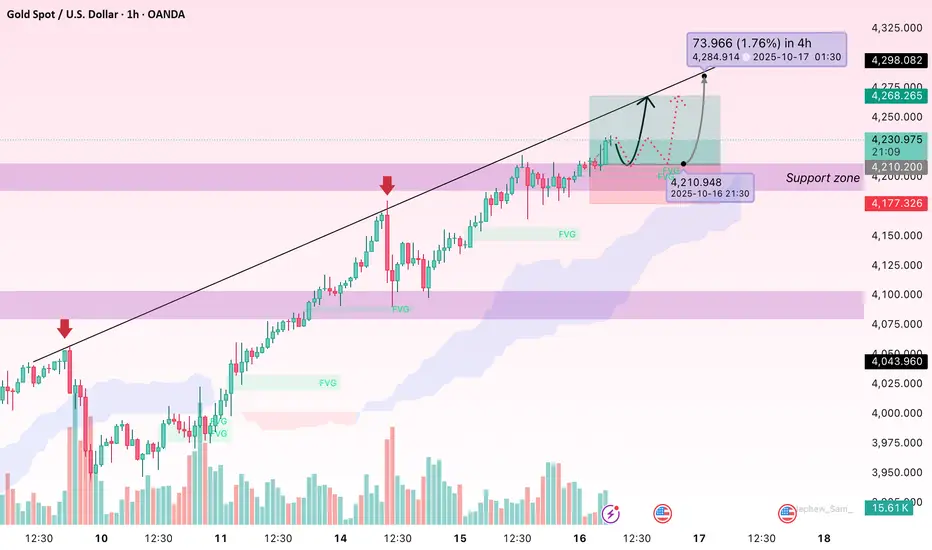
4300 is just the beginning, it is expected to reach 4500Affected by the continued impact of the US government shutdown, gold in the US market rose strongly. After hitting a high of 4292, it quickly fell back and rebounded, setting a new historical high of 4298. But judging from the current trend, this is obviously not the peak of gold prices. If the short-term rise continues, it is expected to test the pressure of the 4,300 integer mark.
As the short-term trend line is broken, the previous resistance is gradually transformed into support. Pay attention to the short-term support range of 4275-4260 below. If this range can be held, gold will set a new high.
OANDA:XAUUSD

100% UPSIDE Precious Metals Playbook — Gold, Silver & Miners ETF🏛️ Precious Metals Playbook — Gold, Silver & Miners ETFs
🔑 Executive Summary
• We combine the 2026 parabolic metals thesis gold/silver/platinum with leveraged ETF implementation to target triple-digit portfolio upside under view that gold’s bull run continues into 2026 $5,500–$6,500/oz.
• Miners’ torque has been massive in 2025: GDX ~+123% YTD while gold itself is up ~51% YTD; levered miners e.g., NUGT, JNUG, GDXU show ~360–700%+ YTD — confirming high beta to metal.
• Implementation below caps any single ETF at 10% within 10–20% limit and keeps ≥50% of the book in 2×–3× products for upside torque while diversifying across metal vs. miners and gold vs. silver.
________________________________________
🌍 Market View Condensed
• Gold: Momentum + macro easing bias, softer USD, central-bank demand support the “second-leg melt-up” case into 2026; miners’ margin torque can deliver 2–3× metal beta.
• Silver: Structural deficits + PV/EV/datacenter demand have super-charged silver miners in 2025.
________________________________________
📊 2025 YTD Scorecard Key ETFs
• Gold metal (unlevered): GLD +50.9% YTD.
• Gold miners (unlevered): GDX ~+123% YTD.
• Silver miners (unlevered): SIL ~+137% YTD.
• Leveraged miners:
o NUGT (2× miners) ~+361% YTD; JNUG (2× juniors) ~+394% YTD.
o GDXU (3× miners ETN) ~+706% YTD (top performer cohort of 2025).
• Leveraged gold & silver metals: UGL (2× gold) ~+125% YTD; DGP (2× gold ETN) ~+123% YTD; AGQ (2× silver) ~+159% YTD.
________________________________________
🧩 Portfolio Construction Target book: $100,000
Constraints honored: max 10% per ETF, ≥50% allocation to 2×/3× ETFs.
🎯 Target Allocation 60% leveraged / 40% unlevered
Leveraged — 60% total
• 10% GDXU 3× gold miners ETN
• 10% NUGT 2× gold miners
• 10% JNUG 2× junior gold miners
• 10% AGQ 2× silver
• 10% UGL 2× gold
• 10% DGP 2× gold ETN
Rationale: diversify torque across miners vs. metals, 2× vs. 3×, and gold vs. silver to avoid single-product concentration risk.
Unlevered — 40% total
• 10% GDX VanEck Gold Miners
• 10% GLD SPDR Gold Trust
• 10% SIL Global X Silver Miners
• 10% SLV (or) IAU silver or gold bullion, choose per preference
Rationale: ballast and liquidity; preserves exposure if volatility in levered products forces risk-off.
Dollar mapping (@ $100k):
• Each 10% line = $10,000 notional; 10 tickers → $100,000 fully invested.
________________________________________
📈 Scenario Analysis Hypothetical, path-dependent
Gold advances toward $5,500–$6,500 by 2026. We translate that into rough upside bands using historical betas and allowing for daily-reset drag on leveraged products.
• Base case +100% portfolio:
o Gold +40–60% from here; 2× gold funds net ~+70–110% conservative for compounding/decay.
o GDX sensitivity ~2–3× metal → ~+80–150%; 2× miners ~+160–300%; 3× miners can overshoot in trending tapes.
o With 60% in levered assets and 40% in unlevered miners/metals, blended outcome can land near ~+100% if trends persist and volatility stays manageable.
• Stretch case +200% portfolio:
o If the “second-leg melt-up” plays out momentum + flows + central-bank bid and miners’ margins expand, levered miners dominate returns similar to 2025 YTD pattern.
o Portfolio hits ~+200% if miners continue to over-beta the metal and 3× exposure compounds favorably no major whipsaws.
Risk reality check: Leveraged ETFs reset daily; high volatility or choppy reversals can erode returns even if the long-term trend is up. Position sizing 10% lines and diversification across instruments help mitigate single-name decay risk.
________________________________________
🧭 Implementation Notes
• Execution: stage entries over several days reduce gap/vol risk, prioritize liquid hours; use stop-loss/hedge bands on the 3× sleeve.
• Rebalancing: monthly bands ±3–5% per line to defend the 60/40 torque mix.
• Risk budget: expect 3× ETN drawdowns >60% in sharp pullbacks; keep dry powder OR pre-define risk limits.
________________________________________
🗂️ Product Appendix — Quick Stats
• GDXU (3× miners ETN): ~+706% YTD; ER ~0.95%.
• NUGT (2× miners): ~+361% YTD.
• JNUG (2× junior miners): ~+394% YTD.
• AGQ (2× silver): ~+159% YTD.
• UGL (2× gold): ~+125% YTD.
• DGP (2× gold ETN): ~+123% YTD.
• GDX (miners): ~+123% YTD.
• SIL (silver miners): ~+137% YTD.
• GLD (gold): ~+50.9% YTD.
________________________________________
⚠️ Disclosures & Risks
Leveraged ETFs/ETNs are short-term trading tools with daily reset/compounding; they can significantly underperform their leverage multiple over holding periods with high volatility or mean-reversion. ETNs (e.g., GDXU, DGP) also carry issuer credit risk. This memo is informational, not investment advice; consider your risk tolerance, liquidity needs, and tax/ETN suitability.

XAUUSD Builds Upward PressureGold continues to trade within a strong upward trajectory,showing consistent momentum and firm buyer engagement.The market structure indicates ongoing accumulation,with price maintaining stability after minor corrective movements.Buy-side activity remains dominant,reflecting confidence among institutional participants as the metal sustains its trend within an orderly channel.While short-term pullbacks may occur for liquidity rebalancing,the broader outlook remains decisively bullish as long as momentum persists and demand continues to support higher valuations.

GOLD NEXT TARGET XAUSDGOLD NEXT TARGET XAUSD as per trend and Gann value. market will reach 3850 target 2 before July 2025. Target will ready to achieve in a week seems. lets wait for market move.

Platinum 10 years accumulation 2 000 USD Overview of Catalysts
Here’s a detailed look at the top 10 key catalysts influencing platinum prices—and how they stack up on a 0–10 impact scale 🎯.
1. Supply Deficits (Mining Shortfalls) ⛏️
Trend: Persistent structural deficits—the largest since 2013—with a projected deficit of \~598 koz in 2024.
Drivers: Declining output in South Africa and Russia, underinvestment, and aging mines.
Impact Score: 10/10 – Direct upward pressure on price.
2. Industrial Demand & Green-Energy Growth 🏭
Trend: Industrial consumption is booming, with strong growth in sectors like wind turbines, glass, and electronics.
Support: This broad demand fuels a large part of the supply deficit, and goes well beyond automotive use.
Impact Score: 9/10 – Strong structural support.
3. Auto Catalyst Substitution (Pd → Pt) 🔄
Trend: Cost-effective substitution as platinum approaches price parity with palladium; significant volume was substituted in 2023, with more projected for 2024.
Significance: Boosts automotive demand in an area previously dominated by palladium.
Impact Score: 8/10.
4. Electric Vehicle Adoption (EVs) ⚡
Trend: EVs don’t use platinum in catalytic converters, which is a structural hit to demand as EV growth continues.
Significance: Long-term downside pressure.
Impact Score: 7/10.
5. Hydrogen Fuel Cell Demand 💧
Trend: Hydrogen vehicles use platinum, with projected demand growth toward 2030.
Limitations: Growth remains slower than battery EVs.
Impact Score: 6/10.
6. Recycling Constraints 🔄
Trend: Recycling, which provides about a quarter of supply, is falling due to fewer end-of-life vehicles and glass, reducing the supply buffer.
Market Effect: This amplifies supply tightness.
Impact Score: 6/10.
7. Chinese Emission Policies 🏭
Trend: China’s tightening emissions regulations are supporting demand, with end uses well protected against a slowdown.
Importance: China is the largest platinum user; policy gives stability.
Impact Score: 7/10.
8. Jewellery & Investment Trends 💍
Trend: Jewellery demand remains steady, and investment demand is rising.
Note: This is a smaller demand segment, but it is supportive.
Impact Score: 5/10.
9. Macroeconomic & Auto Production Outlook 📉
Trend: Weak global auto production is lowering platinum use, but recovery in auto could lift demand.
Aftermath: Economic rebound could support prices.
Impact Score:** 5/10.
10. Speculative Sentiment & Positioning 📈
Trend: Inventories are depleted; investors are waiting for a breakout.
Tipping Point: A price surge could spark momentum-driven demand.
Impact Score:** 4/10.
| Rank | Catalyst | Score (/10) |
| ---- | ---------------------------------- | ----------- |
| 1 | Supply Deficit | 10 |
| 2 | Industrial / Green-Energy Demand | 9 |
| 3 | Auto Catalyst Pd → Pt Substitution | 8 |
| 4 | EV Adoption (Negative Impact) | 7 |
| 5 | Chinese Emission Policies | 7 |
| 6 | Hydrogen Fuel Cell Growth | 6 |
| 7 | Recycling Constraints | 6 |
| 8 | Jewellery & Investment Demand | 5 |
| 9 | Macro Slowdowns / Auto Production | 5 |
| 10 | Speculative Positioning | 4 |
📌 Key Insights & Outlook
* Tight supply and diversified demand—especially from green energy and industrial sectors—are the strongest bullish forces for platinum.
* Auto-driven substitution offers further upside, while EV growth and recycling limitations act as constraints.
* Chinese regulations add resilience; hydrogen offers potential if growth accelerates.
* Jewellery and investment flows remain minor but supportive.
* Much depends on auto sector recovery and investor psychology—momentum effects could amplify gains if technical levels break.
🔮 Final Take
Platinum remains positioned for medium-term strength, thanks to severe supply tightness and robust non-auto demand drivers. For investors, key areas to watch are further deficits, industrial trends, and catalytic substitution. Be mindful of potential headwinds from EV adoption and macroeconomic softness, but the structural case remains compelling.

GOLD: Local Bullish Bias! Long!
My dear friends,
Today we will analyse GOLD together☺️
The market is at an inflection zone and price has now reached an area around 4,260.94 where previous reversals or breakouts have occurred.And a price reaction that we are seeing on multiple timeframes here could signal the next move up so we can enter on confirmation, and target the next key level of 4,285.09.Stop-loss is recommended beyond the inflection zone.
❤️Sending you lots of Love and Hugs❤️

EUR/USD | EURUSD Breakdown Alert: Could It Drop Toward 1.1565?By analyzing the EUR/USD chart on the 2-hour timeframe, we can see that the price is currently trading around 1.162 .
If it manages to hold below the 1.164 level, we could expect further downside movement from the Euro.
The next potential bearish targets are 1.160, 1.158, and 1.1565 .
Please support me with your likes and comments to motivate me to share more analysis with you and share your opinion about the possible trend of this chart with me !
Best Regards , Arman Shaban
