GOLD SHORT FROM ATH 4000$
✅XAUUSD is getting closer to the 4,000$ epic supply level and will soon be forming a potential all-time-high rejection. Liquidity above will be cleared, and Smart Money shows bearish intent toward lower rebalancing levels near 3,920$.
—————————
Entry: 3,982$
Stop Loss: 4,010$
Take Profit: 3,920$
Time Frame: 4H
—————————
SHORT🔥
✅Like and subscribe to never miss a new idea!✅
Metals

Potential GOLD Correction Phase IncomingGold FOREXCOM:XAUUSD has been making new record highs almost every day for the past 30 days.
It could come to a halt this week before maybe continuing higher...
WHY? you may ask,
Reason 1:
When Price fails to follow through on Expansions, there is a weakning i momentum and that usually signals corrections/full on reversals, however in this case, we cannot expect a full on reversal seeing as gold is constantly in demand due to the sever decline in investor confidence in basically, every currency out there right now.
In the terms of a correction however, there are inefficiencies on the 4H chart that price can seek to reprice to and then continue higher.
Case in point here:
Reason 2: The short term bearish bias is also backed by a mean reversion wirth silver forming intraday during tuesday's regular trading hours
There are much more things I could talk about, but for now, I want to keep it as clear as possible,
The bias ia Bullish Long term, small correction to the downside and another expansion higher after the H4 gap has been filled.
Follow for more.

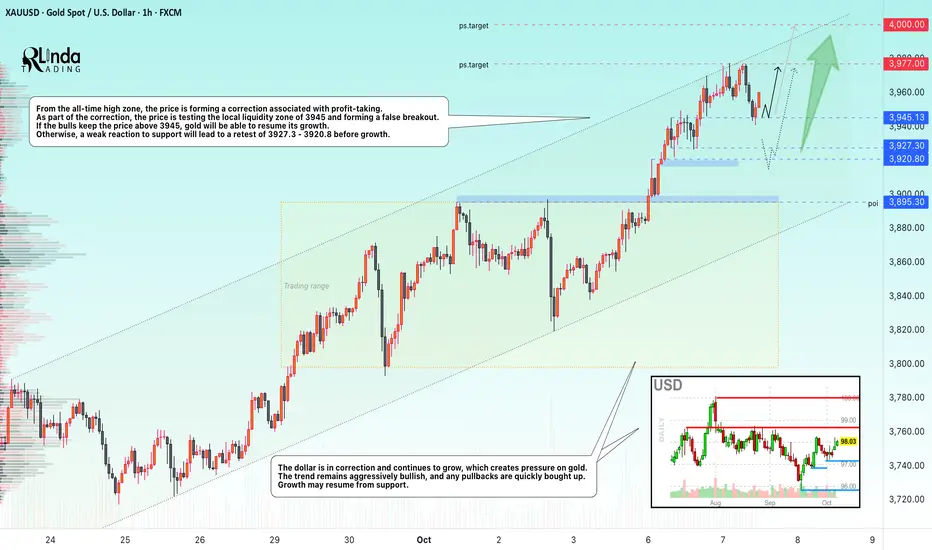
GOLD → The correction will trigger growth to $4,000.FX:XAUUSD hit a new record high of nearly $3,977 and entered a correction phase to build up potential before further growth. Despite the local strengthening of the dollar, the upward trend continues thanks to a combination of macroeconomic and geopolitical factors.
Key supporting factors: Ongoing US government shutdown: The Democrats' fifth unsuccessful attempt to resolve the issue increases uncertainty. Markets expect two interest rate cuts before the end of the year.
China has been increasing its reserves for the 11th consecutive month, and global central banks bought +15 tons in August.
No bearish triggers: Any correction is seen as a buying opportunity.
Gold maintains its upward momentum. Breaking through $4,000 seems a matter of time if current drivers remain in place. Key risks are an unexpected resolution to the shutdown or hawkish signals from the Fed.
Resistance levels: 3977, 4000
Support levels: 3945, 3927, 3920
Technically, a false breakdown of support could lead to continued growth. A retest of 3945 is possible; a weak reaction could trigger a deeper correction, for example to 3927, before further growth.
Sincerely, R. Linda!
Gold Watching 3,850 Support as Dollar Weakens on UsGovt ShutdownHey Traders, in today’s trading session we are monitoring XAUUSD for a potential buying opportunity around the 3,850 zone. Gold is trading in an uptrend and currently in a correction phase, with price approaching this important support/resistance level.
Structure: Gold remains within an overall bullish structure and is also trading inside an ascending channel.
Key level in focus: 3,850 — a key support zone where buyers may look to step in.
Upside target: 3,930 — aligning with the channel resistance and potential area for bullish continuation.
Fundamentals: The ongoing US government shutdown is adding bearish pressure on the US Dollar. Given Gold’s negative correlation with DXY, this environment continues to support the bullish bias for Gold.
Trade safe,
Joe.

AUDUSD Eyes 0.65900 as Gold Nears Record HighHey Traders, in the coming week we are monitoring AUDUSD for a potential buying opportunity around the 0.65900 zone. AUDUSD remains in an uptrend and is currently in a correction phase, with price moving toward this key support/resistance level.
Structure: The broader bias is bullish, with price retracing toward trend support.
Key level in focus: 0.65900 — an important area where buyers may look to re-enter.
Fundamentals: Gold continues to rise and is nearing a fresh ATH, supported by a bearish US Dollar bias. Given the positive correlation between AUDUSD and Gold, further upside on the pair remains likely.
Next move: Monitoring price reaction at 0.65900 to assess whether the trend resumes higher.
Trade safe,
Joe.

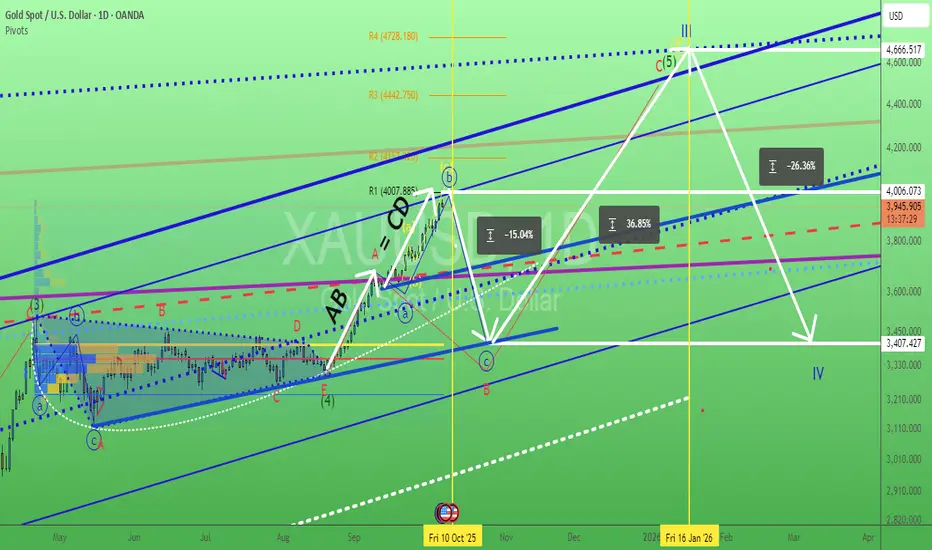
Gold. Waiting NFP trigger? 7/Oct/25XAUUSD nonstop surging need some profit taking? what event trigger the heavy sell off? Coming this Friday delayed NFP? "time / cycle - wise" Look like "some cash out" not just from Gold but also equities market?. 4007.885 are the confluence zone of 1) Monthly R1 2) Parallel Line Resistance 3) AB = CD price volume. and many...P/s all impulsive wave consist of abc subwaves not 1,2,3,4,5 waves
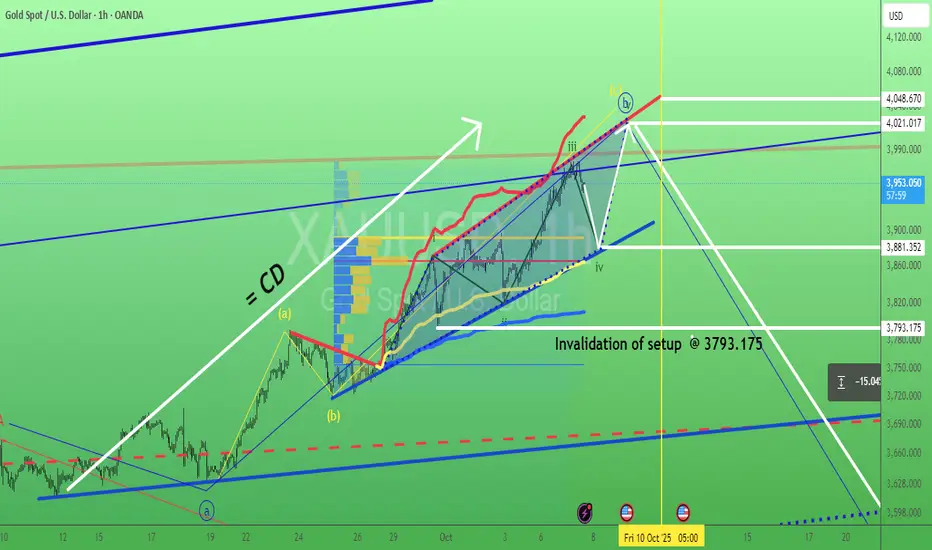
Gold intraday overview. 7/Oct/25XAUUSD short term swing setup. A rising wedge/ Expanding Ending Diagonal pattern. 3880 +/- is confluence zone of 1) VWAP (yellow MA ) support 2) Volume Profile's ( POC ) Horizontal Red Line.
What will be the outlook for gold against the euro?My take on the path ahead for an ounce of gold against the euro is that we should follow the price growth to 3630 euros per ounce of gold.
Good luck
MJ.REZAEI

GOLD: Target Is Down! Short!
My dear friends,
Today we will analyse GOLD together☺️
The in-trend continuation seems likely as the current long-term trend appears to be strong, and price is holding below a key level of 3,976.35 So a bearish continuation seems plausible, targeting the next low. We should enter on confirmation, and place a stop-loss beyond the recent swing level.
❤️Sending you lots of Love and Hugs❤️
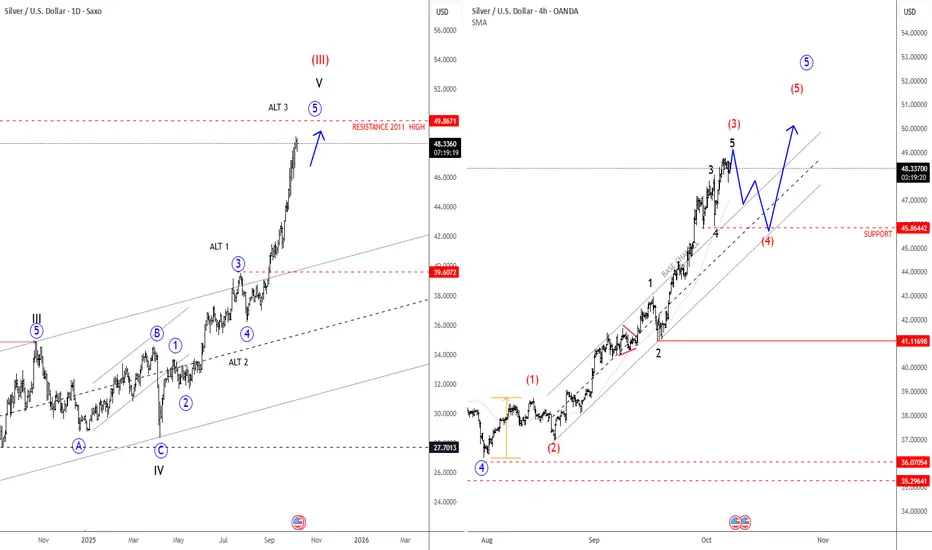
Silver Is Extending Impulsively Higher; All-Time Highs SoonSilver Is Extending Impulsively Higher, which can push the price into all-time highs from a technical point of view and by Elliott wave model.
Silver is on the rise and has been outperforming gold quite a lot over the last week, and it looks like an extended leg up is still in progress; seems like wave three of an extended impulse, therefore more gains are possible after next three-leg retracement. Based on the 4-hour chart, there is a chance that price goes towards 50usd, but there can be some new pullback first. Ideally red wave (4) could stabilize near 45.86. Only a sharp impulse down closer to 43 level will be an indication that higher degree wave four has started.
Higher Time frame charts show an ongoing bull cycle that is now targeting the high from April 2011, which could be the next major level and a potential area for a new retracement, maybe sometime in 2026.
Gold Price Analysis – Bullish Above $3910Gold price is currently showing a mild correction after testing the upper trendline of the ascending channel. The chart suggests a possible short-term pullback toward the $3925–$3913 zone, which aligns with the 0.382–0.618 Fibonacci retracement levels. As long as price holds above $3910, the bullish structure remains intact, and a rebound toward $3976 and possibly $4016 can be expected. A break below $3900 would weaken bullish momentum and could extend the decline toward $3875 support.
Support: $3925 / $3910 / $3875
Resistance: $3976 / $4016
Bias: Bullish above $3910; correction possible before next leg up.
Note
Please risk management in trading is a Key so use your money accordingly. If you like the idea then please like and boost. Thank you and Good Luck!

SILVER: Will Go Up! Long!
My dear friends,
Today we will analyse SILVER together☺️
The price is near a wide key level
and the pair is approaching a significant decision level of 48.448 Therefore, a strong bullish reaction here could determine the next move up.We will watch for a confirmation candle, and then target the next key level of 48.655.Recommend Stop-loss is beyond the current level.
❤️Sending you lots of Love and Hugs❤️

Buyers Hold Momentum Above SupportGold continues to trade in a bullish structure, forming higher highs after a clean rebound from the support zone. A short term pullback provides a potential swing buy opportunity targeting higher resistance levels as buyers remain active above intraday support.
Key Levels:
Buy Entry: 3960
Take Profit: 3980
Stop Loss: 3945
Reasoning:
Technically, price action shows a sustained uptrend, supported by rising structure and consistent bullish candles. The 1H chart confirms momentum continuation after retesting previous resistance turned support.
Fundamentally, weaker U.S. dollar sentiment and stable Treasury yields continue to support gold demand as investors look for safety ahead of key U.S. data releases.
Disclaimer:
This analysis is for educational purposes only and not financial advice. Always manage risk and follow your own trading plan before executing any trade.

GOLD – New All-Time High, Bullish Above 3,976 Toward 4,020GOLD – Overview
Gold recorded a new all-time high (ATH) and continues to show strong bullish momentum.
The metal remains supported by expectations of further Fed rate cuts and safe-haven demand, but short-term corrections are possible if price fails to hold above key pivot levels.
Technical Outlook
As long as price trades above 3,976, the bullish trend remains intact, with potential to extend toward 4,008 → 4,020.
A 1H or 15M close below 3,976 would indicate the start of a bearish correction, targeting 3,957 → 3,944.
Pivot: 3,976
Resistance: 4,008 – 4,020
Support: 3,960 – 3,944 – 3,920

Zone 4: Where Gold’s Next Move Will Be DecidedTVC:GOLD continues its impressive bullish structure, climbing cleanly through all prior resistance zones. Each expansion phase has been measured and consistent - alternating between ~1.7% impulsive legs and ~4.4% corrective expansions, forming a rhythmic price behavior that reflects controlled institutional flow rather than retail volatility.
Price is now operating within Zone 4, approaching the $3,987–$3,990 resistance target. This level aligns with the upper boundary of the current expansion range, making it a critical decision point.
If price follows the same historical rhythm observed in September, there’s a high probability we’ll see a tap of $3,987, followed by a retracement toward $3,914 (zone support) before any continuation attempt.
However, it's important to note that we’re currently in a blackout phase, with no tangible U.S. economic data releases to fuel directional conviction. This means momentum here is largely technically driven, and could mark the final phase for gold before a broader trend shift.
Key Note:
Primary Bias: Bullish continuation remains valid while above $3,900 support. I expect price to hit 3987 and then pullback to 3914 where possible re-accumulation repeats.
Volume remains steady but not euphoric - signaling disciplined accumulation rather than late FOMO.
Conclusion:
TVC:GOLD structure remains intact, but the market is entering a decision zone. The next move from here within 24-48 hours window, will likely determine whether we witness a final extension or the start of a deeper correction.
💭 Share your thoughts below if following this trade.

Gold settles near record high on support of China's purchases Gold prices are hovering around $3,960 an ounce, near a record high reached earlier in the session, supported by economic uncertainty and China's central bank's growing gold holdings for the eleventh consecutive month in September. Gold is up 51% so far this year , supported by resilient safe-haven demand, and expectations of #Federal_Reserve_easing.
Technically, the metal fell slightly in a downward corrective movement at the beginning of today's trading, after holding above the $3940 levels, so we expect the downward correction to stop around the $3940 per ounce level, and then rebound again and target the resistance levels of $3996.75 per ounce

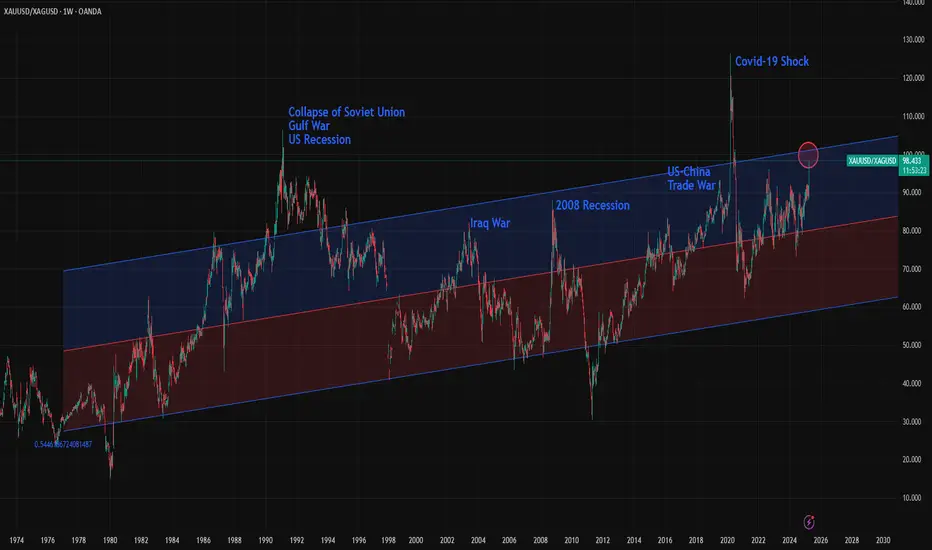
Gold/Silver Ratio Nears 100: What Does It Mean Historically?The Gold/Silver ratio is on the verge of reaching 100, an extremely rare level seen only at key historical turning points. The chart includes a 2,500-week linear regression channel, which shows that over the very long term, the ratio has been steadily rising, though at a slow pace. Occasionally, the ratio touches the 1.5 standard deviation line, and in rare, game-changing events, and sometimes it even breaks beyond that level.
Here are some of the key historical turning points marked by major spikes in the Gold/Silver ratio:
1- Early 1990s: The collapse of the Soviet Union, the Gulf War, and a U.S. recession pushed the ratio to 106. It remained above 1.5 standard deviations for more than two years.
2- 2002: Following the dot-com bubble burst, the 9/11 attacks, and the Iraq War, the ratio climbed to 82.6, nearing the 1.5 deviation line.
3- 2008 Recession: The global financial crisis triggered by the collapse of Lehman Brothers sent the ratio to 88.50. This spike sparked a major rally in both gold and silver, lasting until 2011 when the ratio reached one of its deepest bottoms.
4- 2019: The U.S.–China trade war under Trump’s first term pushed the ratio to 93, again nearing the 1.5 deviation threshold.
5- 2020 (COVID-19 Shock): The pandemic caused one of the biggest disruptions in modern economic history. Although relatively short-lived, its impacts were severe. The Gold/Silver ratio surged to 126 , marking the highest level in modern records, possibly the highest in all of history.
6- 2024–2025 (Global Trade War?): With the U.S. imposing major tariffs on key global trading partners, this could be another historic inflection point. The full impact is still unfolding, but risks of a serious global slowdown, or even a deep recession are rising. A full-scale trade war remains a real possibility.
Now, the Gold/Silver ratio is approaching 100 and nearing the 1.5 standard deviation line. It remains unclear whether this represents a powerful pair trade opportunity—"sell gold, buy silver"—or a structural breakout where the ratio stays elevated for an extended period. In either case market is showing that this is one of the rare turning point of global economy.
Altcoins are heading toward a parabolic phase.Same setup, same chart, different story, different market
Silver laid the foundation for a parabolic run after breaking through a 3.8-year major resistance level.
The altcoin market cap TOTAL3 similarly broke through a 3.8-year major resistance level.
NASDAQ:ALTS \ TVC:SILVER
Altseason 🔃💹

Gold - 4H Forecast ☀️ GOLD – 4H Forecast ☀️
Alright gold gang, let’s talk business — XAU/USD is setting up for something clean 👇
🧠 Bias :
Still bullish overall, but we’re chilling in premium territory, and this structure screams “pullback incoming.” Expect a retrace before the next rocket launch 🚀.
🧩 Technical Breakdown:
Price just printed a Buy-Side Liquidity (BSL) grab up top — textbook liquidity sweep before a potential correction.
We’ve got a strong impulsive leg pushing off a 4H + Daily demand confluence around $3,850–$3,880.
The 71% fib retracement zone aligns beautifully with that 4H demand, creating a prime reload area if price dips.
The volume profile gap (POI) also hints at untested liquidity sitting below current highs.
🎯 Trade Idea:
Entry Zone: $3,880–$3,860 (4H & Daily demand overlap)
Target 1: $3,970 (current high retest)
Target 2: $4,010+ (continuation into new impulse)
Invalidation: Below $3,830 (break of structure + demand failure)
⚙️ Risk Management:
Keep risk tight — 1%–1.5% max. If we get a reaction at the 71% level, partials at $3,950 are smart to secure profits before the next leg.
💬 Summary :
Gold just ran buy-side liquidity and looks ready to dip into discount before ripping higher again. If we get a clean 4H or 1H confirmation in the demand, expect another bullish leg to unfold.

SILVER BEST PLACE TO SELL FROM|SHORT
SILVER SIGNAL
Trade Direction: short
Entry Level: 4,834.9
Target Level: 4,657.5
Stop Loss: 4,952.1
RISK PROFILE
Risk level: medium
Suggested risk: 1%
Timeframe: 9h
Disclosure: I am part of Trade Nation's Influencer program and receive a monthly fee for using their TradingView charts in my analysis.
✅LIKE AND COMMENT MY IDEAS✅

DeGRAM | GOLD formed bearish takeover📊 Technical Analysis
● XAU/USD is trading inside a rising channel, where price recently formed a bearish takeover near the upper boundary at 3,975, suggesting exhaustion of bullish momentum.
● The rejection aligns with resistance, hinting at a short-term retracement toward 3,927, with possible extension to 3,884 if selling pressure accelerates along the lower channel line.
💡 Fundamental Analysis
● Stronger U.S. dollar and rising Treasury yields ahead of Fed minutes are weighing on gold, as investors shift toward safer dollar assets.
✨ Summary
● Short bias below 3,975; targets at 3,927 and 3,884. Bearish reversal confirmed within the rising channel.
-------------------
Share your opinion in the comments and support the idea with a like. Thanks for your support!

XAU/USD Intraday Plan | Support & Resistance to WatchGold is pulling back after failing to clear resistance around 3970, showing the first signs of intraday exhaustion following the sharp rally. The bias remains bullish, but it’s healthy to see some correction after strong momentum.
The MA50 acts as the first line of dynamic support, aligning with the 3937 support level. Failure to hold above this zone may open the way for a test of lower reaction zones before fresh buying interest emerges.
A clear break above 3970 will likely invite momentum buyers and push price toward the 4000 and possibly 4020 resistance levels.
📌Key Levels to Watch
Resistance:
3970
4000
4020
Support:
3937
3909
3880
3820
🔎Fundamental Focus:
The ongoing U.S. government shutdown continues to delay key data and elevate risk sentiment. With uncertainty rising and liquidity thinning, gold is highly reactive to political headlines, leading to erratic intraday volatility. Safe-haven demand underpins dips, but sudden reversals remain possible.

XAUUSD NEXT POSSIBLE MOVEGold is facing resistance near a key supply zone where sellers are showing strength. If the price fails to break above this area and shows rejection, a bearish move can be expected.
Momentum is slowing, indicating that sellers may take control if the market stays below resistance.
Watch for clear bearish confirmation before entering the sell side.
