DeGRAM | GOLD formed bearish takeover📊 Technical Analysis
● XAU/USD is trading inside a rising channel, where price recently formed a bearish takeover near the upper boundary at 3,975, suggesting exhaustion of bullish momentum.
● The rejection aligns with resistance, hinting at a short-term retracement toward 3,927, with possible extension to 3,884 if selling pressure accelerates along the lower channel line.
💡 Fundamental Analysis
● Stronger U.S. dollar and rising Treasury yields ahead of Fed minutes are weighing on gold, as investors shift toward safer dollar assets.
✨ Summary
● Short bias below 3,975; targets at 3,927 and 3,884. Bearish reversal confirmed within the rising channel.
-------------------
Share your opinion in the comments and support the idea with a like. Thanks for your support!
Metals

XAU/USD Intraday Plan | Support & Resistance to WatchGold is pulling back after failing to clear resistance around 3970, showing the first signs of intraday exhaustion following the sharp rally. The bias remains bullish, but it’s healthy to see some correction after strong momentum.
The MA50 acts as the first line of dynamic support, aligning with the 3937 support level. Failure to hold above this zone may open the way for a test of lower reaction zones before fresh buying interest emerges.
A clear break above 3970 will likely invite momentum buyers and push price toward the 4000 and possibly 4020 resistance levels.
📌Key Levels to Watch
Resistance:
3970
4000
4020
Support:
3937
3909
3880
3820
🔎Fundamental Focus:
The ongoing U.S. government shutdown continues to delay key data and elevate risk sentiment. With uncertainty rising and liquidity thinning, gold is highly reactive to political headlines, leading to erratic intraday volatility. Safe-haven demand underpins dips, but sudden reversals remain possible.

XAUUSD NEXT POSSIBLE MOVEGold is facing resistance near a key supply zone where sellers are showing strength. If the price fails to break above this area and shows rejection, a bearish move can be expected.
Momentum is slowing, indicating that sellers may take control if the market stays below resistance.
Watch for clear bearish confirmation before entering the sell side.

GOLD (XAUUSD): 4000 Soon?!
Gold was strongly bullish on Monday, updating the ATH again.
The next psychological resistance is 4000.
I think that the price will reach that soon.
We will probably see a pullback first.
You can consider the underlined supports, especially Horizontal Support 1
and a Vertical Support 1 for buying after a pullback.
❤️Please, support my work with like, thank you!❤️
I am part of Trade Nation's Influencer program and receive a monthly fee for using their TradingView charts in my analysis.

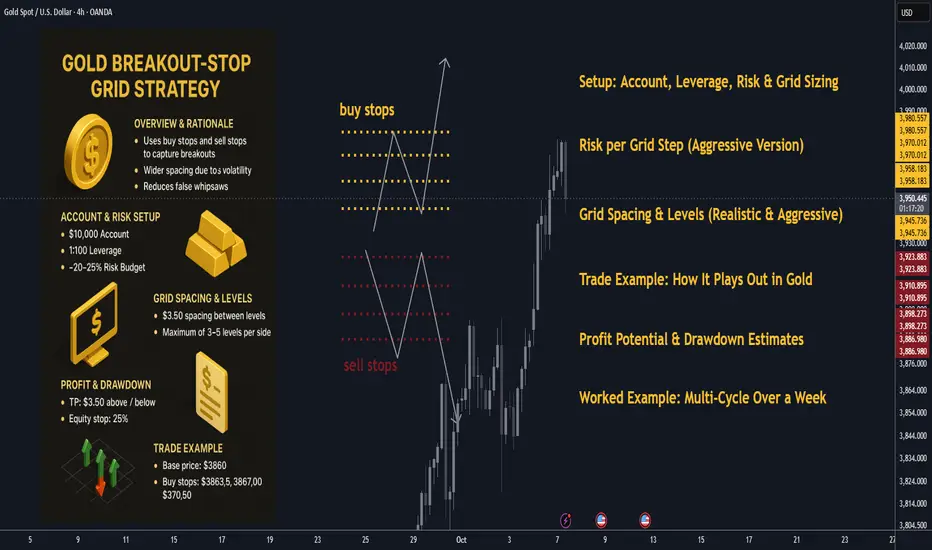
Gold Grid Trading Overview: Effective Strategy for 20% gains🪙 Gold Breakout-Stop Grid Strategy: Overview & Rationale
Grid trading is often built using limit orders above and below a base price, expecting the market to oscillate and capture many small profits. But in a strongly trending or volatile asset like gold, there is often breakout momentum that drives price through grid zones rather than bouncing.
By instead using buy stops above and sell stops below (i.e. breakout triggers), you capture directional thrusts, while still retaining a grid structure (i.e. multiple layers). Think of it as a hybrid between a breakout strategy and a grid.
Key advantages in gold:
• ✨ Gold often exhibits strong trending phases, with momentum after breakouts of supply/demand zones.
• 📊 Volatility is higher than many forex pairs, so you can space your grid more widely, reducing overcrowding.
• 🎯 With breakout stops, you reduce “false bounce” whipsaws inside the range; only when momentum validates do you trigger entries.
Risks / caveats:
• ⚠️ If price doesn’t break strongly and whipsaws, you could trigger and then reverse, creating drawdown.
• 📉 In a sideways gold market, fewer breakouts may be triggered, lowering trade frequency.
• 🛡 You must carefully size exposure and use drawdown controls, especially with leverage.
I’ll now walk through how to set this up, with gold-tailored specifics and sample trades (with increased aggressiveness), using realistic current spot prices (≈ $3,862) Investing.com.
________________________________________
🧮 Setup: Account, Leverage, Risk & Grid Sizing
📋 Account & Leverage
• Account size: $10,000
• Leverage: 1:100
• This means your maximum notional exposure is huge but margin and maintenance rules will limit you.
• We’ll now risk ~20–25%+ of equity in an aggressive version of this system (in order to aim for 20-30% weekly), i.e. $2,000–$2,500 at most drawdown limit for a grid run.
Note: This is very aggressive and only for demonstration. Many traders would never risk this much per grid.
💰 Risk per Grid Step (Aggressive Version)
• Let’s target $50 risk per triggered order (instead of $10) so that each step is meaningful.
• That means if a triggered order goes adverse by its maximum “stop zone,” your loss is $50.
• If you trigger, say, 5 steps, that’s $250 worst case on that direction (if all hit adverse).
• You must still cap total drawdown (e.g. 25% or $2,500) and limit exposures.
📈 Gold Contract & Price Movements
• Spot gold (XAU/USD) currently trades about $3,862.74 Investing.com.
• Let’s assume a contract specification such that 1 standard lot gives $100 per $1 move (so $1.00 move = $100) — a common ballpark in retail gold CFDs.
• Then:
• A move of $0.01 = $1 (for 1 lot).
• Therefore, if you trade 0.50 lots, a $1 move = $50.
So with this, to get ~$50 risk per $1 adverse move, 0.50 lots is a candidate (because $1 adverse × 0.50 lots × $100/lot = $50).
You can scale lot sizes accordingly.
📏 Grid Spacing & Levels (Realistic & Aggressive)
Given gold’s volatility, use wider spacing. Let’s choose:
• Grid spacing = $3.50 between successive triggers (a robust distance).
• We’ll place buy stops and sell stops relative to a base zone around current spot.
Let’s pick base ~ $3,860 as our pivot.
So:
• Buy stops: $3,863.50, $3,867.00, $3,870.50, $3,874.00, $3,877.50
• Sell stops: $3,856.50, $3,853.00, $3,849.50, $3,846.00, $3,842.50
(Max 5 levels each side, but you may cap to 3–5.)
Take Profit / Exit Logic:
• Target profit per trade = $3.50 (same as spacing).
• Thus one successful step = $3.50 × lot_size × $100.
• If lot_size = 0.50 lots, $3.50 × 0.50 × $100 = $175 profit per triggered trade.
• If you get 3 successful triggers in a run: 3 × $175 = $525 gross.
• That’s 5.25% on $10,000 in one clean directional run (before commissions/slippage).
You see the scaling is now aggressive — you risk more per step, but also gain more per successful trade. Limit how many triggers you allow (e.g. max 3–4 per side) to cap exposure.
Define a hard equity stop: e.g. if floating drawdown > 25% ($2,500), close all and reset.
________________________________________
🧭 Trade Example: How It Plays Out in Gold (Realistic Prices & Aggression)
We’ll do two detailed scenarios. This time we target higher returns, with real price zones.
________________________________________
🎯 Scenario A: Bullish Breakout
Base price: ~$3,860 (spot)
Buy stops: $3,863.50, $3,867.00, $3,870.50
Sell stops: $3,856.50, $3,853.00, $3,849.50
Lot sizing: 0.50 lots per order (so $3.50 adverse = $175 risk).
TP per trade: +$3.50
Sequence:
1. Gold climbs and breaks $3,863.50 → triggers Buy #1 at 3,863.50
o TP at 3,867.00 → profit if reached = ($3.50 × 0.50 × $100) = $175
2. Momentum continues, price breaks 3,867.00 → triggers Buy #2 there
o TP at 3,870.50 → another $175
3. Price surges, breaks 3,870.50 → triggers Buy #3 → TP = 3,874.00 → +$175
If all three succeed: Gross = $525 (5.25% gain) in one directional move.
If you allow up to 4 or 5 levels, total can scale to ~$700–900 (7–9%) in a strong move — if all hits. If reversal? If price reverses after buy #2, or before buy #3, you can:
• Close open longs immediately when opposite side’s sell stop triggers.
• Or cancel further buy stops once a reversal signal appears.
• Or net positions (if your broker supports hedging) — but that adds complexity.
Better to disable opposite side (sell stops) after the first buy triggers, to avoid collision exposures.
________________________________________
🔻 Scenario B: Bearish Breakout
Same base zone. Now price breaks downward.
• Sell stops at: 3,856.50, 3,853.00, 3,849.50
• TP each = –$3.50 from entry.
Sequence:
1. Gold breaks 3,856.50 → Sell #1 → target 3,853.00 → profit $175
2. Continues down, breaks 3,853.00 → Sell #2 → target 3,849.50 → +$175
3. Breaks 3,849.50 → Sell #3 → target 3,846.00 → +$175
If all three succeed: $525 profit.
If you allowed 4 levels: e.g. break 3,846.00 next → target 3,842.50 → +$175 more → total $700. Again, reversal risk must be managed.
________________________________________
📊 Mixed / Whipsaw Scenario
Suppose price crosses above $3,863.50 → triggers Buy #1, moves a bit, then reverses and crosses down through 3,856.50, triggering Sell #1.
You now hold:
• Long from $3,863.50 (losing)
• Short from $3,856.50 (potential profit)
This is a collision. To avoid chaotic risk:
• Cancel all opposite-side stops when first side triggers.
• Or immediately close all on first collision signal.
• Or lock in partial profit/loss and pause grid until trend clarity returns.
That’s why many breakout-grid strategies disable the opposite direction after first breakout.
________________________________________
📈 Profit Potential & Drawdown Estimates (Aggressive Model)
Let’s simulate one clean grid run (bullish) where 3 steps succeed fully:
• Gross profit = $525
• If you risked 3 steps * $175 = $525, worst-case these same 3 steps lose you $525 (if all adverse)
• Net = +5.25% in one run
• If you manage 2–3 such runs per week (if market allows), theoretically 10–15%+ weekly is possible — but that is optimistic.
However, in real life, not all runs will hit all targets — sometimes partial, sometimes losses. A drawdown of 25% ($2,500) is your cap boundary.
With that, if you undergo 5 bad runs in a row, you’d hit your equity stop.
If average win per run is $400 and average loss per bad run is $500, you need a favorable win-loss ratio to hit ~20–30% weekly. This is extremely aggressive.
________________________________________
🔁 Adaptive Mechanics & Enhancements (for robustness)
To improve consistency and manage risk, add:
• 📐 ATR-based spacing: Use a 14-period ATR on H4 or D1 to set grid spacing. If ATR = $4, spacing = $4 or $5.
• 📈 Trend filter: Only open buy-side grids when price > 200-period MA (H4 or D1), or only open sell-side when price < MA. Prevent fighting trend.
• 🚫 Volatility filter / news blocks: Do not place or trigger near major gold-related news (Fed, CPI, central bank announcements).
• 🔄 Grid rebase / reset: After a winning cycle, re-center grid around new price and restart stop orders.
• 📈 Scaling rules:
– Aggressive scaling: after n consecutive wins, increase lot size (within risk caps).
– Defensive scaling: after a loss, reduce lot size or skip grid.
• 🛑 Equity-stop / margin cap: If floating drawdown > 25% or margin usage > 80%, close all and reset.
• 🧊 Cooldown periods: After a loss or big run, pause grid orders for some hours/days to let market settle.
________________________________________
🧮 Worked Example: Multi-Cycle Over a Week (Aggressive)
Say you run 3 grid cycles in a week under trending conditions:
Cycle Direction Steps hit Gross profit Net (after one partial loss)
1 Up 3 out of 4 levels hit fully +$525 +$490 (small drawdown on partial)
2 Down 2 of 3 hit, 1 reversed +$350 +$320
3 Up 4 levels hit fully +$700 +$700
Total gross = $525 + $350 + $700 = $1,575
Net after adjustments/slippage ~ $1,450–$1,500
That’s ~ 14.5% gain in one week.
If the market is more favorable, you may hit ~20–30%, but the risk is commensurate.
Over multiple weeks the compounding is powerful — but a few big losses can wipe gains.
________________________________________
✅ Summary & Implementation Tips
• Use breakout stops (buy stops above, sell stops below) instead of limits to catch directional thrusts in gold.
• Wider grid spacing (e.g. $3–$5) is essential to survive volatility.
• Lot sizing must match your desired risk per step (here $50).
• Limit max triggers per direction and enforce a hard equity stop (e.g. 25%) to avoid blow-ups.
• Employ trend / volatility filters to filter low-probability entries.
• After a net winning run, rebase grid to current price.
• Use scaling and cooldown mechanics to moderate aggression.
• On collision signals, cancel opp side stops or close everything to avoid contradictory exposures.
Gold 1H – Pullback Expected Before Key CPI Data💎 XAUUSD – Intraday Trading Plan | Ryan_TitanTrader
📈 Market Context
Gold is stabilizing below the $4,000 mark as traders await this week’s U.S. CPI data and fresh remarks from the Federal Reserve. After a strong multi-week rally, the metal is showing early exhaustion near premium liquidity zones, where engineered pullbacks often occur before continuation.
While the mid-term bias remains bullish, several analysts — including those from Citi and UBS — caution that gold could face short-term corrections if the dollar regains strength. The market continues to price in around a 65% probability of a December rate cut, keeping volatility elevated and sentiment uncertain.
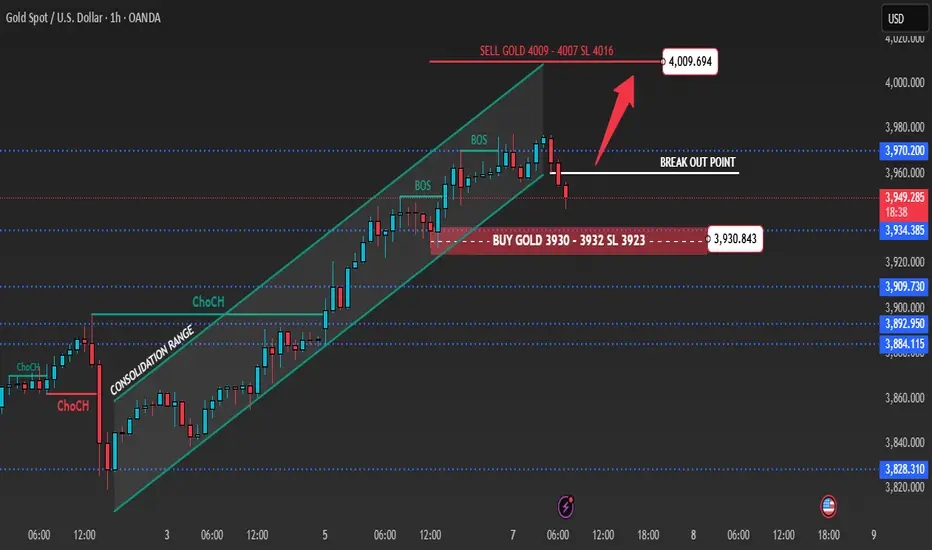
🔎 Technical Analysis (H1/H4)
Price has slipped slightly below the ascending channel after consecutive BOS signals, indicating a potential short-term retracement before resuming the uptrend.
🟢 Buy Zone: 3932–3930 (Breakout & FVG zone) – an ideal discount area where buyers may re-enter the market.
🔴 Sell Zone: 4009–4007 (Premium liquidity) – a key region for short setups if price rejects strongly.
🔑 Key Levels
• BUY Zone: 3932–3930 (main support 3923)
• SELL Zone: 4009–4007 (liquidity reaction area)
• Psychological Resistance: 4000
💡 Trading Scenarios & Plan
🟢 BUY ZONE: 3932–3930
SL: 3923
TP: 3945 – 3955 – 3965 – 3975 – 3980+
🔴 SELL ZONE: 4009–4007
SL: 4016
TP: 3995 – 3980 – 3975 – 3965 – 3955
⚠️ Risk Management Notes
The 4000–4010 region acts as a high-liquidity magnet, where false breakouts and engineered sweeps may occur before reversals.
Wait for lower-timeframe confirmation (BOS or rejection candle) before entry.
Avoid overleveraging ahead of CPI — expect volatility spikes and rapid shifts in sentiment.
✅ Summary
Gold remains structurally bullish but vulnerable to intraday retracements near 4009–4007. Ryan_TitanTrader anticipates potential buy reactions from 3932–3930 and short-term rejections near 4009–4007. Holding above 3923 keeps the bullish outlook intact with upside targets toward 3970–3980.
🔔 Follow Ryan_TitanTrader for real-time updates, live setups, and advanced SMC insights as gold reacts to CPI data this week!
The most accurate analysis on the entire network do you follow As the US government shutdown continues, many central banks continue to increase their gold holdings. Coupled with Trump's new tariffs and geopolitical implications, the market continues to release bullish signals, contributing to a pattern of gold prices hitting new highs. Yesterday, gold in the US market tested the resistance of 3960-3970 as expected and then fell back to around 3945. Those brothers who followed the trading strategy and went short must have made good profits.
As time goes by and the price of gold continues to rise, the short-term lows are also moving higher. Gold continued to rise in the Asian session today, reaching a high of around 3977 before falling back. In the short term, pay attention to the support level below 3955-3940. If it falls back for the first time during the day, you can consider going long on gold.
In addition, observing previous gold price trends, we can see that every time gold breaks through a new high, it will experience a pullback of approximately $70-80 to accumulate momentum after hitting channel resistance. According to this trend pattern, combined with the rising channel of our chart, we can find that the next suppression point is at 3985-4000.
Overall, gold remains bullish in the medium to long term, but may experience short-term technical adjustments. The core trading strategy remains primarily long gold, supplemented by short positions. If the price falls back to the 3955-3940 range for the first time during the day, you can consider buying gold in batches according to the strength of the pullback, with the target at 3985-4000. After the resistance level is reached and under pressure, you can consider shorting gold appropriately based on the market trend.
LiamTrading – Risk of adjustment before hitting the $4000 mark?LiamTrading – GOLD: Risk of adjustment before hitting the $4000 mark? ⚠️
Hello everyone,
Gold is approaching the psychological price zone of $4000/oz, but before reaching this historic milestone, the market may be preparing for a short-term adjustment.
According to Bank of America's technical strategist – Paul Ciana, gold's upward momentum is “overheated,” and a mid-cycle adjustment may occur soon.
📉 Technical Analysis (Chart H1 – Wolfe Waves Formation)
Observing the chart, a Wolfe Waves pattern is clearly forming:
The Sell zone 3988–3990 is the convergence point of wave number 5 – a potential short-term reversal area.
The Buy zone 3963–3965 is a local support retest point, where sellers tend to take short-term profits.
The Wolfe trendline indicates that the price may take liquidity above the peak area before a corrective drop appears.
If an adjustment occurs, the 3940–3955 area will be the first reaction zone, where strong buying support is present.
🎯 Trading Scenario
Buy retest:
📍 3963–3965
🛑 SL: 3960
🎯 TP: 3972 – 3985 – 4000
Sell following Wolfe waves:
📍 3988–3990
🛑 SL: 3995
🎯 TP: 3972 – 3955 – 3945
🧭 Medium-term Outlook
Although the upward trend remains dominant, momentum is gradually decreasing, and the market needs to “cool down” to create a new accumulation phase.
Dense liquidity zones around POC 3957–3960 may trigger a short-term pullback before gold gains momentum towards the ATH $4000 zone in the late-week sessions.
📌 Conclusion
Gold remains in a medium-term uptrend, but a short adjustment is necessary to maintain a sustainable upward structure.
Traders should prioritize flexible scalping, observing reactions at Fibo – Volume Profile zones – and especially the developing Wolfe Waves pattern.
I will continue to update the latest scenario details for XAUUSD daily.
👉 Follow me to not miss important wave movements!

Gold: Minor Pullback Before Next Surge – Eyes on 4,000 USDHello everyone, this week gold continues to show strength after an impressive rally. Over the past weekend, the price reached a new peak but experienced a slight correction around 3,900–3,905 USD, just as the market needed to rebalance before seeking further upside momentum.
Macro factors are supporting the bullish trend: the US government shutdown has entered its third day, weakening the USD. Expectations that the Fed may soon begin a rate-cut cycle and a slight decline in 10-year yields reduce the opportunity cost of holding gold. Additionally, ETF inflows, FOMO sentiment, geopolitical risks, and European/Russian gold reserve dynamics are increasing risk premiums, creating a favourable environment for further gains.
On the H1 chart, the price remains above the Ichimoku cloud with a steady upward movement. Newly formed FVGs below indicate key support levels: 3,900–3,905 (shallow FVG), 3,885–3,892 (horizontal low cluster), and 3,865–3,875 (deeper cloud + FVG). Near-term resistance sits at 3,925–3,935, followed by 3,950–3,960; if momentum holds, the psychological 4,000 USD level is within reach. Rising trading volumes around 3.90x reflect active buying, while short-bodied retracement candles merely indicate temporary rebalancing before continuation.
What do you think? Will gold use this pullback to surge to 4,000 USD, or will the market experience a deeper swing?

Gold Futures (MGC) – No Pullback, Just Pure StrengthPrice never offered a clean pullback yesterday — just an aggressive continuation straight through prior structure. That type of behavior usually signals either institutional repricing or momentum fueled by broader uncertainty (like the ongoing U.S. government shutdown risk).
🔹 Bias: Bullish until a clear break of intraday structure
🔹 Current Levels:
‣ W-H: 3922.8
‣ M-H: 3899.5
‣ D-L: 3909.0
💡 Notes:
Price is extremely extended, but until we see evidence of rejection or a 1H BOS (break of structure), the path of least resistance remains up. I’m watching closely for a controlled pullback into demand — ideally near 3920–3900 — to join the next wave higher.
Still keeping an eye on news risk tonight; if the shutdown proceeds, volatility could spike and disrupt the structure.
#GoldFutures #MGC #FuturesTrading #SmartMoney #DayTrading #PriceAction #NOFOMO

The long position of 3935 gold is making a huge profit!The market is always full of possibilities. There is no so-called "highest point", only higher possibilities. When the trend is clearly upward, going with the flow is the core strategy to achieve stable profits. Avoid trading against the trend or based on emotions, especially in the current volatile market environment. Trading without clear thinking and discipline can easily lead to unnecessary losses. This is something I've been emphasizing. For those who are still on the sidelines and haven't yet developed an effective trading strategy, please follow my channel. We will continue to provide professional market analysis, comprehensive trading plans, and precise buy and sell instructions to help you better grasp the market's rhythm.
I am not surprised by the sharp rise in gold prices at the opening. Those who have read my views know that the current trend is basically consistent with my prediction, and reaching 3900 is within expectations. Since last week, we have been emphasizing that the bullish trend of gold remains unchanged. On Thursday and Friday, we established long positions in gold at 3840-3855-3874, including buying at 3893 at the beginning of the opening. This is based on the technical analysis and news analysis, which makes us dare to be so firmly bullish.
Last Friday, despite a surge and then a decline, gold prices remained volatile at high levels. Market expectations of further Federal Reserve rate cuts, coupled with high uncertainty regarding global geopolitical risks and the economic outlook, continued to provide stable support for gold prices, maintaining their upward trend. In particular, the recent US government shutdown crisis has stimulated rising risk aversion sentiment, helping gold prices to rise further, and the market's concerns about a long-term US government shutdown have intensified.
Judging from the gold daily chart, gold prices rebounded sharply last Friday and recorded a large real body positive candlestick pattern. Although the sharp rebound in prices last Friday failed to break through the previous high, gold prices continued to rise after opening high this week. In addition, the moving average cluster maintained a bullish arrangement, and the MACD indicator double lines maintained a golden cross operation process, indicating that the current trend is under the control of bulls.
The short-term trading strategy continues with last week's buy-on-low strategy!
There are many areas in 393-3925, the target is 3945, pay attention to the breakthrough of 3950, if it breaks through, look higher!
The above is the gold signal opinion published four hours ago. The first target of 3945 has been successfully reached. It is also correct to continue to be bullish after breaking through 3950. The accurate prediction perfectly matches the current gold trend. Welcome to click to view the original text!

Gold MAGIC!As stated back in June, there is still more upside in gold.
MAGIC!
However, we remain in the Eiffel Tower pattern.

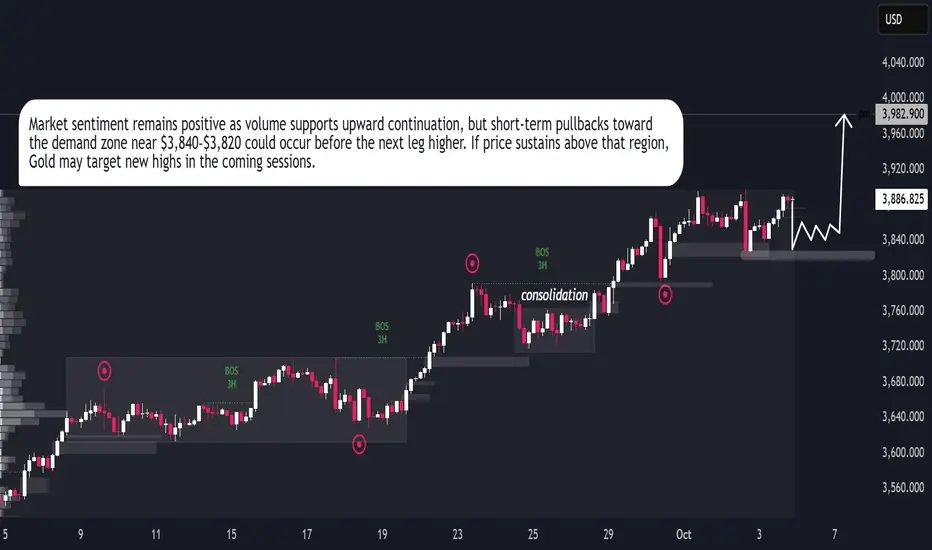
GOLD → Structural Rebalance Before Next Bullish LegGOLD → Structural Rebalance Before Next Bullish Leg
Gold remains in a strong bullish structure, showing consistent higher highs and steady momentum after each correction. The market has been consolidating above the $3,800 zone, where buyers continue to absorb liquidity and prevent deeper declines. This zone acts as a solid base for potential upward expansion. Current market behavior indicates controlled accumulation, suggesting that institutional buyers are maintaining dominance. If gold holds above $3,840–$3,820, the next bullish leg may target the $3,960–$4,000 region. A short-term retracement could occur, but overall momentum favors continuation. The price structure and volume behavior both support further upside, reflecting strong buyer control and stable sentiment in the market.
Gold Bullish Momentum: Layering Longs For Maximum Gain!🏆 XAU/USD | The Gold Robbery Heist Plan (Swing/Day Trade)
🎯 Plan Setup (Bullish)
Entry (Layering Style):
Using the Thief Layer Strategy 🕵️♂️ → Multiple Buy Limit layers
$3625
$3630
$3635
$3640
(Add more layers based on your own strategy & risk appetite)
Stop Loss (Thief SL):
@3610 (Adjust based on your own strategy & risk ⚠️)
Take Profit (Escape Point):
Target resistance zone @3690 🚪💰
⚡ Note: This is a flexible thief-style plan — adjust SL/TP levels as per your personal money management and execution style.
📊 Why This Plan? (Thief’s Market Analysis)
🔎 Real-Time Market Data (10 Sept 2025)
Price: $3,643.71
24h Change: +0.48%
Range: $3,620.90 – $3,644.56
🧠 Retail Sentiment (Contrarian Signal)
Long: 37%
Short: 63%
➡️ Retail crowd is heavily short → Contrarian bullish setup.
🏦 Institutional Sentiment (Commitment of Traders)
Net Long: +249,530 contracts
Long: 315,796
Short: 66,266
➡️ Institutions are firmly positioned long ✅
🌡️ Fear & Greed + Volatility
Neutral (shifting from Greed)
VIX <14 (52-week low) → Calm market backdrop
📉 Macro & Fundamentals
US jobs data: Weak (22K vs. 75K expected)
Fed rate cut probability: 99.4% (September meeting)
Central bank gold demand + geopolitical tensions supportive
Upcoming CPI/PPI = key catalyst
📐 Technical View
Price holding above $3,625 support
Ascending channel continuation
Overbought zone = caution for short pullbacks
🗝️ Key Takeaways (Thief OG Notes)
USD weakness + Fed dovish tilt = Gold tailwind
Retail shorts = bullish contrarian setup
Institutions backing the move higher
Short-term overbought → manage exits smartly
🔥 Related Markets to Watch
OANDA:XAGUSD (Silver)
TVC:DXY (US Dollar Index)
SP:SPX (S&P 500)
TVC:US10Y (US 10Y Treasury Yield)
BITSTAMP:BTCUSD (Bitcoin correlation check)
✨ “If you find value in my analysis, a 👍 and 🚀 boost is much appreciated — it helps me share more setups with the community!”
#XAUUSD #Gold #Forex #SwingTrade #DayTrading #TechnicalAnalysis #Fundamentals #ThiefStrategy #TradingPlan #GoldBulls #MacroAnalysis #MarketSentiment

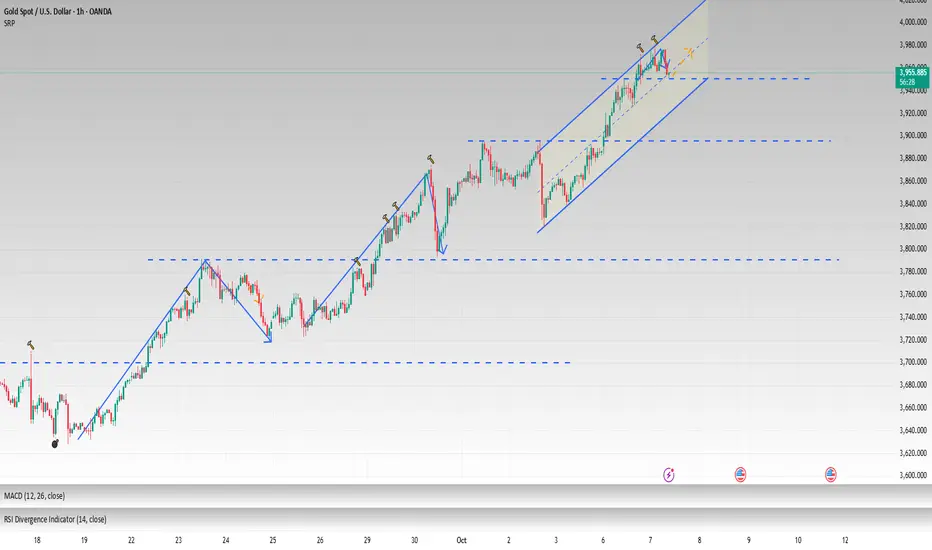
Updated gold analysis and trend ideaHi traders
With the target range of the upper time frame buyers touched, the price reacted negatively, with a consolidation below 3950, a pullback to continue the correction to low liquidity to support 3895 and from there a trigger buy for the ranges 3978 and 4003

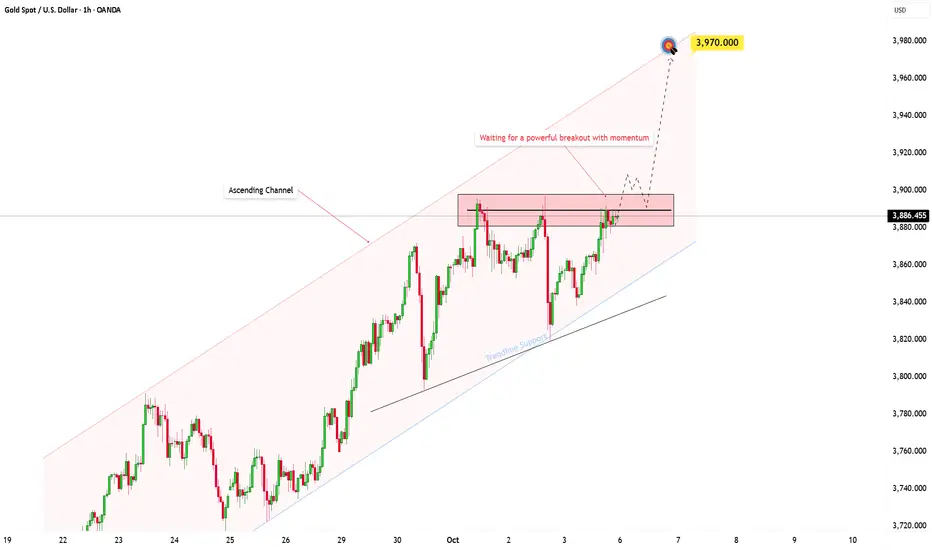
The Gold Bulls Take Control!Hi everyone, Kilian here!
Let’s talk about XAUUSD.
Gold is showing a clear and structured bullish trend right now. The price continues to move within a well-established ascending channel, and the price action has consistently respected both the upper and lower boundaries. This suggests that the buying pressure remains strong.
The next logical step for me is a break above the current resistance zone. If we see that breakout, I expect the price to pull back briefly to test the support level before continuing its upward movement. A successful retest of support would solidify the bullish structure and set the stage for a move toward the 3,970 level, aligning with the upper boundary of the channel.
However, if the resistance proves too strong and the breakout doesn’t happen, this could signal a weakening of the bullish momentum. In that case, we could see a deeper pullback toward the lower boundary of the ascending channel, offering another potential entry point.
It’s crucial to always confirm your setups and manage risk properly. Be prepared for both scenarios, and best of luck with your trades!