Stop!Loss|Market View: GOLD🙌 Stop!Loss team welcomes you❗️
In this post, we're going to talk about the near-term outlook for GOLD ☝️
Potential trade setup:
🔔Entry level: 4122.884
💰TP: 3895.119
⛔️SL: 4246.000
"Market View" - a brief analysis of trading instruments, covering the most important aspects of the FOREX market.
👇 In the comments 👇 you can type the trading instrument you'd like to analyze, and we'll talk about it in our next posts.
💬 Description: According to our previous review of this metal, the price is moving according to an alternative scenario, namely, a retest of the 4150-4200 range. Currently, short-term selling is being actively looked for, and the medium-term mood remains focused on levels of 3600-3700. We can expect additional manipulation/a slight move toward 4200 in the near future, but it's not a certain thing that we'll reach this round level, and we could reverse earlier.
Thanks for your support 🚀
Profits for all ✅
❗️ Updates on this idea can be found below 👇
Metals

Stop!Loss|Market View: EURUSD🙌 Stop!Loss team welcomes you❗️
In this post, we're going to talk about the near-term outlook for the EURUSD currency pair☝️
Potential trade setup:
🔔Entry level: 1.15351
💰TP: 1.14184
⛔️SL: 1.15903
"Market View" - a brief analysis of trading instruments, covering the most important aspects of the FOREX market.
👇 In the comments 👇 you can type the trading instrument you'd like to analyze, and we'll talk about it in our next posts.
💬 Description: The euro price has returned to the 1.15500 - 1.16000 range, which is now acting as resistance. Selling trades can be actively looked for from this area, especially within the medium-term downward movement of this pair. The focus is on a breakout of the lower border of 1.15500 and a father move toward 1.14000.
Thanks for your support 🚀
Profits for all ✅
❗️ Updates on this idea can be found below 👇

Gold price rose, awaiting the majors data resumeThere were signs of a resuming US government, which could resume the major data release, especially in the labor market. The labor market has weakened recently, and private data indicate a contraction in companies being watched, driving investors to seek safe havens like gold. Besides, the central bank continued to accumulate gold, with a 28% annual growth in Q3, projected to reach above 1000 tons per year in the latest four years, supporting gold prices.
The XAUUSD briefly tested the 4150 level, with the Golden Cross EMAs signaling stronger bullish momentum. However, the price could hover around 4150 before breaching to test the next resistance at the 4200 level.
By Van Ha Trinh - Financial Market Strategist at Exness

USDCAD weak!USDCAD has been moving down with a pull back in Asian session. Came in for about a 1:1 RR.

GOLD (XAU/USD) – Intraday Technical Outlook | November 11, 2025Gold continues its strong bullish momentum, extending from the previous breakout structure on the H1 timeframe. The market has respected the ascending trendline, forming higher highs and higher lows, confirming short-term buyer dominance.
Currently, price is testing the resistance zone around 4147 – 4187, which aligns with a Fibonacci extension level and a potential exhaustion point from the recent impulse wave. Traders should pay close attention to price action signals within this area for possible reactions.
Key Technical Levels:
Resistance: 4187 – 4200 (Fib 1.618 & psychological zone)
Support: 4116 – 4130 (trendline + previous consolidation zone)
Trading Plan:
Scenario 1 (Bullish Continuation): If price sustains above 4147 with strong volume and bullish momentum, the next target will be 4187, followed by 4210.
Scenario 2 (Correction Setup): A rejection from 4187 could trigger a short-term pullback toward 4116, providing potential buy-the-dip opportunities along the trendline support.
Indicators Insight:
EMA Cluster (50–100): Still sloping upward, confirming bullish bias.
RSI: Near overbought region, signaling caution for late buyers.
Fibonacci 0.618 retracement: Lies near 4115, aligning with our first support zone.
Gold remains in an uptrend, but with price nearing key resistance, traders should manage risk carefully and wait for confirmation before entering.
Stay alert for volatility during the U.S. session and remember: reaction matters more than prediction.
Follow for more daily gold trading strategies and updates.

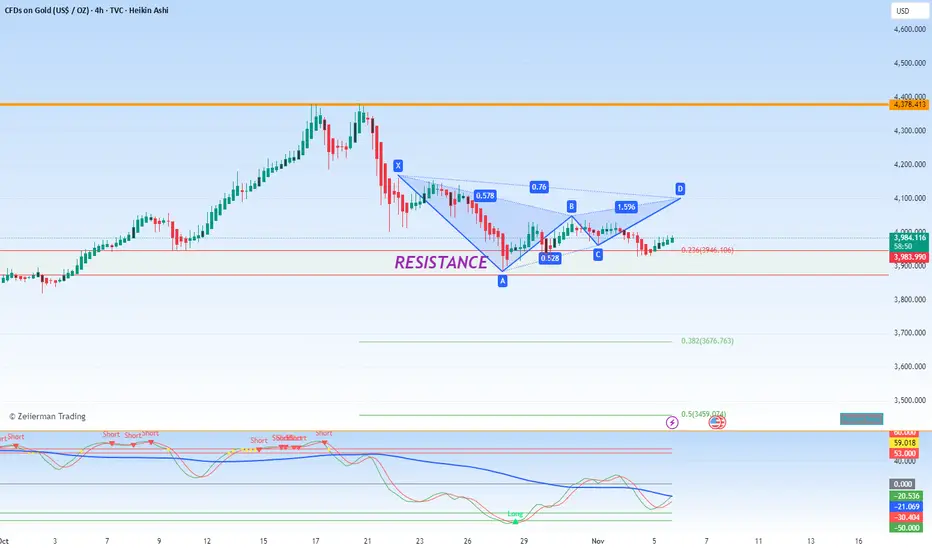
Gold has shaken off its drop and is back on a run!Based on the recent price action, Gold established a new all-time high before undergoing a significant corrective decline of approximately $4,000. From a technical perspective, this sell-off has found a firm footing at a critical juncture. The price has not only stabilized at a prior resistance level—which has now transitioned into a robust support zone—but this level also coincides perfectly with the completion point of a bullish Gartley pattern.
This harmonic pattern, often signaling a potential reversal, suggests the recent downturn may be exhausted. The convergence of these two technical indicators—the strong support-resistance flip and the validated Gartley structure—presents a compelling case for a long entry at the current levels.
Consequently, the strategy is to initiate a long position targeting an upward move towards the $4,100 mark, as the technical setup implies a high probability of a renewed bullish impulse.
SILVER Strong Supply Area Ahead! Sell!
Hello,Traders!
SILVER tapped into a major supply zone, where liquidity above previous highs got engineered for smart money entries. The structure suggests a bearish continuation toward the next target zone. Time Frame 5H.
Sell!
Comment and subscribe to help us grow!
Check out other forecasts below too!
Disclosure: I am part of Trade Nation's Influencer program and receive a monthly fee for using their TradingView charts in my analysis.

Gold - The bullrun is over today!💰Gold ( TVC:GOLD ) creates a massive top:
🔎Analysis summary:
Starting all the way back in 2015, Gold created a major rounding bottom pattern. After the breakout, Gold started its major bullrun, rallying about +300% over the past couple of years. But after this rally, Gold is now showing clear signs of a serious top formation.
📝Levels to watch:
$4,000
SwingTraderPhil
SwingTrading.Simplified. | Investing.Simplified. | #LONGTERMVISION

4 reasons traders are piling back into gold right now Here’s all the reasons gold is up more than 2% today:
U.S. consumer sentiment fell to its second-lowest level ON RECORD.
The government shutdown, the longest in U.S. history, is likely coming to an end this week, easing pressure on the U.S. dollar.
The US economy likely lost jobs in October, and layoffs reached a 20-year high.
Traders now see about a 70% chance of a rate cut next month.
Gold, therefore, is up ~2.8% on Monday to ~$4,115. The XAUUSD RSI indicator has moved above its midline, showing mild buying pressure, while the 50-day moving average near $3,891 may be acting as key support.
So, is 2.8% just the start of a bigger rally?

Gold (XAUUSD): route of interest to buyGold (XAUUSD): route of interest to buy. If it goes like this I will enter, as I missed the previous entry.
Cheers

Gold Breaks above $4050, what is next? Gold prices continued to edge higher on Monday amid growing market speculation that the Federal Reserve may cut interest rates in December. Despite earlier comments from several Fed officials suggesting no rate cuts this year, the probability of a December cut has strengthened. This renewed optimism has once again boosted gold’s appeal as a safe-haven asset.
However, in my view, the recent price rise isn’t solely driven by expectations of rate cuts. There are several broader macroeconomic and geopolitical factors contributing to gold’s bullish momentum.
Following the recent meeting between Donald Trump and Xi Jinping, markets were initially hopeful that a significant trade breakthrough would ease tensions between the U.S. and China. Investors expected that China might resume exports of rare minerals and critical raw materials, which are essential for semiconductor production.
While China has indeed decided to extend the export suspension of certain materials—particularly gallium and antimony—until 2026, the uncertainty beyond that timeframe has created further anxiety in global markets. This uncertainty, combined with expectations of slower global economic growth into 2026, is strengthening demand for gold as a long-term hedge.
In addition, major central banks such as China, Russia, and Turkey have been steadily increasing their gold reserves. This accumulation provides additional support for gold prices, as these institutions are likely to continue buying on dips to diversify away from dollar exposure. Fundamentally, the overall outlook remains strongly bullish for gold.
From October 20 to October 28, gold experienced a short-term pullback. Despite that correction, price action consistently respected the key support zone near $3,990–$4,000, never forming a stable close below it. The market repeatedly failed to break below that base, showing buyers’ strength.
On the upside, the immediate resistance zone around $4,030–$4,050 had held firm for several sessions. However, during today’s early trading session, gold successfully broke above this resistance, establishing stability above the breakout level.
Currently, the next short-term target lies near the $4,130–$4,150 range. If the daily candle closes bullishly, even a minor correction could be followed by another leg upward toward that zone.
Given that $4,150 represents a strong resistance area, a brief pullback is possible once price reaches it. But if gold can sustain a stable close above $4,150, the next psychological target would be around $4,200–$4,230, with a potential final upside target near $4,280–$4,300.
Support & Risk Levels
Immediate Support: $4,050
Next Strong Support: $3,970 – $4,000
Major Support (Invalidation Zone): $3,880 – $3,900
As long as gold holds above the $3,880–$3,900 range, a major downtrend remains unlikely. Buyers continue to defend lower levels aggressively, and momentum remains positive both fundamentally and technically.
Gold remains underpinned by a mix of fundamental optimism (potential Fed rate cuts, central-bank buying, geopolitical uncertainty) and technical strength above its breakout levels. A sustained move above $4,150 could open the path toward $4,300, while a break below $3,970 might trigger a temporary correction.

SILVER WILL KEEP GROWING|LONG|
✅SILVER is rallying from a refined demand zone, showing bullish orderflow continuation. With liquidity swept below previous lows, institutions may target the next imbalance near $51.00. Time Frame 3H.
LONG🚀
✅Like and subscribe to never miss a new idea!✅

XAU/USD) Bullish trend analysis Read The captionSMC Trading point update
technical analysis of Gold (XAU/USD) on the 4-hour timeframe. Let’s break down the technical analysis presented:
Overall Idea
The analysis suggests that Gold is likely to continue its upward movement after a possible short-term retracement. The chart projects a move toward the target point at 4,160.549.
---
Key Technical Elements
1. Break of Structure / Trendline Break
A descending trendline (black) has been broken to the upside, signaling a potential trend reversal from bearish to bullish.
The breakout candle is strong and supported by volume, confirming bullish momentum.
2. Fair Value Gap (FVG) Zone
A Fair Value Gap (blue box) has been marked where price may retrace to fill imbalance before continuing higher.
This FVG area also aligns with the previous resistance turned support, adding confluence for a bullish continuation.
3. Exponential Moving Averages (EMAs)
EMA 50 (blue): 4,016.295
EMA 200 (black): 3,965.661
Price has crossed above both EMAs, indicating a strong bullish trend shift.
A bullish EMA crossover may be forming, further confirming upward bias.
4. Projection Path
After a short retracement into the FVG zone, the expected price structure shows:
A bounce upward forming higher highs.
The final target zone is projected at 4,160.549, where a potential take-profit level lies.
---
Target and Confirmation
Target Point: 4,160.549
Retracement Zone (Buy Area): Within the blue FVG zone (around 4,060–4,080 range).
Confirmation: Watch for a bullish reaction (e.g., bullish engulfing or rejection wicks) within the FVG zone before entry.
---
Risk Considerations
If price closes below the FVG or drops back under 4,016 (50 EMA), it could invalidate the bullish continuation setup.
Fundamental catalysts like U.S. Dollar strength or economic data releases could cause volatility and affect momentum.
Mr SMC Trading point
---
Summary:
This analysis outlines a bullish continuation setup on Gold, expecting a pullback into the FVG for liquidity collection before resuming upward momentum toward 4,160.549.
Please support boost 🚀 this analysis

XAU/USD) Bullish trend analysis Read The captionSMC Trading point update
Technical analysis of Gold (XAU/USD) on the 4H timeframe, following Smart Money Concepts (SMC) and structural confluence trading. Let’s break down the full reasoning behind this setup
---
Overall Concept
The chart suggests that Gold is preparing for a bullish breakout after a successful retest of the trendline and demand zone, signaling potential institutional accumulation before a push toward the target level at 4,080.231.
---
Technical Breakdown
1. Market Structure
Price recently broke above a descending trendline, signaling a potential change of character (ChoCH) from bearish to bullish structure.
The higher lows and multiple rejections from the blue demand zone confirm buyer interest.
The small arrow and upward projection illustrate an expected retracement and continuation pattern (impulse → correction → new impulse).
2. Key Levels
Current Price: 4,001.275
50 EMA: 4,003.110 → Price is now testing and starting to close above this level, showing renewed bullish strength.
200 EMA: 3,960.048 → Dynamic support confirming mid-term bullish bias.
Demand Zone (blue area): Around 3,985–3,995 — key zone for re-entries and confirmation of buyer defense.
Target Point: 4,080.231 (aligned with a liquidity zone or prior imbalance area).
3. Confluences
EMA Cross: Price pushing above both 50 and 200 EMA — often a signal of trend reversal strength.
Trendline Retest: The green arrow indicates a successful retest of broken resistance turned support.
Bullish Structure: Higher highs and higher lows forming above the EMAs.
Volume: 101K+ — healthy momentum supporting institutional buy continuation.
4. Expected Scenario
1. Short-term retracement into the blue demand zone or along the ascending trendline.
2. Bullish reaction (engulfing candle or rejection wick).
3. Continuation move toward the 4,080 target zone.
---
Trade Idea Summary
Aspect Detail
Bias Bullish
Entry Zone 3,985 – 3,995 (demand + trendline confluence)
Stop Loss Below 3,960 (under EMA200 and previous swing low)
Take Profit 4,080
Risk-to-Reward (RR) ≈ 1:3 or better
Mr SMC Trading point
---
Confirmation to Watch
Bullish candle close above 4,005 (EMA50)
Rejection from the blue demand zone
Break of short-term high around 4,015 confirming continuation
---
Summary
Gold appears ready for a trend continuation following accumulation above major EMAs and a clean retest of structure. The next impulsive move is projected toward 4,080, aligning with prior liquidity and smart money target areas.
please support boost 🚀 this analysis

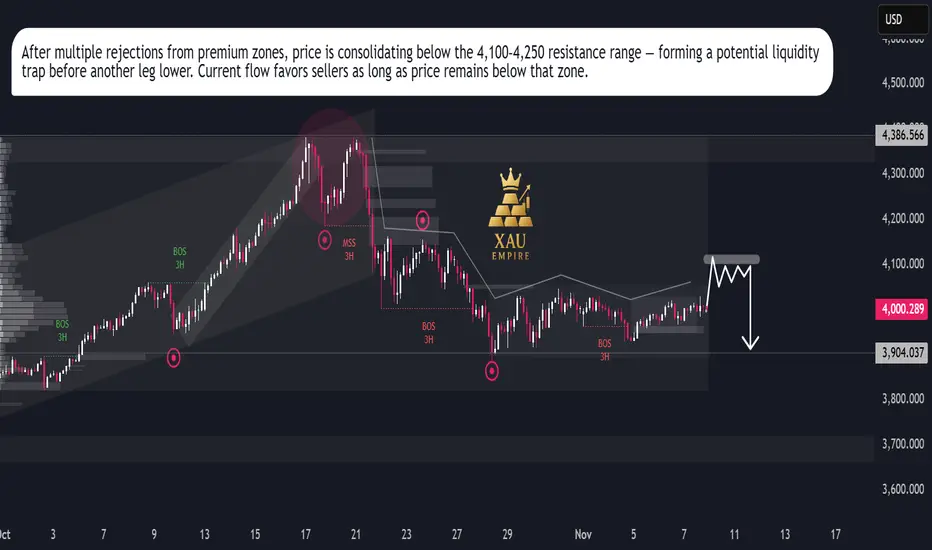
Gold – Distribution Before DropGold – Distribution Before Drop
Gold is showing signs of exhaustion after the recent corrective bounce. The 3H market structure highlights a clear distribution pattern, as price continues to reject from the 4,100–4,250 supply zone. Repeated Break of Structure (BOS) signals that bearish momentum remains dominant.
Institutional activity suggests that liquidity is being built above local highs, preparing for another downside leg. The current market sentiment stays bearish as long as price trades below the key premium area. A confirmed rejection from this zone could trigger a decline toward the 3,904 liquidity pool.
Only a breakout and hold above 4,250 would invalidate this scenario and shift bias back to bullish accumulation.
GOLD | Daily Analysis #5 - 10 November 2025Hello and Welcome back to DP,
Technical Analysis:
🟩 Demand Zones (Support Areas)
$4,025 – $4,060
This is the primary demand zone
Formed after a strong bullish impulse that broke previous structure highs.
Multiple bullish candles emerged from this zone with increasing volume — clear institutional buying footprint.
Acts as immediate support if price retraces.
A sustained hold above $4,060 keeps short-term buyers in control.
🟥 Supply Zones (Resistance Areas)
$4,108 – $4,148
Prior distribution area before the sharp drop in late October.
Sellers previously defended this level twice (confirmed by the red arrows).
Expect profit-taking or short setups on the first retest — this is major resistance in the short term.
First rejection likely near $4,120; a 2H close above $4,150 would invalidate the bearish pressure here.
$4,366 – $4,370 (black line above)
Upper-level supply and major swing high from October.
Would become the next upside target if price breaks and holds above $4,150.
SO, After forming a higher low near $3,760, price shifted bullish, breaking successive minor structure highs. Current move is an impulsive leg approaching the first strong supply zone ($4,108–$4,148).
The market is bullish in the short term, but approaching key overhead supply.
Disclaimer:
This content is for informational purposes only and does not constitute financial or investment advice. © DIBAPRISM
Amir D.Kohn

Gold Price Setup: The Pullback Signal Is Getting Stronger!OANDA:XAUUSD is currently trading within a well-defined ascending channel, with price action now testing the upper boundary. This level may act as a dynamic resistance, and a rejection here could trigger a correction toward 4,030.
Such a pullback aligns with expectations for a healthy retracement after a strong rally. I anticipate this move will serve as an important launchpad for buyers, defined by the confluence of horizontal support and the 0.618 Fibonacci retracement of the latest bullish impulse.
This zone will be critical in determining whether the broader bullish structure remains intact. If price holds and shows signs of reversal, it could offer a solid re-entry opportunity for buyers. However, a decisive break below this region would invalidate the current bullish outlook, opening the door for a deeper correction.
Always confirm your setups and manage risk wisely. Stay sharp, and trade smart.

Gold 30-Min — Volume Buy & Sell Reversals Triggered⚡Base : Hanzo Trading Alpha Algorithm
The algorithm calculates volatility displacement vs liquidity recovery, identifying where probability meets imbalance.
It trades only where precision, volume, and manipulation intersect —only logic.
✈️ Technical Reasons
/ Direction — LONG / Reversal 4004
☄️Bullish momentum confirmed through strong candle body.
☄️Structure shifted with higher-low near key demand base.
☄️Volume expanding confirms order-flow alignment upward.
☄️Buyers reclaimed imbalance with sustained clean break.
☄️Algorithm detects rising momentum under low liquidity.
✈️ Technical Reasons
/ Direction — SHORT / Reversal 4093
☄️Bearish rejection confirmed through sharp candle body.
☄️Lower-high forming beneath resistance supply region.
☄️Volume decreasing confirms exhaustion in price rally.
☄️Sellers regained imbalance with heavy top rejection.
☄️Algorithm detects fading demand and shift to control.
⚙️ Hanzo Alpha Trading Protocol
The Alpha Candle defines the day’s real control zone — the first battle of momentum.
From this origin, the Volume Window reveals where the next precision strike begins.
⚙️ Hanzo Volume Window / Map
Window tracked from 10:30 — mapping true market behavior.
POC alignment exposes institutional bias and breakout potential zones.
⚙️ Hanzo Delta Window / Pulse
Delta window monitors real buying vs. selling power behind each move.
Tracks volume aggression to expose who controls the candle — buyers or sellers.
When Delta aligns with Volume Map, momentum becomes undeniable.

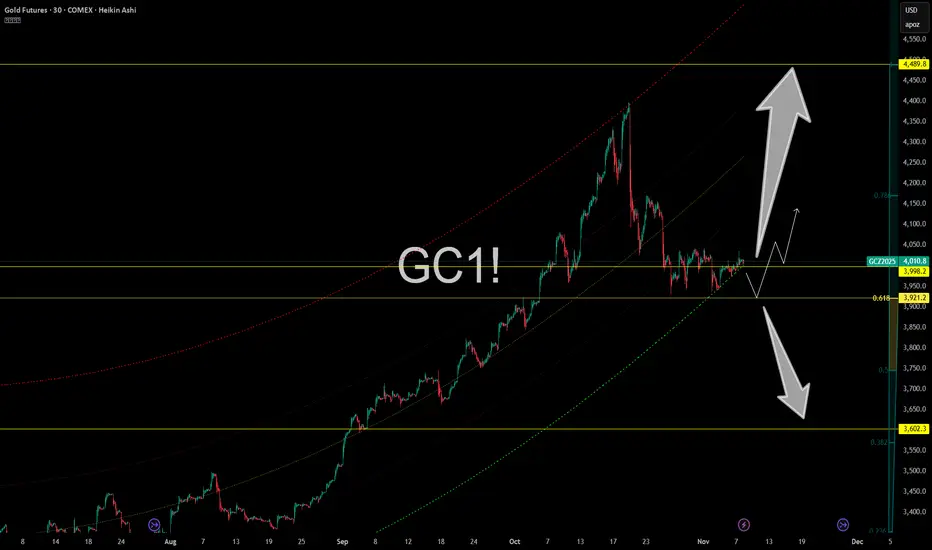
Gold Futures – Compression Before Explosion?Gold (GC1!) is coiling tightly just above the $3,998 level, teasing a big move as it hugs the 0.618 fib zone at $3,921. It’s the definition of compression — and when gold coils like this, something always gives.
📍 Key levels on the radar:
$3,998 – Current pressure zone
$3,921 – Fib support + breakout base
$3,602 – Worst-case flush if demand fails
$4,489 – Fibonacci extension target if this rips
We’ve got an ascending pitchfork, clean market structure, and a massive range breakout setup. These kinds of patterns don’t sit idle for long.
Gold remains a beast in uncertain macro conditions — don’t underestimate what happens when fear, rates, and inflation mix.
Trading Wisdom 📜
The bigger the coil, the nastier the move. Don’t focus on direction — focus on readiness. Gold pays those who stay patient and deadly.
Disclaimer: What you read here is not financial advice — it’s high-level market philosophy from the FXPROFESSOR himself. Risk is real, and your capital is your responsibility. Learn, adapt, evolve.
One Love,
The FXPROFESSOR 💙

Silver Tries a Comeback but It Could Depend on the ShutdownSilver is contracting within a triangle-like pattern. After the sharp selloff, it managed to find some balance above the 47.60–47.80 zone and has since regained the 200 SMA on the 60-minute timeframe.
Liquidity constraints tied to QT and the US government shutdown are creating downward pressure on precious metals. These factors are likely to ease once the shutdown and QT end, and the market may start pricing that in early, potentially leading to renewed bullish momentum in the coming days.
The 49.30 level is likely to serve as the trigger for upward movement. Until that resistance breaks, it’s best to remain cautious.

Bullish Gold TurnaroundOver the weekend, Trump’s $2000 tariff dividend announcement and the Senate’s first step toward ending the shutdown gave a strong boost to gold prices. Both developments are helping to ease the dollar liquidity crunch that has pressured gold in recent days.
It’s not over yet, but after testing the 4130–4150 resistance zone, gold might see a short-term selloff that could present a new buying opportunity. With quantitative tightening set to end in December, bullish pressure is likely to persist in the medium term.

XAUUSD Has it started a Bear Cycle according to the Dollar??Gold (XAUUSD) may be rising early into the week on news of a potential U.S. government opening but remains heavily rejected from the Highs of the past 3 weeks.
At the same time, the U.S. Dollar Index (DXY illustrated by the black trend-line) has been staging its first legitimate bottom since December 2020 and is rebounding. That DXY's bottom came a few months after Gold's top for that Cycle. The result was the start of Gold's new 2-year Bear Cycle.
In fact that DXY bottoming pattern was also present in 2011, right before Gold topped this time. This suggests that the current DXY bottom has the potential to start a new multi-year rally, hence a new Bear Cycle for Gold.
This pattern is further strengthened by the fact that Gold has formed a Quadruple Top on its 1W RSI Resistance Zone, similar to both of its previous Cycle Top patterns since 2011.
Is the Dollar signaling a Bear Cycle on Gold?
-------------------------------------------------------------------------------
** Please LIKE 👍, FOLLOW ✅, SHARE 🙌 and COMMENT ✍ if you enjoy this idea! Also share your ideas and charts in the comments section below! This is best way to keep it relevant, support us, keep the content here free and allow the idea to reach as many people as possible. **
-------------------------------------------------------------------------------
💸💸💸💸💸💸
👇 👇 👇 👇 👇 👇
