Gold Breaks Balance, Now Waiting for ValueYesterday was a shortened session due to the MLK holiday, so I stayed flat. Price opened the week by breaking out of the range it had been consolidating in for most of last week, likely assisted by geopolitical headlines around potential tariffs involving Denmark/Greenland.
After the initial breakout, price spent the remainder of the session consolidating again, building value above the prior balance area.
Now that we are into a full trading day and inside the Asian Killzone, my bias remains bullish, but I am not interested in chasing price.
The breakout left behind a clean H4 Fair Value Gap, and I want to see price retrace into at least 50% of that imbalance before looking for long continuation. That 50% level aligns closely with:
The Previous Weekly High
The Previous Day’s Open (4627)
A controlled pullback into that area with acceptance would offer a much cleaner risk profile and confirm that higher prices are being defended. Until then, patience is key. Waiting for clarity inside the killzone rather than forcing entries.
MGC

Early Market Close for MLK day. Wait for the better moveNot much to say. Not a move here. We are waiting for price to finish consolidation and break out of the area before we make any calls on direction. Looking for price to move bullish but need a pullback into entry. another full update during Asian session coming.

Gold Trapped in Re-Accumulation Above Yearly HighGold exploded into the weekly open and tagged the Previous Yearly High and Monthly High, but instead of rejecting, price has been consolidating above that level for two full sessions now.
That’s not weakness — that’s re-accumulation.
We are currently sitting in a tight range between the Previous Daily Low (~4576) and the highs around 4630, with overlapping candles, compressed volume, and no real displacement. This is classic value building after a breakout, not a clean reversal.
There is a valid H4 FVG below around 4545–4525, but imbalances don’t get filled until the market finishes its business on the current side of the auction. Right now, liquidity is being built above the Yearly High.
Until we see:
• A break and acceptance below 4576 → shorts toward the H4 FVG
or
• A break and hold above 4630 → continuation to new highs
everything in between is chop.
I’m staying patient inside the killzones and waiting for escape velocity, not trying to predict direction inside a compression coil. The real move always comes after the range.

Gold Trapped Between HTF Liquidity — Waiting for the Real TUESMonday did exactly what Mondays do — it created liquidity without resolution.
Price ran above the Yearly & Monthly highs, failed to hold, and left behind a clear H4 Fair Value Gap. That tells me this wasn’t a breakout… it was a stop run + displacement.
Now rolling into Tuesday, I’m not chasing.
I’m waiting for price to return into H4 value and test:
Previous Weekly High – 4526.9
Previous Daily Low – 4521
That zone is where real business happens.
If we get a clean sweep into that area, DOM excess + absorption should show us whether this move is going to rotate lower first before continuing bullish.
No entries outside of the killzone.
No emotional trades.
Let the market come to me.
📍 Patience is the edge.

Gold at Decision Point — Consolidation or Weekly Reversal?Price made a high on Tuesday and spent Wednesday consolidating rather than rejecting. HTF structure remains bullish, but momentum has slowed and price is now compressing around value.
My weekly rule is that Tuesday’s high or low often sets direction — however, consolidation alone is not confirmation. For a higher-timeframe short bias, I want to see a clean break and close below yesterday’s low at 4433, followed by acceptance below that level.
Until then, any shorts are tactical and counter-trend, not conviction trades.
If 4433 fails and cannot be reclaimed, I’ll look for continuation lower.
If price holds value and re-accepts higher, this may resolve as continuation up.
Waiting for the market to show its hand. No anticipation — only confirmation.

Gold (MGC) — HTF Bullish, Waiting on Acceptance for ContinuationHTF structure remains bullish with price printing higher highs and higher lows.
Yesterday produced a slow, rotational push higher, suggesting digestion rather than clean expansion.
Today’s session opened by testing yesterday’s high, followed by an immediate pullback into the 50% equilibrium of yesterday’s range. This area is now acting as a key decision zone.
For continuation, I want to see:
Displacement away from the 50% level
Reclaim and acceptance above yesterday’s high (not just a tag)
Clean follow-through without immediate rotation back into prior range
If price fails to reclaim and starts accepting below equilibrium, I’ll remain patient and wait for deeper value before considering continuation setups.
Bias stays bullish — execution depends on confirmation, not assumption.
Plan > Patience > Execution

XAUUSD Daily – Five-Wave Impulse Toward 4,530On the XAUUSD daily chart I’m tracking a potential five-wave advance within the existing uptrend.
Wave (1)** marks the initial impulsive leg higher from trendline support
Wave (2)** is the corrective pullback that holds above the origin of wave (1) and respects the rising trendline
Wave (3)** extends beyond the wave
(1) high, confirming continuation of the bullish structure and establishing a new swing high.
* Price is now correcting as **wave (4)** back into the area of:
* the rising trendline drawn from prior lows, and
* the former consolidation / breakout zone around the previous highs.
While price holds above the wave (4) low and the trendline, I’m anticipating a continuation leg to the upside as **wave (5)**.
The projected wave (5) objective is around 4,527, where I have a confluence of measured extension and overhead resistance.
A decisive daily close below the wave (4) low and trendline support would invalidate this wave count and delay the bullish scenario.

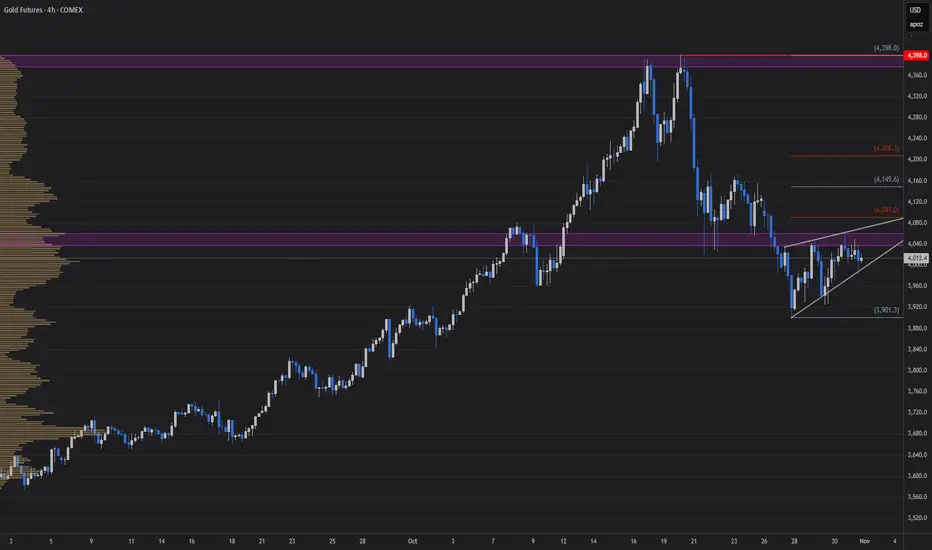
Gold Futures (MGCZ2025) — Weekly FVG Magnet & Potential ReversalPrice has been respecting Standard Deviation levels beautifully across the H4, Daily, and Weekly timeframes. The market recently rejected the H4 FVG and is now hovering mid-range, with a Weekly Fair Value Gap left open below.
This imbalance could attract price early in the week, creating a liquidity grab and possible weekly low before Gold flips bullish again.
Key Levels:
🟤 H4 FVG rejection zone: 4,040 – 4,080
🔵 Weekly FVG target: 3,880 – 3,900
⚫ Weekly High: 4,124
⚫ Weekly Low: 3,901
Narrative:
I’m expecting price to push into the Weekly FVG discount zone early in the week — potentially aligning with high-impact financial news — and then reverse bullish for a mid-week or end-of-week rally.
Watch For:
Price displacement or BOS near the Weekly FVG
Killzone reactions (London & NY)
Volume and order flow confirmation before entering
Bias: Short-term bearish → medium-term bullish
Invalidation: Sustained trade below 3,842 (Weekly Lows & -1σ zone breach)

GC Higher or Lower?Looking at GC on the 4 hour TF, we see it consolidating in a small rising wedge. If price wants to continue higher, I will be looking for price to drop back down to the $3980s level and then move higher breaking out of the wedge. If price wants to continue lower, I will be looking for price to make its way up to the 38.2% Fibonacci level marked on the chart, around $4090s, before breaking back down and creating another leg down in its recent downtrend.
What are your thoughts on GC?
GC Futures – Are We Flipping Bearish Into Midweek?Tuesday closed below Monday’s low, hinting at a potential shift in sentiment.
Currently, price is approaching a 1H FVG inside the prior Asian range, just below the Weekly Low (W-L) and Daily High (D-H) — a perfect liquidity pocket.
I’m watching for signs of rejection here to confirm a bearish continuation. If price holds above this area, we may see a short squeeze back into higher value.
Bias remains bearish, but confirmation is key.
What are you seeing here — are we setting up for continuation or a fakeout?
#Gold #Futures #GC #DayTrading #SmartMoney #OrderFlow #ICT #NoFOMO

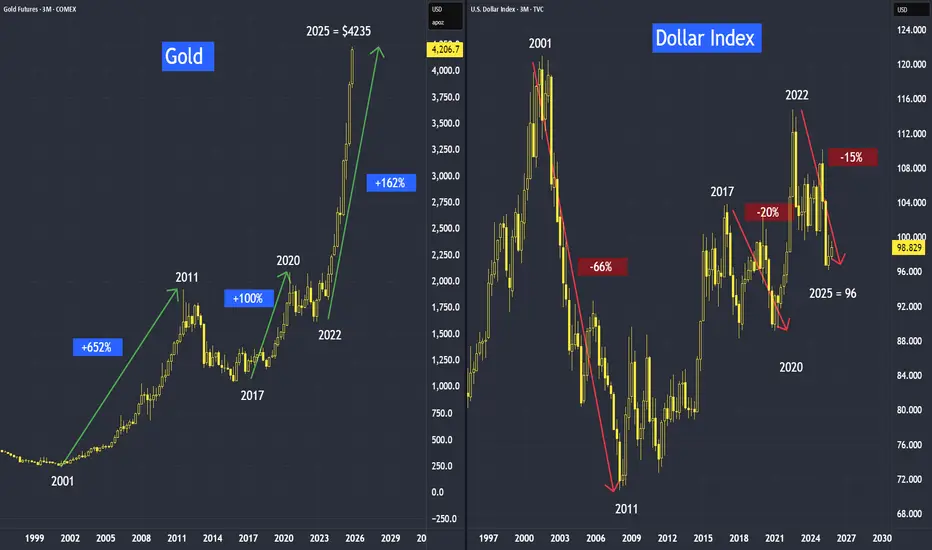
How High Will Gold Go? It Depends on the DollarThe inverse relationship between gold and the dollar is evident. Interestingly, we observe that when the dollar falls, gold rises—but the magnitude of gold’s increase is often greater than the dollar’s decline.
As we can see when dollar declines, gold went up.
From 2001 to 2011, when dollar was down, gold went up.
From 2017 to 2020, when dollar was down, gold went up.
And from 2022 to current, when dollar is down, gold is up.
With de-dollarization, this also means gold may have more upside potential.
Conversely, when the dollar increases, gold declines by almost the same magnitude.
Apart from de-dollarization, what are the other reasons dollar will face more headwinds?
There are three elements
• Existing debt,
• more money printing and
• tariffs,
All these 3 elements are not going to go away anytime soon, as long as the debt continue to rise, more money to be printed and more tariffs impose, dollar downtrend is likely to continue. When dollar is down, gold is up.
And these trends did not happen recently. It is taking shape over the past decades with a lower dollar, we can see how nicely the trends have seated on its historical troughs and peaks forming the channel for the dollar, and also in the gold over the decades.
This tutorial video version:
Mirco Gold Futures and Options
Ticker: MGC
Minimum fluctuation:
0.10 per troy ounce = $1.00
Disclaimer:
• What presented here is not a recommendation, please consult your licensed broker.
• Our mission is to create lateral thinking skills for every investor and trader, knowing when to take a calculated risk with market uncertainty and a bolder risk when opportunity arises.
CME Real-time Market Data help identify trading set-ups in real-time and express my market views. If you have futures in your trading portfolio, you can check out on CME Group data plans available that suit your trading needs www.tradingview.com
Has Gold Reached Its Fullest Potential?Has gold reached its fullest potential? It depends on the US dollar.
As we can see when dollar declines, gold went up.
i) From 2001 to 2011, when dollar was down, gold went up.
ii) From 2017 to 2020, when dollar was down, gold went up.
iii) And from 2022 to current, when dollar is down, gold is up.
With de-dollarization, this also means gold may have more upside potential.
Mirco Gold Futures and Options
Ticker: MGC
Minimum fluctuation:
0.10 per troy ounce = $1.00
Disclaimer:
• What presented here is not a recommendation, please consult your licensed broker.
• Our mission is to create lateral thinking skills for every investor and trader, knowing when to take a calculated risk with market uncertainty and a bolder risk when opportunity arises.
CME Real-time Market Data help identify trading set-ups in real-time and express my market views. If you have futures in your trading portfolio, you can check out on CME Group data plans available that suit your trading needs www.tradingview.com

Gold Futures – Waiting for the Flush Before the Long (Asian KillMarket Context:
Gold is sitting right inside a confluence zone — overlapping Daily + H4 Fair Value Gaps at 3,375–3,380. This zone also aligns with the lower boundary of last week’s range (W-L at 3,397).
What I’m Watching:
Going into the Asian Killzone, I’m looking for an impulsive spike down into this FVG.
This move would ideally push below 3,375, tag liquidity, and create DOM excess — the kind of aggressive selling that often marks exhaustion before reversal.
ADX is above 25 and rising, signaling momentum is strong — but we’re at a potential pivot level.
Bullish Setup Criteria:
Flush down into 3,375 or slightly below.
DOM excess showing absorption (stuck sellers).
Strong rejection candle (M1/M5) followed by bullish follow-through.
Targets if Triggered:
T1: 3,397 (Weekly Low)
T2: 3,423 (Daily High)
Stretch: 3,451 (Monthly High)
Invalidation:
1H close below 3,375 without immediate reclaim.
Summary:
Patience is key. I want to see sellers press in during Asia, fail to break down with continuation, and then get run over on a squeeze higher. If we get the right reaction, this could be the start of a strong move into Weekend.

GOLD poised for breakout GLD & /gcAfter going on a huge run to 317 we have spent a significant time now basing out and consolidating we’ve come down into that 300 range and tested and built up quite a bit of support
With the Iranian intentions we could kickstart the next move in gold 317 is the breakout. I am looking to play this breakout on an intra day pull back with some calls one month out for a swing Trey looking at the 320 or 325 strike price

Gold at 100 Times its Price - A Psychological LevelGold has now risen to 100 times its previously fixed price of $35 per ounce.
Is this a psychological milestone signaling a correction ahead, or is there still more upside potential?
Under the Gold Reserve Act of 1934, gold was officially priced at $35, a rate maintained until 1971, when President Nixon suspended the dollar’s convertibility into gold, effectively ending the gold standard. This historic move, known as the “Nixon Shock,” allowed gold to trade freely in the market. By December the same year, the market price had already climbed to around $43–44 per ounce.
So why has gold risen from $35 to $3,500?
Micro Gold Futures & Options
Ticker: MGC
Minimum fluctuation:
0.10 per troy ounce = $1.00
Disclaimer:
• What presented here is not a recommendation, please consult your licensed broker.
• Our mission is to create lateral thinking skills for every investor and trader, knowing when to take a calculated risk with market uncertainty and a bolder risk when opportunity arises.
CME Real-time Market Data help identify trading set-ups in real-time and express my market views. If you have futures in your trading portfolio, you can check out on CME Group data plans available that suit your trading needs www.tradingview.com
Trading the Micro: www.cmegroup.com
www.cmegroup.com

Trade Plan – MGC (Micro Gold Futures) | Sunday, May 4Trend Bias (Multi-Timeframe Analysis):
• 1W: Bullish – Strong macro uptrend with pullback off all-time highs.
• 1D: Bearish – Lower highs and lower lows forming after topping out at $3,509.
• 4H: Bearish – Clean downtrend continuation forming.
• 1H: Bearish – Price rejected lower highs, now curling down again.
• 15M: Bullish – Short-term bounce from $3,210 low, but corrective in nature.
Trade Setup:
• Direction: Short
• Entry Zone: $3,250 – $3,260
• Price has retraced to a lower-high zone under supply; aligns with hourly resistance.
• Stop Loss: $3,270
• Just above 1H structure and 15M failed high.
• Take Profit: $3,210
• Prior swing low and liquidity zone.

Gold Above $3,000 and MoreAccording to the World Gold Council, more than 600 tons of gold — valued at around $60 billion — have been transported into vaults in New York. Why are they doing that?
Since Donald Trump election in November, there is around $60 billion worth of gold that has flowed into a giant stockpile in New York.
The reason why physical gold is flowing into the US is because traders are afraid Trump might put tariffs on gold.
Gold Futures & Options
Ticker: GC
Minimum fluctuation:
0.10 per troy ounce = $10.00
Micro Gold Futures & Options
Ticker: MGC
Minimum fluctuation:
0.10 er troy ounce = $1.00
1Ounce Gold Futures
Ticker: 1OZ
Minimum fluctuation:
0.25 per troy ounce = $0.25
Disclaimer:
• What presented here is not a recommendation, please consult your licensed broker.
• Our mission is to create lateral thinking skills for every investor and trader, knowing when to take a calculated risk with market uncertainty and a bolder risk when opportunity arises.
CME Real-time Market Data help identify trading set-ups in real-time and express my market views. If you have futures in your trading portfolio, you can check out on CME Group data plans available that suit your trading needs www.tradingview.com
Trading the Micro: www.cmegroup.com

The 3rd Major Pivot in Gold’s Uptrend - Since Trade War in 2018We just witnessed the start of another pivot in gold when Trump won the U.S. presidential election in November 2024. My gold trading strategy has always focused on buying dips while keeping any short-selling opportunities short-term.
The chart above clearly illustrates three major V-shaped formations in gold. After each tariff or trade war, a V-shaped pattern formed in the same month the policy was initiated, followed by a subsequent uptrend.
Recently, I published a video analyzing other significant tariffs since the U.S.-China trade war began in 2018. We observed a consistent pattern: after each tariff or trade war, the same month of policy initiation saw the formation of a V-shaped trough, followed by an uptrend.
This time, the V-shaped trough occurred during the U.S. presidential election month. The right side of this V-shape was completed with the announcement of 25% tariffs on Canada and Mexico, signaling the expansion of the trade war beyond China.
The consequence of trade wars is inflation, and gold has historically served as a leading indicator of this trend.
If the trade war persists and intensifies, a continued uptrend in gold seems inevitable. Analyzing the long-term monthly chart using my parallel channel approach, we observed gold prices encountering resistance around $2,600 in September 2024 and beyond. However, by the close of January, the price action provided a clear confirmation of the ongoing gold uptrend. Gold firmly closed above $2,600, reaching $2,835 for COMEX Micro Gold Futures.
On the 3-hour chart, I have provided another set of parallel channels as a guide to track support and resistance levels as gold trends further.
As gold prices continue to climb, their notional value can become quite large for retail traders. COMEX Micro Gold Futures, being 1/10th the size of the regular gold contract, is a better option for me when the next buying opportunity arises. Recently, CME launched a new contract—a pocket-sized one-ounce gold contract. One key to successful trading is selecting the right contract size for oneself, which is crucial for effective risk management.
Once again, my strategy for gold remains the same: focus on buying dips while keeping any short-selling opportunities short-term.
Please see the following disclaimer and information that you may find useful:
Gold Contracts:
Gold Futures & Options
Ticker: GC
Minimum fluctuation:
0.10 per troy ounce = $10.00
Micro Gold Futures & Options
Ticker: MGC
Minimum fluctuation:
0.10 er troy ounce = $1.00
1Ounce Gold Futures
Ticker: 1OZ
Minimum fluctuation:
0.25 per troy ounce = $0.25
Disclaimer:
• What presented here is not a recommendation, please consult your licensed broker.
• My mission is to create lateral thinking skills for every investor and trader, knowing when to take a calculated risk with market uncertainty and a bolder risk when opportunity arises.
CME Real-time Market Data help identify trading set-ups in real-time and express my market views. If you have futures in your trading portfolio, you can check out on CME Group data plans available that suit your trading needs www.tradingview.com

Tariffs and Their Influence on GoldWe observed how gold has pivoted upward so precisely each time tariffs were applied since the start of the trade war in 2018.
Before the trade war, gold remained stagnant within this range. However, with the onset of the trade war, everything changed for gold.
We will conduct a case study since 2018, analyzing how gold has reacted to each significant tariff imposed.
With the latest proposed tariffs on Canada and Mexico, what could be the potential trend for gold, and how should it be managed above the current level?
Gold Futures & Options
Ticker: GC
Minimum fluctuation:
0.10 per troy ounce = $10.00
Micro Gold Futures & Options
Ticker: MGC
Minimum fluctuation:
0.10 er troy ounce = $1.00
1Ounce Gold Futures
Ticker: 1OZ
Minimum fluctuation:
0.25 per troy ounce = $0.25
Disclaimer:
• What presented here is not a recommendation, please consult your licensed broker.
• Our mission is to create lateral thinking skills for every investor and trader, knowing when to take a calculated risk with market uncertainty and a bolder risk when opportunity arises.
CME Real-time Market Data help identify trading set-ups in real-time and express my market views. If you have futures in your trading portfolio, you can check out on CME Group data plans available that suit your trading needs www.tradingview.com

XAUUSD - Push it to the Limit?!Happy (Asia session) Wednesday Y'all!
I am back with my first video of the new year & I'm really excited to start publishing videos again for y'all...
Let's dive in!
On the daily we are in a HUGE correction/ascending channel. So what am I looking for?
Bullish: I explained it in the video lol but a quick recap - push down to the 15m LQZ then push up to the 3rd touch of my trendline OR the 4H LQZ - we'll see how price shapes up
Bearish:
I want to see price come down to that same LQZ - push through AGGRESIVELY - followed by some consolidation in the form of a flag. It is on the flag that I am interested in looking for an entry
EZ-PZ y'all textbook trade! Just gotta be patient and actually WAIT FOR YOUR SETUP!! I will most likely post an update/recap so be on the lookout for that!
I hope this was informative and helped even just 1 of you traders out!! Thanks for watching!!
Happy Trading - Peace!

How to Manage Gold RisesGold is likely to continue its upward trend.
And how I have been managing it both as an investor and a trader for the Gold. I hope this tutorial will be helpful for two groups of people:
1. Those who already have some positions and would like to know how to accumulate more, and
2. Those who do not yet have a position but are considering getting in and trading it, though you may be worried about entering at a peak, as gold continues to reach new highs.
Micro Gold Futures & Options
Ticker: MGC
Minimum fluctuation:
0.10 per troy ounce = $1.00
Disclaimer:
• What presented here is not a recommendation, please consult your licensed broker.
• Our mission is to create lateral thinking skills for every investor and trader, knowing when to take a calculated risk with market uncertainty and a bolder risk when opportunity arises.
CME Real-time Market Data help identify trading set-ups in real-time and express my market views. If you have futures in your trading portfolio, you can check out on CME Group data plans available that suit your trading needs www.tradingview.com

Initiated a short position in GOLD, successfully reached target Gold may show bullish momentum at today’s open due to several key factors:
Safe-Haven Demand: Rising inflation or economic instability often drives investors toward gold, bolstering its appeal.
Weaker Dollar: A softer dollar makes gold more attractive to international buyers, supporting price gains.
Interest Rate Outlook: Speculation around potential rate cuts or pauses makes holding gold more favorable, reducing its opportunity cost.
Geopolitical Uncertainty: Tensions or instability in global markets can increase demand for gold as a safe asset.
Technical Factors: A recent break above resistance or strong support levels can trigger technical buying, reinforcing an uptrend.

China Halt Buying Gold - Time to sell? But when to buy again?Is there still demand for gold by central banks around the world, and is gold heading for a correction?
We will look into some data on the central banks' interest in this precious metal and discuss how to trade gold during this period.
Micro Gold Futures & Options
Ticker: MGC
Minimum fluctuation:
0.10 per troy ounce = $1.00
Disclaimer:
• What presented here is not a recommendation, please consult your licensed broker.
• Our mission is to create lateral thinking skills for every investor and trader, knowing when to take a calculated risk with market uncertainty and a bolder risk when opportunity arises.
CME Real-time Market Data help identify trading set-ups in real-time and express my market views. If you have futures in your trading portfolio, you can check out on CME Group data plans available that suit your trading needs www.tradingview.com
