MU Micron Technology Options Ahead of EarningsIf you haven`t bought MU before the rally:
Now analyzing the options chain and the chart patterns of MU Micron Technology prior to the earnings report next week,
I would consider purchasing the 247.5usd strike price Calls with
an expiration date of 2025-12-19,
for a premium of approximately $8.10.
If these options prove to be profitable prior to the earnings release, I would sell at least half of them.
Micron

MICRON scripted blue-print. More than -50% sell-off expected.Micron Technology (MU) is on an amazing long-term rally since the April 2025 Low, currently on the 6th straight green month (1M candle) and 8th in the last 9 months. Its historic price action however shows that this remarkable uptrend may be coming to an end as the price is approaching the top of its 17-year Channel Up (started after the 2008 U.S. Housing Crisis).
Technically, this post April 2025 rally, is the Bullish Leg of this Channel Up and it already broke above the 0.786 Channel Fibonacci, a level that has only broken 3 times in total, with the last being in June 2018.
At the same time, it is close to completing a +601.35% rise, which despite being unusually high, Micron has done such rally 3 times in the past. The remarkable feat is that all those rallies where exactly +601.35%!
Last but not least, the 1M RSI is massively overbought and is approaching Resistance 2 (89.00), which was last seen on the June 2014 High.
All those factors collectively, force a huge bearish dynamic long-term. At best, we may see this rally exhaust near $440 on the short-term, thus fulfilling the +601.35% Bullish Leg blue-print but on the long-term the value of selling give much higher return.
And as far as a potential Target for this upcoming Bear Cycle is concerned, the 0.236 Channel Fibonacci level is the strongest candidate as virtually all major corrections since 2011 have hit that trend-line before the market bottomed. As this chart shows, the 0.236 Fib level has been touched 6 times since 2011, with the market hitting at least its 1M MA50 (blue trend-line) in the process on a minimum -50% decline. The 1M MA100 (green trend-line) has been its true long-term Support since July 2016.
As a result, it is highly probable that Micron drops below the 1M MA50 and hits the 0.236 Fib at around $140 before the market bottoms and turns into a long-term Buy again. At the same time, it is useful to keep an eye on the 1M RSI and Support Zone 1. This has given the last 3 major Buy Signals since December 2018. As a result, if the stock hits that level before reaching $140, we will turn into long-term buyers regardless of the price.
---
** Please LIKE 👍, FOLLOW ✅, SHARE 🙌 and COMMENT ✍ if you enjoy this idea! Also share your ideas and charts in the comments section below! This is best way to keep it relevant, support us, keep the content here free and allow the idea to reach as many people as possible. **
---
💸💸💸💸💸💸
👇 👇 👇 👇 👇 👇

MU long-term TAMicron is one of the strongest among semis, there's no need to wonder why it's holding up so good, it has plenty of heavy bullish volumes on weekly time frame which have started to correct recently yes, to be more precise since last week the mid-term has initiated the distribution, so now MU needs some time to balance everything. Watch the blue lines for the support to hold.

MU - 160 / 260 Strangle Iron Condor IVR has expanded heavily in MU over the past several trading days.
Going to sell some options outside the 1 standard deviation in December to try and capture a IV contraction ..

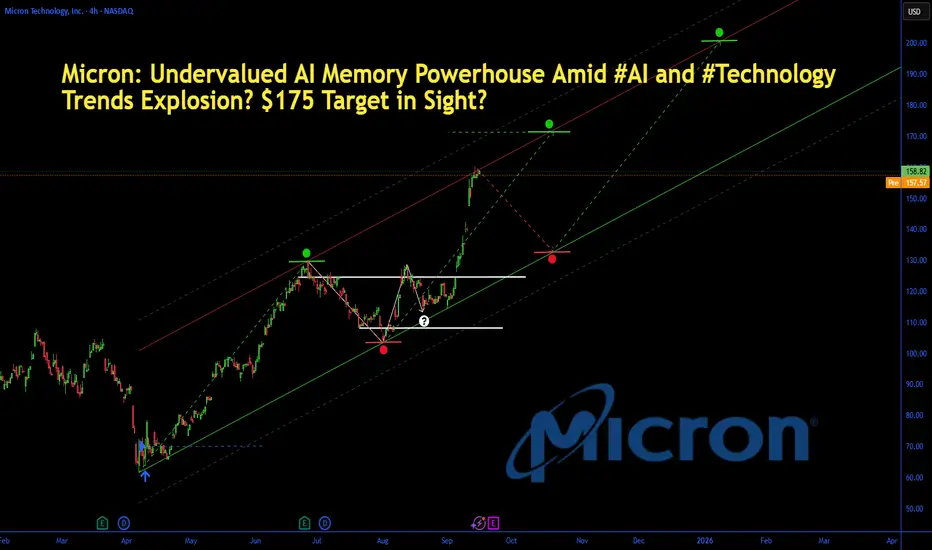
Micron: AI Memory Powerhouse Amid #AI and #TechnologyMicron: Undervalued AI Memory Powerhouse Amid #AI and #Technology Trends Explosion? $175 Target in Sight?
Micron (MU) shares hit a new 52-week high of $158.28 today, up 1.2% amid surging AI data center demand and institutional buying, with the stock soaring 86.8% YTD on memory chip tailwinds.
As Q4 fiscal 2025 earnings loom on September 23—projecting 58% EPS jump to $1.29 on $8.7B revenue—analysts have hiked targets to $175, implying 10%+ upside. Just as #AI racks up 17K mentions and #technology trends with 46K on X today (fueled by AI video generators and chip hype), Micron's HBM3E tech for Nvidia GPUs positions it as the undervalued play in the $200B+ semiconductor memory market.
But with forward P/E at 12x, is MU set to ride the AI wave higher, or will supply gluts cap the rally? Let's unpack the fundamentals, SWOT, charts, and setups for September 17, 2025.
Fundamental Analysis
Micron's resurgence is driven by AI hyperscaler demand for high-bandwidth memory (HBM), with Q2 fiscal 2025 revenue hitting $9.3B (up 93% YoY) and data center sales doubling to $2.2B.
Analysts forecast 2025 revenue of $38.5B (up 50% YoY), as HBM capacity ramps to 250K wafers amid #AI trends exploding on social media. Trading at 18% below fair value per DCF, MU's undervaluation shines with gross margins rebounding to 37%—but cyclical DRAM risks could flare if PC demand softens.
- **Positive:**
- AI boom ties into today's #technology hype, with HBM3E sales projected at $2.5B in FY2025; institutional stakes rising signal confidence.
- Q2 EPS beat of $1.18 (vs. $1.00 est.) and $1.6B FCF undervalues the stock at 12x forward earnings vs. sector 25x.
- Broader trends in edge AI and automotive chips position MU for 20%+ CAGR, amplified by #AI video generator virality.
- **Negative:**
- Inventory overhang from prior cycles could pressure pricing, clashing with #technology optimism if China trade tensions escalate.
- High capex ($8B annually) strains balance sheet if AI adoption slows amid economic jitters.
SWOT Analysis
**Strengths:** Leadership in DRAM/NAND with 20%+ market share; AI-optimized HBM tech generates 50%+ gross margins, amplified by #AI relevance in data centers.
**Weaknesses:** Cyclical exposure to consumer electronics; $7.8B net debt limits agility in a volatile #technology market.
**Opportunities:** HBM ramp to meet Nvidia/AMD demand unlocks $5B+ revenue; undervalued at 12x P/E amid 58% EPS growth and #AI boom on X.
**Threats:** Supply chain disruptions from geopolitics; competition from Samsung/SK Hynix capitalizing on #technology trends.
Technical Analysis
On the daily chart, MU is in a parabolic uptrend, breaking 52-week highs after consolidating above $140 support, with volume exploding on AI news and mirroring #AI volatility spikes. The weekly shows a cup-and-handle breakout from summer lows, now accelerating higher. Current price: $158.28, with VWAP at $156 as intraday pivot.
Key indicators:
- **RSI (14-day):** At 74, overbought but fueled by momentum—watch for consolidation amid #technology surges. 📈
- **MACD:** Bullish crossover with surging histogram, confirming AI-driven acceleration; minimal divergence. ⚠️
- **Moving Averages:** Price crushing 21-day EMA ($145) and 50-day SMA ($130), golden cross locked in.
Support/Resistance: Key support at $150 (recent breakout and 50-day SMA), resistance at $165 (Fib extension) and $175 (analyst target). Patterns/Momentum: Cup-and-handle targets $200; strong buy signals. 🟢 Bullish signals: Volume on earnings hype. 🔴 Bearish risks: Overbought RSI could pull back 5-8% on profit-taking.
Scenarios and Risk Management
- **Bullish Scenario:** Smash $165 on earnings beat or #AI catalyst targets $175 short-term, then $200 by year-end. Buy dips to $150 for entries tied to tech trends.
- **Bearish Scenario:** Breach $150 eyes $140 (200-day EMA); supply news amid #technology fade could retrace 10%.
- **Neutral/Goldilocks:** Range-bound $150–$165 if data mixed and #AI cools, ideal for straddles pre-earnings.
Risk Tips: Set stops 3% below support ($145.50) to tame volatility. Risk 1-2% per trade. Diversify with NVDA or SMH to hedge semi correlations.
Conclusion/Outlook
Overall, a bullish bias if MU holds $150, supercharged by today's #AI and #technology trends, cementing its undervalued status with 40%+ upside on memory demand. But watch September 23 earnings for confirmation—this fits September's chip rotation amid viral AI hype. What’s your take? Bullish on MU amid #AI chip trends or fading the rip? Share in the comments!
Buckle Up Buttercup - The Trend is Your FreindMU looking very powerful here on a monthly, quarterly and yearly chart. Intrinsic Value also values MU much higher. Stay tuned.

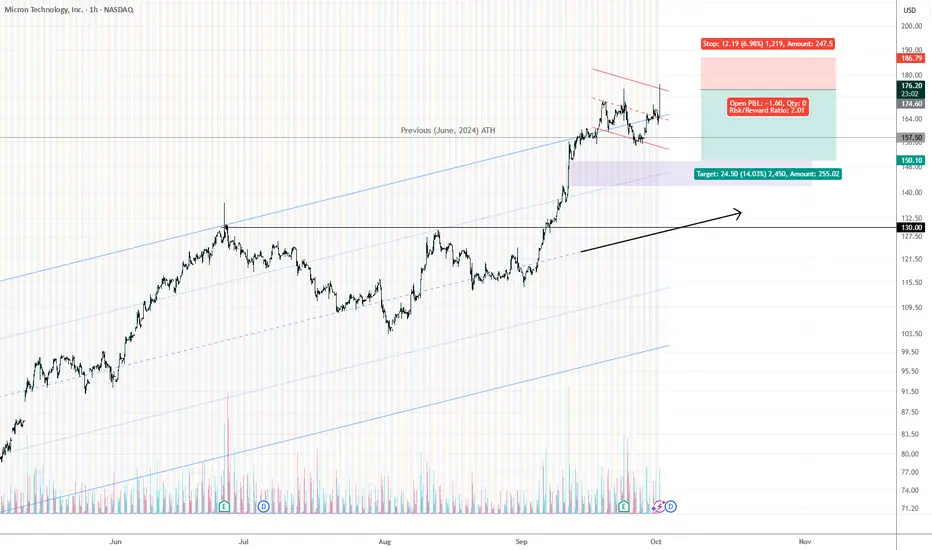
MU — Short: overboughtMU — Short: overbought → fade back into the channel
Context: After an extended run, price is stretched above the rising channel; local distribution under a minor descending channel. Expect mean-reversion back inside the broader channel.
Entry: 174–176
Stop: 186.8 (above channel top / recent spike)
Targets:
TP1: 157.5 (previous ATH / first support)
TP2: 150.0 (testing psycho level)
R/R: ≈ 1:2 toward TP2
Invalidation: Strong breakout and hold above 186.8.
Micron Technology - New all time highs!💰Micron Technology ( NASDAQ:MU ) is heading for new highs:
🔎Analysis summary:
More than a decade ago, Micron Technology entered into a significant long term rising channel pattern. Recently, we witnessed an expected rally of about +120%, perfectly rejecting support. But with the current all time high retest, we will also see a bullish breakout in the near future.
📝Levels to watch:
$140
SwingTraderPhil
SwingTrading.Simplified. | Investing.Simplified. | #LONGTERMVISION

Macro & Technical Signals: IWM, Uranium, Dollar, Oil, ALAB, LULUIn todays video we discuss the breakdown in small caps and high beta stocks.
A macro shift could be unfolding today as we saw the dollar & oil rally all day.
Uranium & gold saw some distribution.
Financials reversed off the highs.
High Beta stocks that have rallied are softening up.
SPX has triggered a near term bearish pattern while losing the 7 day MA.

Pre Market Movers and News - BABA SurgingDiscussing some of the news related events today.
What do traders need to watch today?
Looking at SPY, Oil, Baba, NVDA, BE, MU, LAC

Micron Tech. to $285MU is targeting $285, with it's new support zone from $167.
Like every other tech stock it's important to note there's a big pullback coming likely the end of this year/beginning 2026. However I'm quite confident MU will reach it's target before that happens.
Good luck!

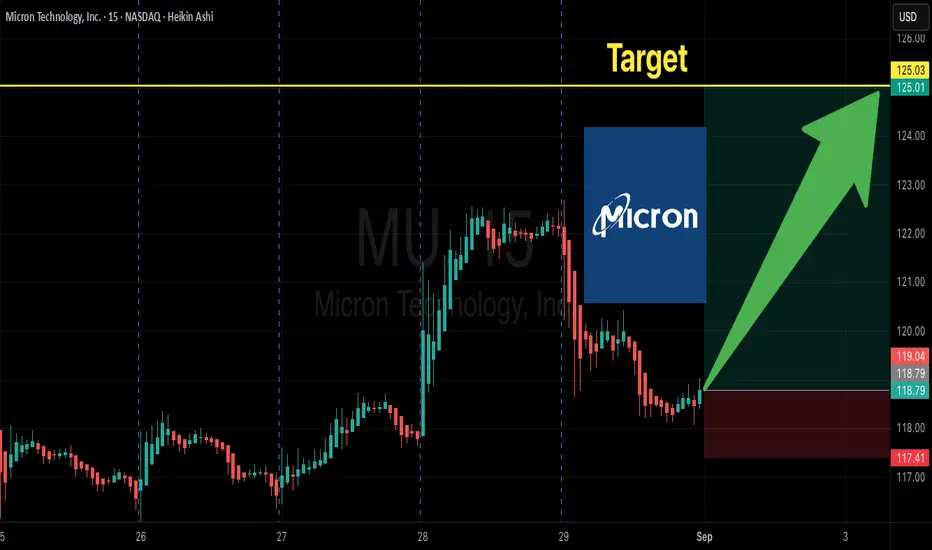
Smart Money Flow into $MU Calls – Earnings Week Opportunity
# 🚀 MU Earnings Play (Aug 31 – Sep 5) 🚀
💎 **Moderate Bullish | 65% Conviction** 💎
🎯 **Trade Setup**
📊 **Ticker**: \ NASDAQ:MU
🔀 **Direction**: CALL 📈
🎯 **Strike**: \$125.00
📅 **Expiry**: 2025-09-05
💵 **Entry**: 0.68 (ASK)
📦 **Size**: 1 contract (risk 💸 \$68)
🛑 **Stop**: 0.34 (−50%)
🎯 **Target**: 1.36 (+100%)
⏰ **Timing**: Market open 8/31 → exit by 9/4 (Thu)
⚡ **Why Bullish?**
* 📈 RSI strong on weekly (68.7); neutral daily (52.3) → upside potential
* 🔥 Options flow: C/P ratio 1.23, heavy \$124–125 call action
* 🧘 Low VIX (\~15) → cheap premium, low gamma risk
* 🤖 Consensus from 5 AI models = **Moderate Bullish**
✅ **Plan**: Buy ONLY if MU holds above **\$120** w/ healthy opening volume. Cut fast if <\$120.
---
### 📌 Suggested Tags
\#MU #Micron #EarningsPlay #OptionsTrading #CallOptions #WeeklyOptions #BullishSetup #MomentumTrading #TradeIdeas #StockMarket 🚀📊
Nvidia & Nasdaq History - What you need to know!Record-high share price: NVDA hit a new all-time high as U.S. stock markets rallied and Wall Street analysts forecast continued upside
Nvidia is pushing towards the first ever $4 Trillion market cap.
Today it surpassed MSFT as the largest company in the world closing up over 4% on the session.
Micron earnings are adding extra fuel to the fire for semi conductors.
Short term picture for semis - they're very extended and need some consolidation.
Micron earnings: Revenue: $8.05 billion, up ~38% YoY, beating the ~$7.89 billion consensus
Data‑center revenue: Tripled YoY, powered by surging demand for high‑bandwidth memory (HBM)
HBM sales: Exceeded $1 billion, growing over 50% sequentially
Strong margin and revenue beat; robust cash flow (~$857 million free cash flow) with a solid balance sheet ($9.6 billion in liquidity)

Micron Technology (MU) – Powering the AI Memory SupercycleCompany Overview:
Micron NASDAQ:MU is a crucial player in the AI infrastructure stack, providing advanced DRAM, NAND, and NOR flash memory solutions that fuel everything from data centers to mobile edge devices.
Key Catalysts:
AI-Driven Memory Demand ⚙️
High-Bandwidth Memory (HBM) adopted in AI accelerators from Nvidia, AMD, Broadcom, and Marvell.
Positions Micron at the core of the AI supply chain, reducing exposure to chip cycle volatility.
Data Center Surge 📈
Data center DRAM revenue tripled YoY in Q2 2025, driven by hyperscaler AI infrastructure upgrades.
Strengthens revenue diversification and margin profile.
Technology Leadership 🔬
Launch of 1-gamma DRAM node and LPDDR5X samples enhances mobile, cloud, and auto capabilities.
Keeps Micron on the cutting edge of memory innovation.
Investment Outlook:
Bullish Case: We remain bullish on MU above $95.00–$97.00.
Upside Target: $155.00–$160.00, supported by AI compute growth, hyperscale momentum, and next-gen product launches.
💡 Micron is not just riding the AI wave—it’s building its memory core.
#Micron #MU #Semiconductors #AI #HBM #DataCenter #DRAM #NAND #Nvidia #AMD #Hyperscalers #TechLeadership

Micron's Time to Be THAT Semiconductor is coming and FastNASDAQ:MU is extremely undervalued, I produced this chart last night. Its time that the market appreciates this monster with such solid fundamentals. Micron since 2022 has been working hard to become a major producer in the United States. I believe that Trump and his government could get behind the only major memory company to be based in the United States.
-----------------------
Balance Sheet:
Cash: $8.22b
Debt: $11.54b
Equity: $48.63b
Total Liabilities: $24.42b
Total Assets: $73.05b
All Stated in $ USD
-----------------------
Valuation:
Price To Sales: 2.72
Price To Earnings: 18.30
Forward Price To Earnings: 6.84
-----------------------

Micron Technology (MU): AI Powerhouse Trading at a 40% Discount!1️⃣ AI Boom: Micron’s advanced DRAM and NAND solutions are fueling growth in AI and cloud computing, with Nvidia’s ecosystem showcasing its critical role.
2️⃣ Analyst Targets: With 42 ratings averaging $131.47 and highs of $150, Micron offers over 50% upside from current levels.
3️⃣ Automotive Growth: As the top memory supplier for autonomous vehicles, Micron dominates a market set to grow at a 27% CAGR.
4️⃣ Technical Momentum: Breaking $75 resistance, a golden cross and rising volume confirm strong bullish signals.
💹 Trade Setup:
TP1: $100
TP2: $110
TP3: $120
SL: $80
Micron is a top-tier AI play at a deep discount. With massive growth catalysts, it’s primed to soar! 🚀

Micron Technology - Fully Resisting The Stock Market Crash!Micron Technology ( NASDAQ:MU ) is one of the few bullish stocks:
Click chart above to see the detailed analysis👆🏻
Despite the stock market kind of "crashing" lately, Micron Technology is one of the few stocks which remains in a rather bullish environment. Following the uptrend, the bullish break and retest and the beautiful cycles on Micron Technology, this strength will soon become reality.
Levels to watch: $90, $180
Keep your long term vision,
Philip (BasicTrading)

MU, bound for more significant RISE ahead this 2025! from 100.Micron Technology, Inc. is an American producer of computer memory and computer data storage including dynamic random-access memory, flash memory, and solid-state drives. It is headquartered in Boise, Idaho.
Based on latest metrics, MU is now at basing zone finally after experiencing heavy downtrend since last years peak at 153 on June 2024.
The stock is currently on a massive SHIFT in trend hinting of a weighty reversal to the upside. It already bounced more than 20% from its lows at 80 levels since late last year.
Fridays' closing price of +6% is already conveying its directional context for the rest of the year -- more RISE ahead.
Also factoring its last QTR Results which are all in greens.
(USD) Nov 2024 Y/Y
Revenue 8.71B 84.28%
Net income 1.87B 251.54%
Diluted EPS 1.67 249.11%
Net profit margin 21.47% 182.23%
Operating income 2.17B 292.73%
Net change in cash -355M 30.39%
Cash on hand - -
Cost of revenue 5.36B 12.6%
----------------------------------
Spotted price at 100.
Interim target at 150
Mid at 200.
TAYOR. Trade safely.


Micron (MU) Stock Update: Correction or Collapse?Morning Trading Family
Here's what's up with Micron (MU): If it bounces back at 92, cool. But if it keeps going down, it might hit 89-90 before it stops. If it drops past that, we might see it go to 84 or even 80. This could be a big moment for MU, so keep watching!
Kris/Mindbloome Exchange
Trade What You See

MU LIVE PRICE ACTION DEC 10 2024Welcome to price action analysis of MU. It has dipped 4 %today and alot of people are worried. If you know your levels then you should not be worried.
I have clearly discussed the entries , SLs & targets. If you have any doubts then feel free to leave a comment

Micron Technology ($MU): Strategic Buy with AI-Driven UpsideMicron Technology ( NASDAQ:MU ): Strategic Buy with AI-Driven Upside
Trade Setup:
- **Buy Price:** $98.66
- **Stop-Loss:** $84.68
- **Take-Profit:** $160 to $180
**Rationale:**
Micron Technology, a leader in memory and storage solutions, is poised to benefit from the growing demand in artificial intelligence (AI) applications. The company's advancements in high-bandwidth memory (HBM) position it favourably within the semiconductor industry.
**Financial Performance:**
In fiscal Q4 2024, Micron reported revenue of $7.75 billion, a significant increase from $4.01 billion in the same period last year. The GAAP net income was $887 million, or $0.79 per diluted share, marking a substantial turnaround from the previous year's loss.
**Analyst Insights:**
Analysts have set a 12-month average price target of $146.28, with estimates ranging from $90 to $250, indicating a potential upside of approximately 48% from the current price.
**Risk Management:**
The stop-loss at $84.68 helps mitigate downside risk, while the take-profit range of $160 to $180 offers a favorable risk-reward ratio.
When the Market’s Call, We Stand Tall. Bull or Bear, Just Ride the Wave!
*Disclaimer: This analysis is for informational purposes only and does not constitute financial advice. Traders should conduct their own due diligence before making investment decisions.*

MU going for goldAt the third double bottom teasing 114.17 breakout to gap fill, it would be nice to see continuation here and what happens at 107.94 (monthly pivot). This one started with a breakaway gap September 25th and has recently filled the runaway gap, but the bullish trend is still intact from the current double bottom. I'm looking for 01/17/25 105c here, with a stop-loss at 99.05 (monthly pivot).
