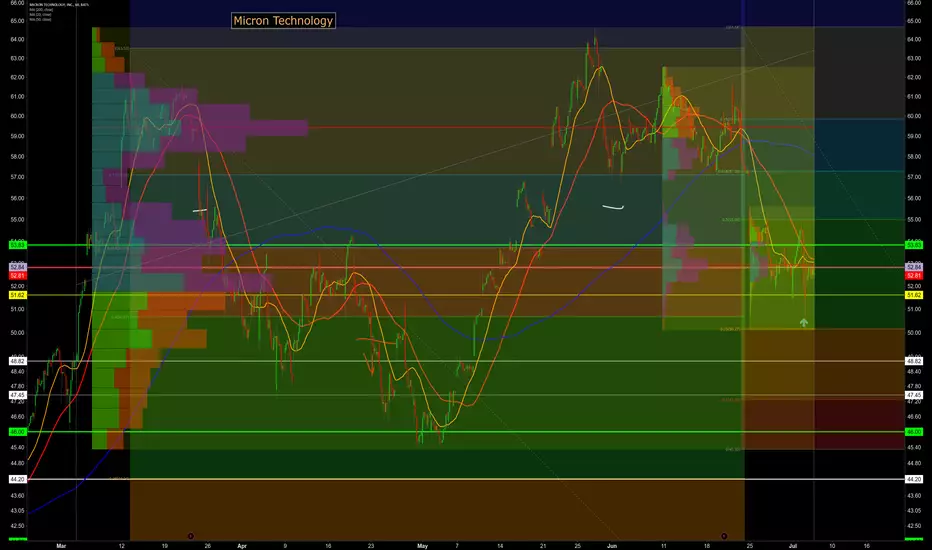
Micron. Held 52.80.. Insane growth soon?!?Long term volume profile sets MU at a pack to shoot up towards almost 60.00. With the baseline of~51.00-52.85. We have held this price. If people buy in early today, we could see something amazing.
Every line from before will most likely still be in play. I think the opening bell will determine what happens here. Will they sell down or buy up? From there i think the market will follow that direction.
It looked so bad, but its held its price around 52.84 instead of ending yesterday around the yellow line at 51.62 (under big resistance)
I have stuff I promised to do today. I will not be away from my computer on a trading day again. So this will not happen again. A rare situation. I am sorry for this.
What i expect o happen. Buy up to 52.98. Bounce ontop of 52.81. Rise to 54.14-55.00. Drop to 53.83. Rise to 58.25. Drop to 57.10-57.29
Then I believe it will have a real fight again of actual bulls vs bears.
Micron

MU Daily Chart Analysis - 29th JunePutting MU in my watch list for a potential bounce at the trend line. Could be end of a retracement wave and start of a new Impulse wave

$MU: Buy on dips, yearly uptrend active...$MU is now cash positive, doing great progress in containing debt and investing in CAPEX. They have a significant advantage in the NAND space and are investing heavily in it. Very good valuation here, and trending up, an easy buy for the long term.
Cheers,
Ivan Labrie.

MU - How about them waffers?Just like the DJI im so annoyed about hearing how the price went down because of XYZ, when you then look at the chart and go.. "hmm.. it looked like it was going to do that anyway."
Believe in insider trading and that the market is smarter than you. If you believe this, you believe in the charts. Charts do not lie, they are only misunderstood.
Ok, so anyway Im just putting charts of all 100 things i follow. I know there are many good micron charts, so I'd recommend looking at those too.
These lines were all here before the trend touched them after the drop from 63.53 in march. Not after. What this means is that the movement is not so much predictable to the t, but it is easy to follow and gauge where the good areas are.
We are not testing the .618 after failing to pass into new highs and hold the .75
What I now want to see is the price hold here now that it has found resistance on the 50 day MA.
My initial though for a buy point was the green line (53.83 and 52,81) with 50% buys on each. As it is now, If my money was in MU, I would sell out and wait to see.
Im starting to feel that the next two buy spots seem to be 51.62 and 50.17 for the next bullish run upwards towards at least 57.00.
But based on how much people froth at the mouth over micron, I think from 50.17-50.67 well see a bull repeat of what we saw last month.
Oh yeah i forgot to look at things like the earnings report (I just looked at it while writing this). It is kind of funny how i've looked at stocks for about a month and it took me 2 days to figure out that its more often than not, its good to sell around earnings reports, even when the report is good.
Take care yall
-KTown

Micron Brief ($MU) For a brief overview and risk see:
drive.google.com
Micron has been a solid value play for the majority of the 2017 tech run and I think it's worth looking at the current standing and valuation as of current, should you choose to stay long tech into 2019.
Micron had a $2.5 EPS just 90 days ago with a PE of just over 8. MU reported FQ4 guidance Rev/EPS @ 8.2bn / $3.30 substantially higher than expected nearing 8bn / $3.1.
As expected, MU outperformed AMD with DRAM up 6%, "Hyperscale" applications up ~30% q/q and seems to be able to meed the N AND expectations of 45% y/y.
After looking at the current standing, I do feel like the is still room for MU to grow, at least into FQ2/FY19. Trading at 4.78x PE and 5.0x EV/FCF, the valuation isn't as overheated as the rest of the major tech plays - and is actually very appealing. Q3 is to turn MU net cash positive and there is to be a ~1bn buyback in September.
I also feel like CapEx and operational, investments are being implemented fruitfully with 'incremental cleanroom space' in Hiroshima, Japan, which will be available for production at the beginning of calendar year 2019 For FY2018, with expected capital expenditures to be in the upper end of previously guided range of $7.5 billion, plus or minus 5 percent.
-DRAM outlook is still looking good with 19% in DRAM shipments.
-64L Bit crossover completed one Q ahead of schedule.
i.magaimg.net
However, its important to consider the cyclical nature of semiconductors:
The DRAM and NAND Flash business is cyclical in nature with each cycle comprising of four phases:
- Increased demand, high profitability: Market is in under-supply with strong pricing and hence, high profitability. Profits are spent on capacity addition, with increase in supply after a period of 8-12 months.
- Oversupply and losses: Market is marked by oversupply and falling ASPs. Focus is on driving cost efficiencies.
- Continued oversupply, losses run deeper: Demand is pushed a little higher due to price elasticity. ASPs continue to fall and approach cash cost levels. CapEx is delayed and fabrication units are run at lower capacity.
- Supply correction, return to profitability: Reduced supply leads to correction and demand sufficiency. ASPs see correction or possible rebound while costs continue to decline. CapEx spending starts again.
The market was in the continued oversupply and losses phase till 2012, but entered the correction and profitability phase in 2013. The market is now in the supply correction phase, and the demand is both DRAM and NAND Flash is expected to outpace supply in the near future
Quoted SOTP valuation metrics put MU at $64 - 70 and street expectations near $80 with higher interval ranges nearing $90. I am staying long the stock but expectations remain low due to the possibility of the Chinese "market access liberalisation" policy, tariffs on Semi's and concerns regarding the flash/chips pricing structure and whether the major players have been inflating prices.
Tim Arcuri's comments are worth considering with a discount, however the probability of a large scale correction in memory is rather low, especially in the short run.
"chip memory is replacing disk in both clients and servers, and it has become cost-efficient for cloud."
I do think the street is correct on this one, however I would be pleasantly surprised if MU reached Stiful's Analyst's Targets at @ $106.
I may post a model later.

MU Looking Good To Test New Highs Next WeekMU had a great week, retracing to 0.382 then back to 0.236 then back and forth again to then finish the week breaking out from the resistance found at the ~60$ area and stop at the 0.618 retracement level, also closing the gap down opened two weeks ago. For next week, Micron may find some resistance at the 61.80 to 61.90 area and come back to test the 61.60 to 61.40 area (or even the 60$) before doing the complete retracement towards 64$ (which I think it will happen this week).
In my previous post on MU last monday, I pointed that the third impulse wave could be about to start, which indeed this week's action seems to confirm.

MU bearish divergenceAs I have a feeling everything is drying out I need to look at more to find a decent amount of opportunities.
I am not trading this, just checking what is going to happen to see if this can be a trade opportunity, next time.
Is the price going to retrace with this RSI thing?
Where too.
Going to check back in a couple of weeks see what happened.

MU Double Bottom Swing TradeMU Looks to have made a double bottom on the hourly and retested the 68.20% fib retracement to perfection. Depending how this hourly closed I think theres room to the upside.

$MU return to 252 area?Bad news recently. This one is on watch. It could come down to retest support levels. Would enter a long then.

Update on the MU trade
Update (5/31): Closed this position for a 3X. and bought in the 56 PE that expired next week
------------------------------------------------------------------------
I think we can short MU here for a tgt of 56 and a stop loss of today's high of 64.5.
CMP is 62.8
I have personally bought 59 Puts expiring next week.

MU : Support and resistance with range of motionMU H4 chart
The upward movement continues on the red support line
If it break the red and blue support lines broke, it is the place I mark the possible movement area.
***This information is not a recommendation to buy or sell. It is to be used for educational purposes only.***
I'm sorry for the impaired expression..Just watch the chart, not what I write. :)
PS make sure you give me a like, If you LIKE this analysis .... If you like most of my analyzes, FOLLOW me .


Short MU for the short TERM!I think we can short MU here for a tgt of 56 and a stop loss of today's high of 64.5.
CMP is 62.8
I have personally bought 59 Puts expiring next week.

mu pull back and breakWas waiting to short MU, Lets watch for a good entry on 15m chart. Will wait for the pull back to structure/618 then short. Expect it go to Fib extension 1.2/1.4 levels!

#MUSelling Zone approaching...Im out of Micron.Will buy the pull back or wait...
Expect to go down to 56.4 then...54.3.
Let us watch.....

Micron FIb 2018 Price TargetsMicron looks to have made a lovely retracement. I would look to take advantage of the free money that MU is about to give us. Short term picture looks good. As well I am still bullish looking towards EOY.

Waiting for entry - Micron This is a great opportunity to enter a long position on Micron.
We have a bear and bull scenario, the bull one is the most likely.
Bull
We just finished the wave ((i)) of the wave 5 (one larger degree), so I'm expecting a correction between the 50% and 65% fib (49.42-$51.15). Why? Because:
-4H RSI broke this ((i)) wave support
-Second waves usually retrace deeply the first one.
-Strong resistance in the golden pocket (65-61.8%), plus the 200 EMA
-Golden cross (8,13 and 21 EMA crossed the 55 EMA (although not with great volume).
Bear
We actually only finished the B wave of the correction and we're retracing towards $43.11.
However, I'm pretty sure we're on the bull scenario because of the good media coverage and good fundamentals. Can't see Micron retracing more than 49. My targets are 61.38 (very likely), 68.5 (likely) and 80 (only If we hit 68.5 in the ((iii)) wave (pink). So, a good setup is to ladder buy from 51.5 to 49.5 with a stop loss on 47.5, giving us a nice 4.35 RRR taking profit on 61.38 (the most conservative target).
I would not hold or enter a long position above 80, because that's the resistance of the channel that begun back in 2008.
This is only my opinion, trade at your own risk.

MU Prediction UpdatedWell this is what I see on MU. Looks to me that it will complete its right arm of a head and shoulders top and head down for a bit. Only time will tell.
Thanks.


Why i like $MU here$MU held the 100MA and seems to be holding long term support. Any where between green line and 100ma offers a opportunity to go long. Market has been choppy, so make sure to manage risk carefully. Good Luck. I recently went long.

$MU Ready to Bounce!We're at a good support level and the 1h RSI is oversold. Expected bounce tomorrow and we'll probably reach $50 this week (previous resistance). Nice swing trade opportunity. Happy trading :)

Trades are not always perfect..But it is good to see some support on #Micron around the $50 price level. If market conditions continue to improve, then I think this one has more upside potential.
