Micron Technologies ¦ Accumulation → Re-Accumulation Power Setup📈 Asset: MU — Micron Technology, Inc. (NASDAQ)
🎮 Strategy Style: Stock Market Profit Playbook (Swing Trade)
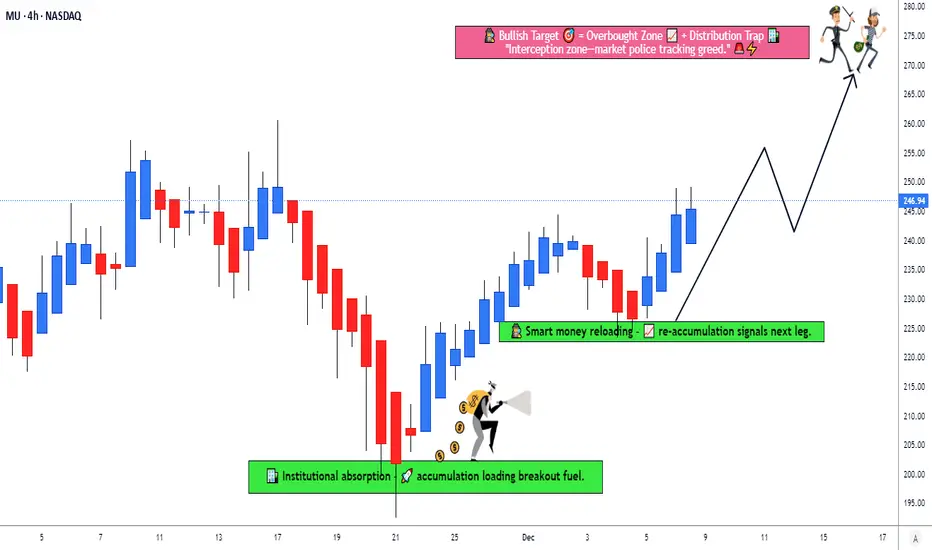
💼 Structure Bias: Bullish continuation confirmed through accumulation → re-accumulation phase, showing sustained demand and smart-money support.
🧤 THIEF PLAYBOOK PLAN
The bullish structure is validated as MU continues to build strength within an accumulation base, followed by a clean re-accumulation zone, signaling institutional demand stepping back in. Buyers are quietly stacking positions — a classic power shift before the potential continuation leg. ⚡📊
🎯 ENTRY PLAN — Thief Layer Strategy
This trading style uses multiple layered limit orders to accumulate a position across different prices.
This method is known as a layering strategy / scaling-in entry method.
My thief-style sample layers (modify as you prefer):
🧤 Buy Limit Layer 1: 225.00
🧤 Buy Limit Layer 2: 230.00
🧤 Buy Limit Layer 3: 235.00
🧤 Buy Limit Layer 4: 240.00
(📌 You can adjust or increase layers based on your own plan.)
🛡️ STOP-LOSS (Thief SL Version)
This is my personal plan only — Thief SL @ 270.00
📌 Dear Ladies & Gentlemen (Thief OG’s), I am not recommending using my stop-loss.
Trade your own risk management and personal preference.
🎯 TARGET — Overbought Zone + Resistance Trap
Price faces a major police-force resistance zone where overbought conditions + liquidity traps are likely.
So the safe exit for me:
💰 Target (TP): 210.00
📌 Dear Ladies & Gentlemen (Thief OG’s), take-profit is fully your choice — take money when you see money.
🌍 CORRELATED PAIRS TO WATCH (Key Notes)
Tracking related tickers helps confirm momentum and sector strength.
🔥 Semiconductor / Tech Correlation Watchlist
NASDAQ:NVDA (NVIDIA):
Strong sector leader — if NVDA holds uptrend, MU often mirrors relative strength.
NASDAQ:AMD (Advanced Micro Devices):
Shares similar demand cycles; strong AMD = rising semiconductor sentiment.
NASDAQ:SMH (Semiconductor ETF):
Great macro confirmation tool — ETF flows show sector-wide accumulation.
NASDAQ:SOXX (iShares Semiconductor ETF):
Helps validate whether the entire chip sector is trending or pulling back.
NASDAQ:INTC (Intel):
Not perfectly correlated but useful for observing competitive pressures & rotation.
📌 Key Insight:
If sector ETFs ( NASDAQ:SMH / NASDAQ:SOXX ) continue printing higher lows, MU’s re-accumulation thesis gains more strength.
If NVDA + AMD break down together, MU may enter deeper discount zones — helpful for thief layered entries.
✨ “If you find value in my analysis, a 👍 and 🚀 boost is much appreciated — it helps me share more setups with the community!”
⚠️ Disclaimer
This analysis is for educational purposes only.
This is a thief-style trading strategy just for fun — trade at your own risk and manage your own decisions responsibly.
#MU #Micron #SwingTrade #StockMarket #NASDAQ #LayeringStrategy #Accumulation #ReAccumulation #TechnicalAnalysis #TradingView #ThiefStrategy #Semiconductors #NVDA #AMD #SMH #SOXX #PriceAction #EditorPickReady 🚀
Micronasdaq
Micron (MU) Trade Plan | Resistance, Pullback & Thief Setup📊 Micron Technology (MU) | Thief Plan Swing/Day Trading Setup
⚡ Why This Plan?
Micron Technology (MU) has been showing strong momentum in 2025, driven by AI demand, DRAM revenue growth, and favorable fundamentals. The Thief Plan Strategy (layering entries + tactical exits) is designed to adapt to both swing & day trading setups, balancing technical signals with fundamental catalysts.
🎯 Thief Technical Trading Plan
Strategy: Hull Moving Average Pullback ➝ Bullish Bias
Entry Method (Layering Style): Multiple buy limit layers
$122.00
$124.00
$126.00
$128.00
(You may increase/decrease layers based on your own plan & risk)
Stop Loss: Thief SL reference @ $115.00
Adjust based on your own risk tolerance & style.
Target Zone: $146.00 (resistance barricade / overbought trap zone — best to “escape” before exhaustion).
⚠️ Note: These levels are educational references. Manage your own SL/TP — trade at your own risk.
📈 Fundamental & Sentiment Insights
52-Week Range: $61.54 – $131.41
Market Cap: $147.02B
YTD Performance: +50.4% 🚀
Investor Sentiment:
Analyst Consensus: Moderate Buy 🟢
21 Buy | 5 Hold | 1 Sell | 2 Strong Buy
Avg. PT: $147.54 (+12.3% Upside)
Institutional Ownership: 80.84%
Fear & Greed Index: 39/100 → Fear 😨
Earnings & Growth:
Q3 FY2025 EPS: $1.91 (Beat by $0.34)
Revenue Growth YoY: +58.2%
DRAM Revenue: +51% YoY (AI-driven)
Net Margin: 18.41%
Debt-to-Equity: 0.30 (healthy)
Dividend Yield: 0.4%
🌍 Macro & Market Drivers
AI Boom: HBM demand projected at $10B run-rate.
Data Center DRAM: +63% YoY expected in Q4 FY2025.
US CHIPS Act & Tariffs: Long-term tailwinds for domestic semiconductor players.
Competition: Samsung & SK Hynix applying pressure on margins.
🐂 Bullish vs 🐻 Bearish Outlook
Bullish Case (Long):
AI/Data Center demand ➝ strong revenue trajectory.
Valuation attractive (PE 23.6x vs peers 32x).
Analyst PTs reach as high as $200.
Bearish Case (Risk):
Memory market cyclicality ➝ volatile pricing.
Fear & Greed shows low confidence (39/100).
DCF suggests stock could be overvalued short-term.
📌 Summary
Outlook: Neutral ➝ Bullish short-term (AI strength offsets macro fear).
Catalyst: Q4 FY2025 Earnings (Sept 23, 2025).
Risk: Moderate (High Beta 1.47).
🔗 Related Assets to Watch
NASDAQ:NVDA - AI semiconductor sentiment indicator
NASDAQ:AMD - Semiconductor sector momentum
NASDAQ:SOXX - Semiconductor ETF for sector strength
NASDAQ:SMH - Alternative semiconductor ETF
NASDAQ:WDC - Memory sector correlation
✨ “If you find value in my analysis, a 👍 and 🚀 boost is much appreciated — it helps me share more setups with the community!”
#MU #Micron #Stocks #SwingTrade #DayTrading #ThiefPlan #Semiconductors #AI #TechStocks #TradingView

Analysis of MU Shares Following Earnings ReportAnalysis of MU Shares Following Earnings Report
Memory chip manufacturer Micron Technology (MU) published a positive financial report for Q4 of fiscal year 2025 on 23 September:
→ Q4 Revenue: Actual = $11.32 billion, up 46% compared with the same period last year.
→ Adjusted Earnings Per Share (EPS): Actual = $3.03 (analysts’ expectations = $2.87).
The main driver behind these strong results was heightened demand for high-performance memory needed for data centres and AI model training. Micron also published an optimistic outlook, forecasting revenue of between $12.2 billion and $12.8 billion in the next quarter.
Despite strong results and guidance, the share price reaction in the first week after publication has been moderate. Trading volumes were significantly above average, yet the price did not rise. Why?
1 → It is worth noting that Micron shares have nearly doubled in value since the start of 2025, which may indicate “bull fatigue.”
2 → A significant portion of the positive expectations tied to the AI boom is already priced into the current valuation.
Technical analysis shows more bearish signals.
Technical Analysis of MU Shares
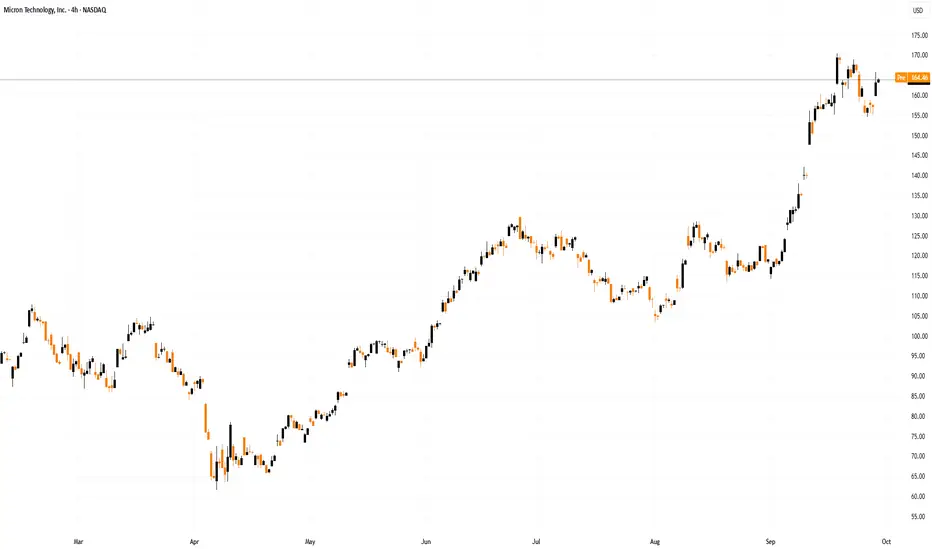
Since early April, Micron shares have shown staggering growth of approximately 150%, with:
→ Price fluctuations forming an ascending channel (shown in blue). After breaking through the key resistance level at $130 in early September, the price rose towards the upper boundary of the channel, which now acts as resistance.
→ During this rise, the price exceeded the previous all-time high; however, further progress has clearly slowed. It is possible that the news of the record high, combined with a strong earnings report, created a buying frenzy that allowed large shareholders to take profits, thereby placing pressure on the price.
From a bullish perspective, the chart shows a correction pattern in the form of a “bull flag” (marked in red), suggesting a potential breakout and continuation of growth.
However, given the above, there are grounds to expect a deeper correction — for example, towards the median of the current channel, supported by a wide $135–150 zone (marked in purple), where the price previously rose particularly quickly, highlighting an imbalance in favour of buyers.
This article represents the opinion of the Companies operating under the FXOpen brand only. It is not to be construed as an offer, solicitation, or recommendation with respect to products and services provided by the Companies operating under the FXOpen brand, nor is it to be considered financial advice.
Micron (MU) Stock Update: Correction or Collapse?Morning Trading Family
Here's what's up with Micron (MU): If it bounces back at 92, cool. But if it keeps going down, it might hit 89-90 before it stops. If it drops past that, we might see it go to 84 or even 80. This could be a big moment for MU, so keep watching!
Kris/Mindbloome Exchange
Trade What You See

Are we approaching the last cycle expansion phase?The last cycle expansion phase or the euphoric stage, has already occurred between 2020 and 2021.
Sir John Templeton said: “Bull markets are born on pessimism, grown on skepticism, mature on optimism, and die on euphoria.”
Reference of Nasdaq:
E-mini Nasdaq-100 & Opt
Minimum fluctuation
0.25 index points = $5.00
Micro E-mini Nasdaq-100 Index & Opt
Minimum fluctuation
0.25 index points = $0.50
Disclaimer:
• What presented here is not a recommendation, please consult your licensed broker.
• Our mission is to create lateral thinking skills for every investor and trader, knowing when to take a calculated risk with market uncertainty and a bolder risk when opportunity arises.
CME Real-time Market Data help identify trading set-ups in real-time and express my market views. If you have futures in your trading portfolio, you can check out on CME Group data plans available that suit your trading needs www.tradingview.com

Micron Tech - IN TROUBLE!!Micron Technology
Short Term - We look to Sell at 65.98 (stop at 69.58)
We look to sell rallies. Selling continued from the 61.8% pullback level of 85.74. Posted a Double Top formation. The formation has a measured move target of 46.09. Selling spikes offers good risk/reward.
Our profit targets will be 46.09 and 41.09
Resistance: 66.00 / 75.00 / 96.45
Support: 54.00 / 46.00 / 30.00
Disclaimer – Saxo Bank Group. Please be reminded – you alone are responsible for your trading – both gains and losses. There is a very high degree of risk involved in trading. The technical analysis, like any and all indicators, strategies, columns, articles and other features accessible on/though this site (including those from Signal Centre) are for informational purposes only and should not be construed as investment advice by you. Such technical analysis are believed to be obtained from sources believed to be reliable, but not warrant their respective completeness or accuracy, or warrant any results from the use of the information. Your use of the technical analysis, as would also your use of any and all mentioned indicators, strategies, columns, articles and all other features, is entirely at your own risk and it is your sole responsibility to evaluate the accuracy, completeness and usefulness (including suitability) of the information. You should assess the risk of any trade with your financial adviser and make your own independent decision(s) regarding any tradable products which may be the subject matter of the technical analysis or any of the said indicators, strategies, columns, articles and all other features.
Please also be reminded that if despite the above, any of the said technical analysis (or any of the said indicators, strategies, columns, articles and other features accessible on/through this site) is found to be advisory or a recommendation; and not merely informational in nature, the same is in any event provided with the intention of being for general circulation and availability only. As such it is not intended to and does not form part of any offer or recommendation directed at you specifically, or have any regard to the investment objectives, financial situation or needs of yourself or any other specific person. Before committing to a trade or investment therefore, please seek advice from a financial or other professional adviser regarding the suitability of the product for you and (where available) read the relevant product offer/description documents, including the risk disclosures. If you do not wish to seek such financial advice, please still exercise your mind and consider carefully whether the product is suitable for you because you alone remain responsible for your trading – both gains and losses.

Micron Technology: Scraping the Barrel Micron Technology
Short Term - We look to Buy at 66.22 (stop at 65.18)
We look to buy dips. Previous support located at 66.00. Although the anticipated move higher is corrective, it does offer ample risk/reward today. We therefore, prefer to fade into the dip with a tight stop in anticipation of a move back higher.
Our profit targets will be 73.13 and 74.49
Resistance: 74.00 / 86.00 / 96.00
Support: 66.00 / 61.00 / 42.00
Disclaimer – Saxo Bank Group. Please be reminded – you alone are responsible for your trading – both gains and losses. There is a very high degree of risk involved in trading. The technical analysis, like any and all indicators, strategies, columns, articles and other features accessible on/though this site (including those from Signal Centre) are for informational purposes only and should not be construed as investment advice by you. Such technical analysis are believed to be obtained from sources believed to be reliable, but not warrant their respective completeness or accuracy, or warrant any results from the use of the information. Your use of the technical analysis, as would also your use of any and all mentioned indicators, strategies, columns, articles and all other features, is entirely at your own risk and it is your sole responsibility to evaluate the accuracy, completeness and usefulness (including suitability) of the information. You should assess the risk of any trade with your financial adviser and make your own independent decision(s) regarding any tradable products which may be the subject matter of the technical analysis or any of the said indicators, strategies, columns, articles and all other features.
Please also be reminded that if despite the above, any of the said technical analysis (or any of the said indicators, strategies, columns, articles and other features accessible on/through this site) is found to be advisory or a recommendation; and not merely informational in nature, the same is in any event provided with the intention of being for general circulation and availability only. As such it is not intended to and does not form part of any offer or recommendation directed at you specifically, or have any regard to the investment objectives, financial situation or needs of yourself or any other specific person. Before committing to a trade or investment therefore, please seek advice from a financial or other professional adviser regarding the suitability of the product for you and (where available) read the relevant product offer/description documents, including the risk disclosures. If you do not wish to seek such financial advice, please still exercise your mind and consider carefully whether the product is suitable for you because you alone remain responsible for your trading – both gains and losses.

MU time to buy?Micron Technology
Short Term - We look to Buy at 66.27 (stop at 64.82)
Preferred trade is to buy on dips. Previous support located at 66.00. Although the anticipated move higher is corrective, it does offer ample risk/reward today. Expect trading to remain mixed and volatile. Dips continue to attract buyers.
Our profit targets will be 71.40 and 74.49
Resistance: 74.00 / 86.00 / 96.00
Support: 66.00 / 61.00 / 42.00
Disclaimer – Saxo Bank Group. Please be reminded – you alone are responsible for your trading – both gains and losses. There is a very high degree of risk involved in trading. The technical analysis, like any and all indicators, strategies, columns, articles and other features accessible on/though this site (including those from Signal Centre) are for informational purposes only and should not be construed as investment advice by you. Such technical analysis are believed to be obtained from sources believed to be reliable, but not warrant their respective completeness or accuracy, or warrant any results from the use of the information. Your use of the technical analysis, as would also your use of any and all mentioned indicators, strategies, columns, articles and all other features, is entirely at your own risk and it is your sole responsibility to evaluate the accuracy, completeness and usefulness (including suitability) of the information. You should assess the risk of any trade with your financial adviser and make your own independent decision(s) regarding any tradable products which may be the subject matter of the technical analysis or any of the said indicators, strategies, columns, articles and all other features.
Please also be reminded that if despite the above, any of the said technical analysis (or any of the said indicators, strategies, columns, articles and other features accessible on/through this site) is found to be advisory or a recommendation; and not merely informational in nature, the same is in any event provided with the intention of being for general circulation and availability only. As such it is not intended to and does not form part of any offer or recommendation directed at you specifically, or have any regard to the investment objectives, financial situation or needs of yourself or any other specific person. Before committing to a trade or investment therefore, please seek advice from a financial or other professional adviser regarding the suitability of the product for you and (where available) read the relevant product offer/description documents, including the risk disclosures. If you do not wish to seek such financial advice, please still exercise your mind and consider carefully whether the product is suitable for you because you alone remain responsible for your trading – both gains and losses.

MU Rising Wedge BreakdownMU is within a rising wedge
Rising wedges are a bearish indicative pattern
I am suggesting a collapse down to a stronger area of support to manage this rising wedge
The other scenario is that this rising wedge breaks out to the bullish side, but for the consistency of chart pattern expertise we will stay with the bearish approach, which is considered appropriate.

micro nas. continue dropping or crawl out?US gov looks like it's going to raise the debt limit once again. This might serve to stabilize markets for the time being. I'm used to wathcing markets go up forever, I honestly don't know what's going to happen after big selloff like what we just saw.
New date to address debt limit is 12/22

MU AnalysisWill the open MA's lead to an upward breakout out of the rising wedge?
Or will the technical patterns ( rising wedge ) favored outcome arise? Bearish .
Personally I'd follow the Technical Indicator's assessment

$MNQ_F 3-Press Top Deep Dip For SellersPrice is beginning to show consolidation and range mentality. This could be a significant low reversal area in the bigger scope, but in the nearer term there is potential for a short push back. Normally, I would be looking for a move back to lows and potentially further but with the strength of the double bottom, I don't want to get caught getting stuck at the lows of a reversal which narrows in the targets for now.
