Micron Technology: Shooting Star at Resistance Micron Technology - Short Term - We look to Sell at 94.40 (stop at 99.20)
Posted a Bearish Shooting Star formation. This is a bearish reversal signal and the lack of progress higher has confirmed a sentiment shift. We look for losses to be extended today. 95.00 continues to hold back the bulls. The 50% Fibonacci retracement is located at 82.03 from 65.60 to 98.45. We look to set shorts in the early trade.
Our profit targets will be 82.10 and 77.00
Resistance: 95.00 / 100.00 / 110.00
Support: 85.00 / 80.00 / 75.00
Disclaimer – Saxo Bank Group. Please be reminded – you alone are responsible for your trading – both gains and losses. There is a very high degree of risk involved in trading. The technical analysis, like any and all indicators, strategies, columns, articles and other features accessible on/though this site (including those from Signal Centre) are for informational purposes only and should not be construed as investment advice by you. Such technical analysis are believed to be obtained from sources believed to be reliable, but not warrant their respective completeness or accuracy, or warrant any results from the use of the information. Your use of the technical analysis, as would also your use of any and all mentioned indicators, strategies, columns, articles and all other features, is entirely at your own risk and it is your sole responsibility to evaluate the accuracy, completeness and usefulness (including suitability) of the information. You should assess the risk of any trade with your financial adviser and make your own independent decision(s) regarding any tradable products which may be the subject matter of the technical analysis or any of the said indicators, strategies, columns, articles and all other features.
Please also be reminded that if despite the above, any of the said technical analysis (or any of the said indicators, strategies, columns, articles and other features accessible on/through this site) is found to be advisory or a recommendation; and not merely informational in nature, the same is in any event provided with the intention of being for general circulation and availability only. As such it is not intended to and does not form part of any offer or recommendation directed at you specifically, or have any regard to the investment objectives, financial situation or needs of yourself or any other specific person. Before committing to a trade or investment therefore, please seek advice from a financial or other professional adviser regarding the suitability of the product for you and (where available) read the relevant product offer/description documents, including the risk disclosures. If you do not wish to seek such financial advice, please still exercise your mind and consider carefully whether the product is suitable for you because you alone remain responsible for your trading – both gains and losses.
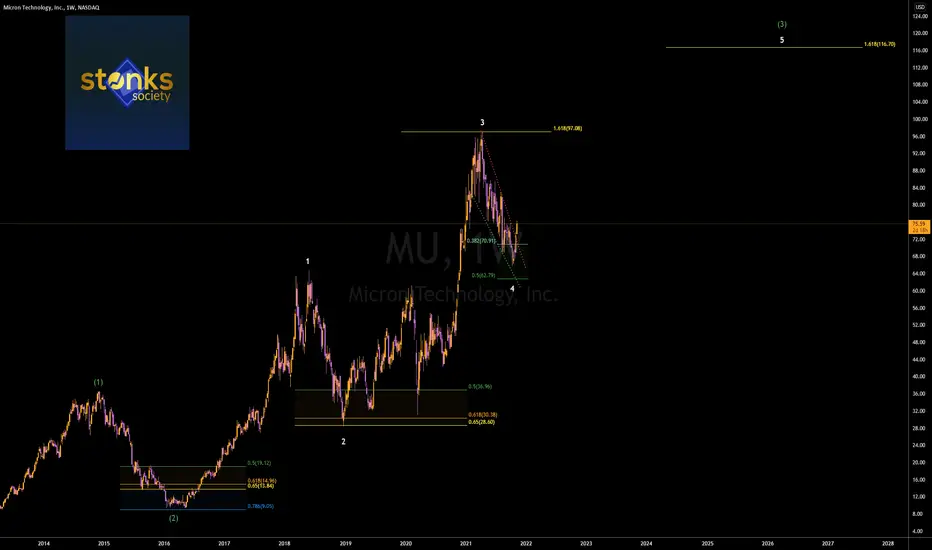
Microntechnology

MU: Back to Resistance? Micron Technology - Short Term - We look to Buy at 79.23 (stop at 73.95)
Preferred trade is to buy on dips. We have a 61.8% Fibonacci pullback level of 78.15 from 65.60 to 98.45. The bias is still for higher levels and we look for any dips to be limited. Previous resistance located at 96.50. Offers ample risk/reward to buy at the market.
Our profit targets will be 96.23 and 107.95
Resistance: 90.00 / 96.50 / 100.00
Support: 79.00 / 70.00 / 65.00
Disclaimer – Saxo Bank Group. Please be reminded – you alone are responsible for your trading – both gains and losses. There is a very high degree of risk involved in trading. The technical analysis, like any and all indicators, strategies, columns, articles and other features accessible on/though this site (including those from Signal Centre) are for informational purposes only and should not be construed as investment advice by you. Such technical analysis are believed to be obtained from sources believed to be reliable, but not warrant their respective completeness or accuracy, or warrant any results from the use of the information. Your use of the technical analysis, as would also your use of any and all mentioned indicators, strategies, columns, articles and all other features, is entirely at your own risk and it is your sole responsibility to evaluate the accuracy, completeness and usefulness (including suitability) of the information. You should assess the risk of any trade with your financial adviser and make your own independent decision(s) regarding any tradable products which may be the subject matter of the technical analysis or any of the said indicators, strategies, columns, articles and all other features.
Please also be reminded that if despite the above, any of the said technical analysis (or any of the said indicators, strategies, columns, articles and other features accessible on/through this site) is found to be advisory or a recommendation; and not merely informational in nature, the same is in any event provided with the intention of being for general circulation and availability only. As such it is not intended to and does not form part of any offer or recommendation directed at you specifically, or have any regard to the investment objectives, financial situation or needs of yourself or any other specific person. Before committing to a trade or investment therefore, please seek advice from a financial or other professional adviser regarding the suitability of the product for you and (where available) read the relevant product offer/description documents, including the risk disclosures. If you do not wish to seek such financial advice, please still exercise your mind and consider carefully whether the product is suitable for you because you alone remain responsible for your trading – both gains and losses.

Micron Technology: Bull Flag Offers Good Risk:Reward Micron Technology - Short Term - We look to Buy at 87.30 (stop at 83.80)
The continuation higher in prices through resistance has been impressive with strong momentum and shows no signs of slowing. Prices are extending higher from the bullish flag/pennant formation. Trading volume is increasing. Daily signals are bullish. Further upside is expected although we prefer to set longs at our bespoke support levels at 87.00, resulting in improved risk/reward.
Our profit targets will be 96.90 and 102.00
Resistance: 95.00 / 100.00 / 105.00
Support: 87.00 / 85.00 / 80.00
Disclaimer – Saxo Bank Group. Please be reminded – you alone are responsible for your trading – both gains and losses. There is a very high degree of risk involved in trading. The technical analysis, like any and all indicators, strategies, columns, articles and other features accessible on/though this site (including those from Signal Centre) are for informational purposes only and should not be construed as investment advice by you. Such technical analysis are believed to be obtained from sources believed to be reliable, but not warrant their respective completeness or accuracy, or warrant any results from the use of the information. Your use of the technical analysis, as would also your use of any and all mentioned indicators, strategies, columns, articles and all other features, is entirely at your own risk and it is your sole responsibility to evaluate the accuracy, completeness and usefulness (including suitability) of the information. You should assess the risk of any trade with your financial adviser and make your own independent decision(s) regarding any tradable products which may be the subject matter of the technical analysis or any of the said indicators, strategies, columns, articles and all other features.
Please also be reminded that if despite the above, any of the said technical analysis (or any of the said indicators, strategies, columns, articles and other features accessible on/through this site) is found to be advisory or a recommendation; and not merely informational in nature, the same is in any event provided with the intention of being for general circulation and availability only. As such it is not intended to and does not form part of any offer or recommendation directed at you specifically, or have any regard to the investment objectives, financial situation or needs of yourself or any other specific person. Before committing to a trade or investment therefore, please seek advice from a financial or other professional adviser regarding the suitability of the product for you and (where available) read the relevant product offer/description documents, including the risk disclosures. If you do not wish to seek such financial advice, please still exercise your mind and consider carefully whether the product is suitable for you because you alone remain responsible for your trading – both gains and losses.

🤩MU Micron Technology, Inc. Technology | Semiconductors |🤩😱Multi Year breakout worth a watch NASDAQ:MU
Micron Technology, Inc. is an American producer of computer memory and computer data storage including dynamic random-access memory, flash memory, and USB flash drives. It is headquartered in Boise, Idaho. Its consumer products are marketed under the brands Crucial and Ballistix.

Short fundamental and technical analysis of a 'must have' stockQuarterly report:
Very impressive in my opinion. It was beating analyst estimations both in terms of revenue and earnings as well as future guidance and outlook. Investors are happy and on pre-market the stock is gaining more than 8% at the time of writing.
Fundamental analysis:
1. Valuation:
I could say that historically $MU had better valuation than it currently has, however if compared to industry peers and the overall market the valuation seems OK to me... especially in current highly overvalued environment and FED hawkish tone.
2. Growth:
The company remains a growth story. Earnings are forecasted to grow roughly 20% per year in the near future. Revenue growth is estimated to be not so significant.
3. Profitability
Luckily the company is extremely profitable. It was reported that gross margin equals 46.4%, operating margin equals 34.2%, while net income margin is almost 30%.
4. Financial position:
Excellent. Cash rich, almost no debts and well covered.
5. ESG rating:
Low risk and good rating (17.7 at Sustainalytics)
6. Dividend $ Buyback:
0.49% the current div yield and TTM the company repurchased $1.3b of its common stock.
Technical analysis:
The company is gaining on pre-market and remains in the uptrend. Next psychological resistance is around 100. This is the price where I will slightly rebalance my position.
Thanks for reading,
Feel free to ask any questions or comment down below.

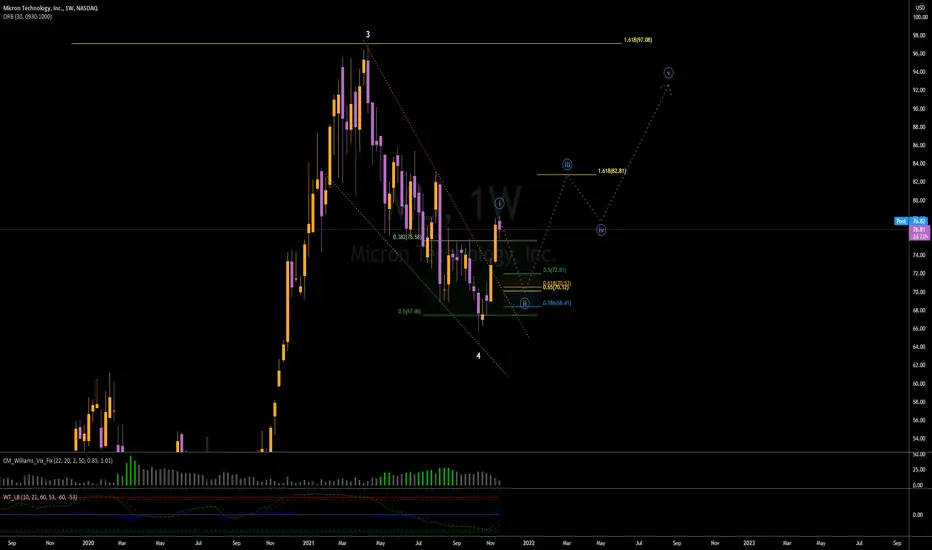
$MU | WEEKLY WATCHLIST 12/20$MU 1W
Nothing new here. I like other semis better, they have better opportunity imo. Still expecting a pullback on this one.

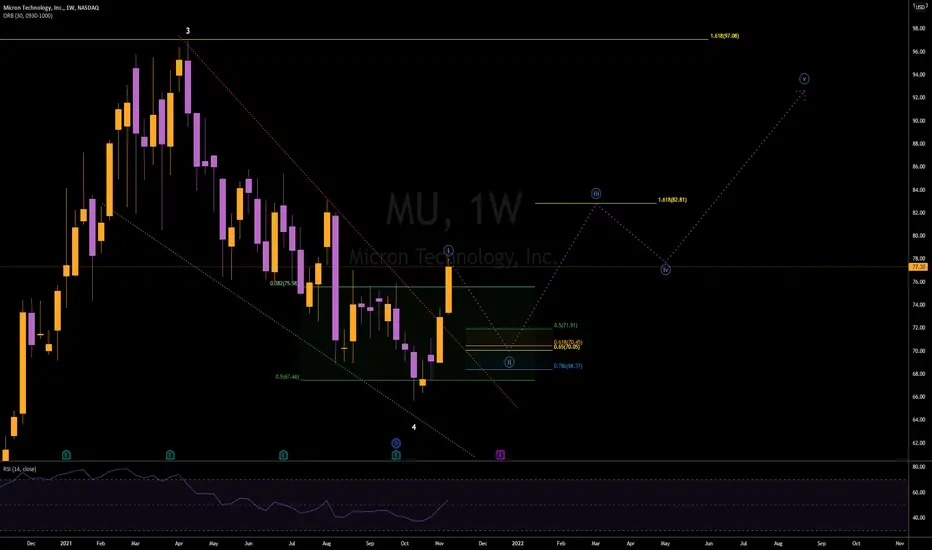
$MU | WEEKLY WATCHLIST 12/13$MU 1D
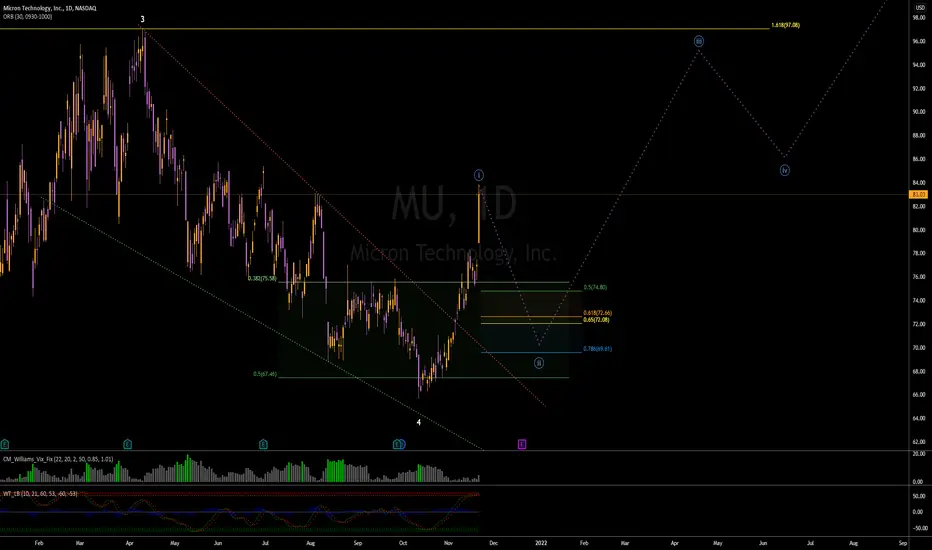
Although holding up fairly well still, my bias is telling me we still may see a wave 2 down before the next impulse. Looking at the $70-77 region for a great dip buy. Staying patient on this name.

$MU | WEEKLY WATCHLIST 12/6Momentum curling over which is what we want to see. Looking for W2 for a MAJOR buying opp. Stay patient friends.

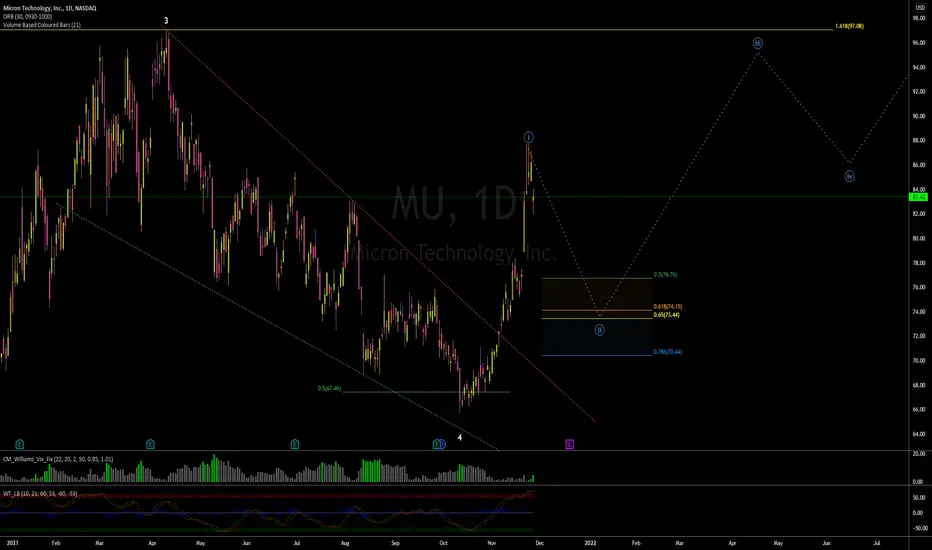
Micron Technology for short term respite. MUFibtime suggest a drop over the next month to month and a half. This is a guess as markets can never truly be timed. Time after all is not a continuum and has ebbs and flows like a river. We just simply do not notice them. Here believing end of an A within a B within a B. Divergences happened, momentum shifting, 5 Wave impulse confirmed. 0-2 line not shown, but we are certain to be heading down on this one.
We are not in the business of getting every prediction right, no one ever does and that is not the aim of the game. The Fibonacci targets are highlighted in purple with invalidation in red. Fibonacci goals, it is prudent to suggest, are nothing more than mere fractally evident and therefore statistically likely levels that the market will go to. Having said that, the market will always do what it wants and always has a mind of its own. Therefore, none of this is financial advice, so do your own research and rely only on your own analysis. Trading is a true one man sport. Good luck out there and stay safe!

MU Rising Wedge BreakdownMU is within a rising wedge
Rising wedges are a bearish indicative pattern
I am suggesting a collapse down to a stronger area of support to manage this rising wedge
The other scenario is that this rising wedge breaks out to the bullish side, but for the consistency of chart pattern expertise we will stay with the bearish approach, which is considered appropriate.

$MU | WEEKLY WATCHLIST 11/29No changes from last week. Still waiting for larger degree wave 2 before buying in.
$MU | WEEKLY WATCHLIST 11/22Swing execution plan still remains the same. Micron just decided it wanted $80+ first. Still seeing this initial impulse as a wave 1 and looking for a wave 2 below. Since wave 1 was larger than I expected, I have adjusted my count for waves 2,3,4 and 5 to accommodate this change. (much larger 5 waves up)
11/21/21 MUMicron Technology, Inc. ( NASDAQ:MU )
Sector: Electronic Technology (Semiconductors)
Current Price: $83.03
Breakout price trigger: $83.80
Buy Zone (Top/Bottom Range): $81.00-$78.00
Price Target: $89.00-$90.00 (1st), $95.00-$97.20 (2nd)
Estimated Duration to Target: 45-49d (1st), 60-64d (2nd)
Contract of Interest: $MU 12/17/21 82.5c, $MU 1/21/22 85c
Trade price as of publish date: $3.75/contract, $4.80/contract

$MU | TRADE IDEAUpside looks limited from here. Expecting us to pullback into a corrective wave 2 into a very buyable dip around $70. Be patient on this one, it's only getting started.
$MU | WEEKLY WATCHLIST 11/15 Not much has changed for me here. Still a very significant wedge breakout. However, I need to see a small wave 2 dip for me to buy into this for a swing. Staying patient on this one until risk/reward is in our favor.
After 200 days we can see a breakout | MUToday we will take a look at Micron Technology, a company that engages in the provision of innovative memory and storage solutions. Time to check the Technical elements on the chart:
1) From 2018 until November 2020 the price was inside a massive range until we saw the breakout of it and a 50% bullish movement from that situation towards the top of the bullish impulse
2) From April until today the price has been consolidating on a clear corrective pattern where we can define both top and bottom edges
3) How can we know that the structure is finished? Two reasons here: first we have clear edges (previous item) and second the structure has made contact with a key level, in this case, the ascending trendline.
4) Now we have a breakout of the corrective pattern. Remember that Technical Analysis is a statistical discipline, which means that we are never gonna have certainty about a situation. However, we know that if we engage in quality situations over certain periods, we will be able to observe consistent results.
5) We are not taking setup on this stock, (we already have exposure on other assets). However, it's an interesting situation to wait for a throwback (retest of a broken structure). IF that happens, we have defined an activation level as you can see on the chart (ALWAYS ABOVE THE TRENDLINE)
6) Depending on how aggressive is the setup you are taking, the invalidation level can be: FIRST below the whole structure 65.00 / SECOND below the throwback (this setup provides a massive risk to reward ratio, however, is prone to a quick stop loss)
7) Targets: IF I would be executing a setup here, I would protect my setup once the price reaches the previous top, which shares a major resistance zone that you can see on the weekly chart (2% below that, I want to be risk-free) / Now, the places to close setups on profit can be the first or 2nd Fibonacci extension. The expected duration of a movement like this may be between 200 to 300 days.
8)RISK: This is the formula I use to trade: I never have more than 5 setups at the same time NEVER EVER. And the maximum % of risk I take on any setup is 3% (ONLY with a STRATEGY THAT YOU HAVE a lot of EXPERIENCE WITH). Let's understand this better, most of my setups happen on the daily chart, which means that time resolutions are between 2 weeks to 3 months. Another rule I use is that my setups must happen on uncorrelated assets example: NFLX / BTCUSD / XAUUSD / FCX / AMZN. So my worst-case scenario is losing all at the same time which means a -10% to -15%. That's more than acceptable for me. And the most probable thing is that I would be able to open 4 to 5 new setups 1 to 2 months later. That's why this type of trading style is so secure. Even in apocalyptic scenarios, you would face a manageable loss, and it will take you time to develop new setups (you avoid impulsive trading)
Thanks for reading! Please feel free to share any idea about MU, in terms of technical or fundamental analysis.

$MU | UPDATEChart looking really good so far on this breakout! Waiting for a possible retest to get me into a long swing position. Being patient here and hoping it pays off.
$MU | WEEKLY WATCHLIST 11/8Monthly cup and handle forming, this is a long-term view. Nice falling wedge breakout looking for upside from here.

Breaking through the resistance line in Micron TechnologyMicron Technology is a semiconductor manufacturer. It is primarily known for its DRAM modules, flash memory and SSD drives.
The price broke through the resistance line. In fact, the 5th ascending wave has begun. Within the 5-wave movement, the price should reach at least the top of the third wave, which is about 30 percent from the current levels.
Micron Technology also shows good economic results. Revenue is growing from quarter to quarter. The consensus price from analysts is $98 (above the third wave).

$MU | WEEKLY WATCHLIST 10/25Not going to over-complicate this one. A simple cup & handle pattern spanning out for over a couple decades. It is important we keep in mind the timeframe of this chart when analyzing the stock.
We are currently pulling back from the double top at $97, and trading within a tight falling wedge pattern. With the bottom of the wedge intersecting with MAJOR demand zone between $62-65, this will be my most ideal buy zone.
At $62-65, I will start averaging into a long term bullish position on MU. I believe with time and patience, this one will pay off big time and inevitably see $100+. Much like it's counterpart $AMD did.

MU daily wolfe wave setup identifiedThere is a wolfe wave setup on the Daily min time frame. The projected target is calculated by extending a linear line between pivot 1 and 4 and projecting the line. This is represented as the green perforated line, as shown in the chart. The projected target is 74 which is expected to reach this price target within 14 days.

Micron tehnologie :wait and seeMicron tehnologie in weekly is still bulish and in consolidation phase.
In daily the trend is bearish, but the correction is stopped for the moment by the last range.
If we cross this range and break the resistance 75.95 and 77.11 we can hope the change of direction. Other way we continue the bearish trend
For the moment wainting and see

MU Daily TimeframeSNIPER STRATEGY (new version)
It works ALMOST ON ANY CHART.
It produces Weak, Medium and Strong signals based on consisting elements.
NOT ALL TARGETS CAN BE ACHIEVED, let's make that clear.
TARGETS OR ENTRY PRICES ARE STRONG SUPPORT AND RESISTANCE LEVELS.
ENTRY PRICE BLACK COLOR
TARGETS GREEN COLOR
STOP LOSS RED COLOR
DO NOT USE THIS STROTEGY FOR LEVERAGED TRADING.
It will not give you the whole wave like any other strategy out there but it will give you a huge part of the wave.
The BEST TIMEFRAMES for this strategy are Daily, Weekly and Monthly however it can work on any timeframe.
Consider those points and you will have a huge advantage in the market.
There is a lot more about this strategy.
It can predict possible target and also give you almost exact buy or sell time on the spot.
I am developing it even more so stay tuned and start to follow me for more signals and forecasts.
START BELIEVING AND GOOD LUCK
HADIMOZAYAN
