MU Micron Technology Options Ahead of EarningsIf you haven`t bought MU before the breakout:
Now analyzing the options chain and the chart patterns of MU Micron Technology prior to the earnings report this week,
I would consider purchasing the 90usd strike price Calls with
an expiration date of 2024-10-18,
for a premium of approximately $6.50.
If these options prove to be profitable prior to the earnings release, I would sell at least half of them.
Microntechnology

Micron Technology (MU) Shares Surge by Approximately 15%Micron Technology (MU) Shares Surge by Approximately 15%
The US stock market is experiencing positive momentum following the much-anticipated decision by the Federal Reserve to cut interest rates this month. The S&P 500 (US SPX 500 mini on FXOpen) closed at a new all-time high, driven by yesterday's news of:
→ Steady US GDP growth at 3% annually
→ Low unemployment, with 218K jobless claims filed last week (forecast = 224K, previous = 222K).
One of the top performers on the stock market yesterday was memory chip maker Micron Technology (MU). As seen on the MU stock chart, yesterday's candle closed around the $110 level, up from below $95 at the start of the week.
The strong bullish momentum was driven by Micron Technology's quarterly earnings report. According to Barron’s:
→ Earnings per share reached $1.18 for the fourth fiscal quarter, beating analysts’ forecasts of $1.11;
→ Revenue grew by 93% year-on-year to $7.75 billion;
→ Micron Technologies expects revenue next quarter to be $8.7 billion, surpassing forecasts of $8.3 billion and significantly more than $4.73 billion for the same period last year;
→ Micron Technologies' CEO Sanjay Mehrotra stated that demand for AI "drove a strong ramp of our data-center DRAM products and our industry-leading high-bandwidth memory."
Technical analysis of the MU stock chart shows that the price is moving within an upward channel (marked in blue). Key points include:
→ In early September, a Rounding Bottom pattern formed near the lower boundary of the channel – a bullish sign;
→ In yesterday's broad bullish gap, the price exceeded the key $109 level, which previously acted as both support and resistance (indicated by arrows).
Bearish Outlook for MU Shares: Supply forces may emerge around the $109 level, forming a false bullish breakout, with the possibility of testing the psychological level of $100.
Bullish Outlook for MU Shares: Strong company fundamentals and a bullish stock market could drive MU shares towards the median of the upward channel.
According to TipRanks, Wall Street analysts forecast an average target price for MU shares of around $150 over the next 12 months.
This article represents the opinion of the Companies operating under the FXOpen brand only. It is not to be construed as an offer, solicitation, or recommendation with respect to products and services provided by the Companies operating under the FXOpen brand, nor is it to be considered financial advice.

Micron Technology - The perfect chart!NASDAQ:MU is one of these stocks, which just respects every level, cycle and structure.
If I would give each chart an individual rating, the chart of Micron Technology would be 10 out of 10. Micron Technology is actually respecting every structure level and providing textbook trading opportunities. If we get a retest of the previous all time high, which is now turned support and perfectly lining up with the support of the rising channel, I will certainly look for longs.
Levels to watch: $90
Keep your long term vision,
Philip - BasicTrading

Target 101.45Following weekly chart, got a long signal from my screener.
TP 101.45 - 6% around
SL close under 86 candle close.

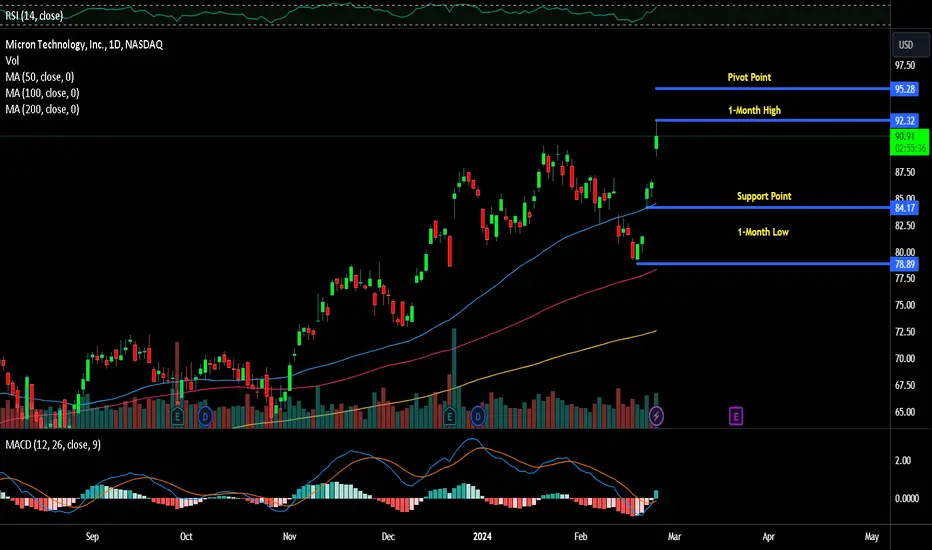
Micron Stock Soars 15% on Robust AI Demand and Strong OutlookMicron Technology (NASDAQ: NASDAQ:MU ) has made waves in the market following its fiscal fourth-quarter earnings, signaling a powerful comeback driven by robust demand in the AI sector. As a major supplier of memory chips, especially for Nvidia, Micron's performance not only beat Wall Street expectations but also positioned the company to achieve record-breaking revenue in the upcoming quarter. Shares surged more than 15% in premarket trading as global chip stocks rallied in response to the earnings report.
AI Fuels Micron's Impressive Growth
Micron's fourth-quarter revenue skyrocketed, reaching $7.75 billion, a nearly twofold increase compared to the same period last year. This growth can be directly attributed to the soaring demand for AI-driven technologies. The company swung to a profit of $887 million, or $0.79 per share, a stark contrast to last year’s $1.43 billion loss. The results exceeded analysts’ estimates, signaling a strong foothold in the AI market.
CEO Sanjay Mehrotra confirmed that the surge in demand is primarily from the AI sector, propelling Micron into fiscal 2025 with the "best competitive positioning in the company’s history." Looking ahead, the company expects first-quarter revenue to land between $8.5 billion and $8.9 billion, surpassing analyst expectations. The projected earnings per share (EPS) for Q1 between $1.46 and $1.62 also highlights Micron's potential to sustain this impressive growth trajectory.
Micron’s partnerships with AI giants like Nvidia, alongside the launch of its HBM (High Bandwidth Memory) chips, have been pivotal. These memory chips are essential for AI data centers and machine learning processes, further cementing Micron's role in the future of AI technologies. Notably, the company reiterated that its HBM chips are sold out through 2024 and 2025, showcasing the robust demand and limited supply of key memory components.
Global Chip Rally: Micron’s Surge Sparks Global Optimism
Micron's stellar results sent ripples through the global semiconductor market. Shares of rival firms Samsung Electronics and SK Hynix rose sharply in South Korea, with gains of over 4% and 9%, respectively. SK Hynix further boosted market confidence by announcing the mass production of its own HBM chips, designed for AI applications. The positive outlook extended to Europe as well, where Dutch semiconductor equipment maker ASML saw shares jump 4%, along with other industry players like Be Semiconductor and STMicro.
This surge highlights that Micron's strong earnings report is not just a victory for the company but also a signal of sustained AI demand, driving optimism across the semiconductor space.
Technical Outlook: (NASDAQ: NASDAQ:MU ) Breaks Through Key Levels
On the technical front, Micron's stock is showing strong bullish momentum. In premarket trading, NASDAQ:MU is up 15.44%, pushing it above its recent resistance levels and one-month high. The stock has now crossed its support pivot, positioning it to target the next significant resistance level around $130.
The Relative Strength Index (RSI) indicates that NASDAQ:MU still has room to run, as it remains neither overbought nor oversold. The daily price chart is also signaling a gap-up pattern, which is a key bullish reversal indicator. This pattern suggests that NASDAQ:MU may have successfully transitioned out of its recent downtrend, with the potential for further gains as the stock forms a more balanced and sustained upward trajectory.
Moreover, the stock's strong earnings report and upbeat future guidance provide fundamental backing for this technical breakout. As NASDAQ:MU breaks through these key levels, it opens the door for a sustained rally, especially with the AI demand narrative continuing to dominate the semiconductor sector.
Micron Poised for a Bull Run
Micron Technology's robust earnings, driven by its crucial role in the AI supply chain, have propelled the stock to new heights. Micron Technology (NASDAQ: NASDAQ:MU ) is poised for continued growth, especially as AI demand shows no signs of slowing down. With a record-breaking revenue forecast for the current quarter and strong technical signals pointing toward further gains, investors can look forward to a promising future for Micron in the booming AI era.
As the AI revolution continues, Micron's positioning as a key supplier of memory chips for AI applications will likely drive sustained growth, making NASDAQ:MU a stock to watch closely in the coming months.

What Lies Beyond the Horizon of Memory?In the ever-evolving landscape of technology, the horizon of memory has been pushed back further than ever before. Micron Technology, a pioneering force in the semiconductor industry, has once again redefined the boundaries of what is possible. Their recent financial performance, driven by the surging demand for AI-powered memory solutions, is a testament to their unwavering commitment to innovation.
Micron's Q4 results were nothing short of extraordinary. Revenue soared by an astonishing 93%, fueled by the insatiable appetite for data center memory chips that power AI applications. The company's strategic positioning as a leading supplier of High-Bandwidth Memory (HBM) has proved to be a masterstroke. HBM, a critical component in AI servers, has become a cornerstone of Micron's success, securing long-term contracts and commanding premium pricing.
Beyond HBM, Micron's diversified memory portfolio ensures a sustainable growth trajectory. The company's dominance in DRAM and Nand flash memory, essential components for personal computers, servers, and smartphones, positions it to capitalize on the ongoing surge in device shipments and the increasing integration of AI functionalities.
Micron's competitive edge is further solidified by its strategic investments in capacity expansion, including a new fabrication site in New York. This expansion not only reinforces Micron's position as a leader in the memory chip industry but also paves the way for future innovation and growth.
As the AI revolution continues to unfold, Micron's unwavering commitment to pushing the boundaries of memory technology remains steadfast. Their ability to anticipate and address the evolving needs of the market has positioned them as a key player in shaping the future of AI and beyond. The question that lingers is: what lies beyond the horizon of memory?

What You Need to Know Ahead of Micron Technology Earnings ReportMicron Technology Inc. (NASDAQ: NASDAQ:MU ) is set to release its fiscal fourth-quarter earnings report after market close today, Wednesday, September 25, 2024. Investors are eagerly anticipating this report, as it could provide crucial insights into the state of the memory chip industry and the broader tech sector.
Key Takeaways:
- Analysts expect Micron (NASDAQ: NASDAQ:MU ) to swing to a profit this quarter, with year-over-year revenue expected to almost double.
- Key metrics to watch include inventory levels and guidance for the next quarter.
- Micron's relationship with Nvidia ( NASDAQ:NVDA ) and its role in the AI hardware space is expected to be a central focus.
Earnings Expectations:
For Q4 2024, analysts are forecasting revenue of $7.65 billion, a substantial jump from the $4.01 billion reported in Q4 2023. This rise is largely driven by the growth of Micron’s memory chips used in AI data centers and high-performance computing systems. Earnings per share (EPS) are expected to come in at 84 cents, a significant improvement from last year’s loss of $1.31 per share.
1. Revenue Growth:
Micron (NASDAQ: NASDAQ:MU ) is expected to post significant year-over-year revenue growth, fueled by strong demand for AI-related memory chips. The company's partnership with Nvidia has been a key driver in this sector, as high-bandwidth memory (HBM) used in AI data centers continues to see robust demand. Analysts believe Micron’s growth trajectory will be further accelerated by the ongoing AI boom.
2. Profitability:
After reporting losses last year, Micron (NASDAQ: NASDAQ:MU ) is anticipated to return to profitability with net income of $1 billion for the quarter. This marks a major turnaround, thanks to increased demand for high-performance memory and storage solutions used in AI, edge computing, and data centers.
3. Inventory Levels:
One key area to watch will be Micron’s inventory levels. The company has been dealing with growing inventories as demand for legacy memory chips has waned. Both Citi and Morgan Stanley recently lowered their price targets for Micron (NASDAQ: NASDAQ:MU ) due to concerns about high inventories and weak demand for older memory components. However, analysts expect inventory issues to ease by the end of the year, with improvements in gross margins and revenue in the coming quarters.
Business Outlook:
Looking ahead, analysts are optimistic about Micron’s potential growth. The AI-driven upgrade cycle is expected to drive demand for edge devices and data center memory solutions, while a possible server refresh could also provide tailwinds. Analysts estimate that Micron (NASDAQ: NASDAQ:MU ) will generate $8.4 billion in revenue in the first quarter of fiscal 2025, with EPS expected to rise to $1.45.
Market Sentiment:
Despite these positive views, some caution remains in the market. While Micron’s stock has gained about 10% year-to-date, it has also faced volatility, especially in the wake of mixed earnings reports from its competitors, such as Broadcom and Nvidia. This has led to reduced enthusiasm for the AI trade, though a positive earnings report today could reignite investor interest in AI-related semiconductor stocks.
Technical Analysis:
From a technical standpoint, Micron Technology stock (NASDAQ: NASDAQ:MU ) is showing signs of bullish momentum. As of today, the stock is up 1.50%, rebounding from a presumed downtrend. It is trading within a falling wedge pattern on the daily chart, a bullish reversal indicator. If Micron Technology stock (NASDAQ: NASDAQ:MU ) delivers a positive earnings surprise, the stock could break through the upper boundary of this pattern, leading to a potential rally toward its 200-day moving average around $105 and possibly higher toward the $130 resistance pivot.
Key Technical Indicators:
- Relative Strength Index (RSI): Currently sitting at 52.00, the RSI indicates a neutral stance, but given the earnings catalyst, the stock is poised for a potential breakout.
- Support Levels: The stock has solid support around $86. A drop below this level could signal further downside risk.
- Resistance Levels: Overhead resistance is found near $100, with the 200-day moving average acting as the next significant level to break around $105.
Investor Sentiment:
Investor sentiment in the options market has grown increasingly bullish in recent weeks. Call options far outweigh put options, with large positions held at the $95, $100, and $155 strike prices, expiring shortly after the earnings report. This suggests that traders are betting on a positive earnings outcome that could propel the stock higher.
Conclusion:
Micron’s earnings report later today is shaping up to be a pivotal moment for the company and its investors. Strong results driven by demand for AI-related memory chips could not only send the stock higher but also restore broader enthusiasm for the AI trade, which has faltered in recent months. However, traders will need to keep a close eye on inventory levels, management’s guidance, and market sentiment to assess the stock's future direction.
In short, Micron Technology stock (NASDAQ: NASDAQ:MU ) may stand at the cusp of becoming one of the biggest bargains in the semiconductor space, with upside potential fueled by AI and data center demand, but tempered by near-term concerns over inventories and legacy products.

Double Bottom Is Forming on MicronMicron is in an interesting position after shedding a great amount of value in the last 3 months. The Fundamentals are great and Microns Balance Sheet has very few problems! with the double bottom forming this could be signaling a very bullish sentiment with a possible reversal towards the upside. Micron is currently being forecasted with Revenue and EPS Growth.
----------------------------------------------------------------------------------------------------------------
Balance Sheet: Micron has a decent Debt to Equity Ratio while having more then 3 Assets for every 1 Liability which is personally important to me when looking at stocks, Debt is Manageable especially should Micron beat all forcasts
Cash: US$8.38b
Debt: US$11.33b
Total Liability: US$22.03b
Total Assets: US$66.26b
Debt to Equity Ratio is: 25.6%
----------------------------------------------------------------------------------------------------------------
Resumed its Share Buy-Back Program
----------------------------------------------------------------------------------------------------------------
Highly Important Industry Supplier and Affiliates: Being Extremely Important with Industry Titans like Nvidia, Apple, Intel, MPS/Monolithic Power Systems, AMD, Texas Instruments, Microsoft, Gigabyte, Broadcom.
----------------------------------------------------------------------------------------------------------------
Diversified Business Model: Micron is not just a memory business its highly Diversified in
23.46% of there Revenue is derived from Microns -> "Mobile Business Unit"
23.4% of there Revenue is derived from microns -> "Embedded Business Unit"
36.74% of there Revenue is derived from Microns -> "Networking and Business Unit"
16.43% of there Revenue is derived from Microns -> "Storage Unit Business"
----------------------------------------------------------------------------------------------------------------
While Micron is in another uptrend in Revenue growth I think personally this time it could be more permanent growth, Micron is Extremely Undervalued compared to market peers such as Nvidia, and Micron with PE Ratios being well above 50 while Micron is extremely important within the Artificial Intelligence industry it benefits from a wide range of industries such as Artificial intelligence, Automotive, Computers, Memory, ETC.
----------------------------------------------------------------------------------------------------------------
Disclaimer: I am not a financial expert or have any certifications I just trade stocks as a personal hobby and I greatly encourage you to do your own research and not just take words at face value to make extremely risky investments. Please do your own Research I am not giving Buy, Sell or Hold Signals, This is just for healthy conversation and nothing else.
----------------------------------------------------------------------------------------------------------------
Idea:


Micron Technology - Patience and price action!NASDAQ:MU is literally creating so clear and repetitive market structure, this is textbook.
Bullish break and retest, cycle and correction. Micron Technology has been repeating this price action for over a decade and is about to enter another correction phase. If you don't want to trade this anticipated correction, you can instead wait for another retest of previous resistance, bullish confirmation and a rejection. Following the cycles, a bullish move there is quite likely.
Levels to watch: $140, $95
Keep your long term vision,
Philip - BasicTrading

MU Micron Technology Options Ahead of EarningsIf you haven`t bought the dip on MU:
nor calls ahead of the previous earnings:
Now analyzing the options chain and the chart patterns of MU Micron Technology prior to the earnings report this week,
I would consider purchasing the 140usd strike price Calls with
an expiration date of 2024-6-28,
for a premium of approximately $9.55.
If these options prove to be profitable prior to the earnings release, I would sell at least half of them.

Micron Technology, Inc.I think its going in an impulse and may follow the counts depicted herewith.
Not a trade/investment idea. just a view and educational material.
Regards
pl follow

Micron Technology - 100% in 6 months!Hello Traders and Investors, today I will take a look at Micron Technology.
--------
Explanation of my video analysis:
Back in 2018 we saw a beautiful break and retest on Micron Technology which indicated even more continuation towards the upside. For over 5 years Micron Technology has also been trading in a quite nice rising channel formation and is now approaching the upper resistance trendline. I do expect a pullback and a retest of the previous all time highs and then just more continuation towards the upside.
--------
Keep your long term vision,
Philip (BasicTrading)

Micron Release Quad-Port SSD For Next-Gen Intelligent VehiclesMicron Technology, Inc., ( NASDAQ:MU ) a global leader in memory and storage solutions, has unveiled a groundbreaking advancement in storage technology with the introduction of the automotive-grade Micron 4150AT SSD. This quad-port SSD promises to reshape the landscape of intelligent vehicles, offering unparalleled performance and efficiency for AI applications at the remote edge. As Micron prepares to navigate market shifts, including price hikes and evolving competition, its innovative strides position the company as a key player in the semiconductor industry.
Revolutionizing Intelligent Vehicle Storage:
The Micron 4150AT SSD represents a significant leap forward in intelligent vehicle technology. As the world's first quad-port SSD, it streamlines storage infrastructure by connecting with up to four systems on chips (SoCs), centralizing storage and optimizing performance for AI applications. With enterprise-class speeds and multi-port capability, this SSD enables efficient data management across multiple systems, essential for tasks ranging from advanced driver assistance systems (ADAS) to in-vehicle infotainment (IVI).
Addressing Market Demand for AI and Autonomous Safety Technologies:
Michael Basca, Micron's vice president of Embedded Products and Systems, underscores the necessity of a new storage paradigm to meet the escalating demands of AI and autonomous safety technologies. The Micron 4150AT SSD emerges as a solution tailored to these requirements, offering enhanced performance, power efficiency, and security crucial for the advancement of intelligent vehicles.
Navigating Market Dynamics:
In response to market dynamics, Micron ( NASDAQ:MU ) has announced plans to increase the prices of its DRAM and SSD products by over 25% in the second quarter. This strategic move aligns with anticipated market corrections and underscores Micron's commitment to maintaining profitability amidst evolving industry landscapes. Analysts predict stable pricing for SSDs in most end markets, highlighting Micron's resilience and strategic positioning.
Dominance in Semiconductor Industry:
Analysts have lauded Micron ( NASDAQ:MU ) for its advancements in high-bandwidth memory (HBM) technology, positioning the company as a formidable force in the semiconductor industry. With superior thermal and power efficiency compared to competitors, Micron's HBM3E is poised for significant market penetration, potentially surpassing $1 billion in revenue by 2024. Micron's stock performance, gaining over 93% in the past 12 months, reflects investor confidence in its innovative capabilities and market leadership.
Conclusion:
Micron's introduction of the 4150AT SSD marks a pivotal moment in the evolution of intelligent vehicle technology. As the company navigates market shifts and positions itself as a dominant player in the semiconductor industry, its commitment to innovation and strategic foresight will continue to drive growth and shape the future of automotive technology. With the Micron 4150AT SSD leading the charge, intelligent vehicles are poised to achieve new levels of performance, efficiency, and safety in the era of AI-driven mobility.
Technical Outlook
Micron Technology ( NASDAQ:MU ) is trading above the 200, 100, and 50-day Moving Averages (MA) respectively with a strong Relative Strength Index (RSI) of 66 indicating a strong buying momentum from investors.

Micron Technology's ($MU) Shares Reached New HighsMicron Technology's ( NASDAQ:MU ) shares have reached a new high after Bank of America raised its price target for the stock. The report from Bank of America stated that Micron is poised to gain from the artificial intelligence (AI) boom, as the company's high-bandwidth memory (HBM) is crucial for AI technology. Bank of America has named Micron, Marvell Technology, and Advanced Micro Devices as "junior samurAI" companies that are likely to gain from the AI boom, following the firm's "top picks," Nvidia and Broadcom.
Bank of America has increased its price objective for Micron from $120 to $144 per share and reiterated a "buy" rating, as the company's potential to expand its HBM market share behind its Korean peers presents an opportunity for growth. The report also noted that the "junior samurAI" companies trade at a valuation premium to their respective leaders, which could result in greater stock volatility but also create profitable niches.
Micron's shares ( NASDAQ:MU ) were up by almost 7% to $125.74 at 11 a.m. ET Monday, after earlier hitting an all-time high of $127.38. The stock has gained 53% year-to-date, with a Relative Strength Index (RSI) of 81.71 indicating an overbought situation or continuation of the current trend. Nvidia, a leader in the AI race, has already established itself as a major player in the field, with the companies within its AI ecosystem experiencing gains amid surging AI demand.
Overall, Bank of America predicts that the accelerator market will increase to $200bn over the next three years, which could create opportunities among the second-tier vendors. Despite the volatile nature of the market, Micron's position in the HBM market, combined with the growth prospects of the AI industry, make it an attractive investment opportunity.

MU Micron Technology Options Ahead of EarningsIf you haven`t bought the dip on MU:
Then analyzing the options chain and the chart patterns of MU Micron Technology prior to the earnings report this week,
I would consider purchasing the 95usd strike price Calls with
an expiration date of 2024-7-19,
for a premium of approximately $9.45.
If these options prove to be profitable prior to the earnings release, I would sell at least half of them.

MU potential buy setupReasons for bullish bias:
- Price has given channel breakout
- Entry at 0.382 fib retracement
- Earnings date is 20 March, it might pump up
- Safe Entry will be above 102
Here are the recommended trading levels:
Entry Level(CMP): 94.16
Stop Loss Level: 78.64
Take Profit Level 1: 109.68
Take Profit Level 2: Open

Micron's Meteoric Rise: AI Server Demand Propels to New HeightsMicron Technology Inc. ( NASDAQ:MU ) stands tall as a prime beneficiary. The recent surge in Micron's stock price, following an impressive earnings report and optimistic guidance, underscores the pivotal role the company plays in powering AI-driven innovations. With CEO Sanjay Mehrotra at the helm, Micron's strategic vision and robust performance position it as a leader in the semiconductor industry's AI revolution.
Unveiling the Numbers:
Micron's fiscal second-quarter earnings report exceeded all expectations, sending its stock soaring by a remarkable 18% in after-hours trading. The Boise-based company reported adjusted earnings of 42 cents per share, a significant leap from the previous year's loss of $1.91 per share. Revenue surged to $5.82 billion, up from $3.69 billion a year earlier, far surpassing analysts' estimates.
AI's Ascendancy:
What sets Micron ( NASDAQ:MU ) apart in this era of technological advancement is its pivotal role in catering to the burgeoning demand for AI-powered applications. CEO Sanjay Mehrotra's astute observation regarding AI server demand tightening supply dynamics sheds light on Micron's strategic positioning. The company's robust performance in the memory and storage chip markets, fueled by AI-driven demand, has led to substantial price increases, further bolstering its revenue and profitability projections for fiscal 2025.
Charting New Heights:
A closer look at Micron's ( NASDAQ:MU ) stock chart reveals a compelling narrative of growth and consolidation. Breaking out from a 16-month ascending channel in late February, Micron's stock price surged to an all-time high. Despite a brief period of consolidation preceding the earnings release, the stock's post-earnings breakout signals a bullish trend. Notably, the emergence of a double top pattern around $98 suggests a potential future price support level, highlighting investor confidence in Micron's long-term prospects.
Future Prospects:
As Micron ( NASDAQ:MU ) continues to ride the wave of AI-driven demand, investors remain optimistic about its future trajectory. With a projected current-quarter midpoint adjusted earnings of 45 cents per share and revenue forecasted at $6.6 billion, Micron ( NASDAQ:MU ) is poised for sustained growth. CEO Sanjay Mehrotra's strategic vision, coupled with Micron's technological prowess, positions the company as a frontrunner in shaping the future of AI-driven innovation.

Micron Technology: 2x Minimum Potential
Regarding Micron Technology, we believe we are dealing with an overarching Wave (3). This wave should reach at least the 161.8% extension level at $158. We've seen the Wave (2) low buy at $1.36, indicating significant parabolic momentum has been built up. Since that low, there's been an increase of over 5000%, which is staggeringly high. However, as rapid and high as a rise can be, the correction downwards is often just as intense. This is both clear and increasingly likely. Examining this chart, we believe that in Wave (3), the subordinate Wave 1 has now been fully developed. We believe this due to the structure leaving little room for other possibilities. We might climb a bit further for Wave ((v)), but we also anticipate a potential downward trend or a development of Wave 2. This should lie between 50% and 78.6%, where we identify two crucial support zones. One is the subordinate Wave ((iv)) around 50%, and another is a support zone just over 78.6%. These zones are ones we place significant trust in.
We've approached the old high four times at $97.71. We doubt we'll surpass this. If we do, we'll need to take a closer look at where Wave ((v)), Wave 1, and then Wave 2 precisely are. Nonetheless, we anticipate a three-wave movement downwards, as expected for the completion of Wave 2, at a minimum of 50%.

Micron Technology ($MU) Strike Partnership with NvidiaMicron Technology ( NASDAQ:MU ) emerges as a pivotal player, strategically positioning itself to capitalize on the accelerating demand for artificial intelligence (AI) infrastructure. Embarking on a promising trajectory, Micron's ( NASDAQ:MU ) recent collaboration with Nvidia ( NASDAQ:NVDA ) heralds a new chapter in its journey, propelling the company towards unprecedented growth and market dominance.
Harnessing the Power of AI:
As AI permeates diverse sectors, from autonomous vehicles to healthcare, the demand for robust computing solutions intensifies. Micron's ( NASDAQ:MU ) foresight in recognizing AI's pivotal role in shaping the future prompts strategic investments, particularly in its high-bandwidth-memory (HBM) chips. The integration of Micron's cutting-edge technology into Nvidia's latest H200 semiconductors amplifies performance, heralding a paradigm shift in AI infrastructure.
Strategic Collaboration with Nvidia:
The symbiotic partnership between Micron ( NASDAQ:MU ) and Nvidia underscores a shared vision of pioneering advancements in AI computing. Nvidia's unveiling of the H200 chip, boasting doubled inference performance over its predecessor, signifies a quantum leap in AI processing capabilities. Micron's ( NASDAQ:MU ) pivotal role in supplying HBM chips for the H200 not only underscores its technological prowess but also signifies a lucrative revenue stream, with projections hinting at generating "several hundred millions of dollars" in fiscal 2024.
Positioned for Growth:
Micron's ( NASDAQ:MU ) bullish stance on AI augurs well for its financial outlook, with projections indicating robust revenue growth amidst escalating demand for AI-related technologies. Despite an anticipated loss per share in the upcoming second-quarter earnings, Micron ( NASDAQ:MU ) remains buoyant, with revenues forecasted around $5.3 billion. CEO Sanjay Mehrotra's optimistic outlook underscores the company's confidence in navigating the burgeoning AI landscape, poised for sustained growth and market expansion.
Driving Innovation, Redefining Possibilities:
Micron's ( NASDAQ:MU ) innovative strides not only amplify AI performance but also address critical concerns such as power consumption, aligning with the industry's sustainability agenda. By enhancing memory bandwidth and capacity, Micron ( NASDAQ:MU ) empowers AI developers to unlock new frontiers of innovation, transcending conventional boundaries. As the International Energy Agency highlights the exponential growth of data centers, Micron's technological breakthroughs emerge as a catalyst, fueling the AI revolution and shaping the digital landscape of tomorrow.
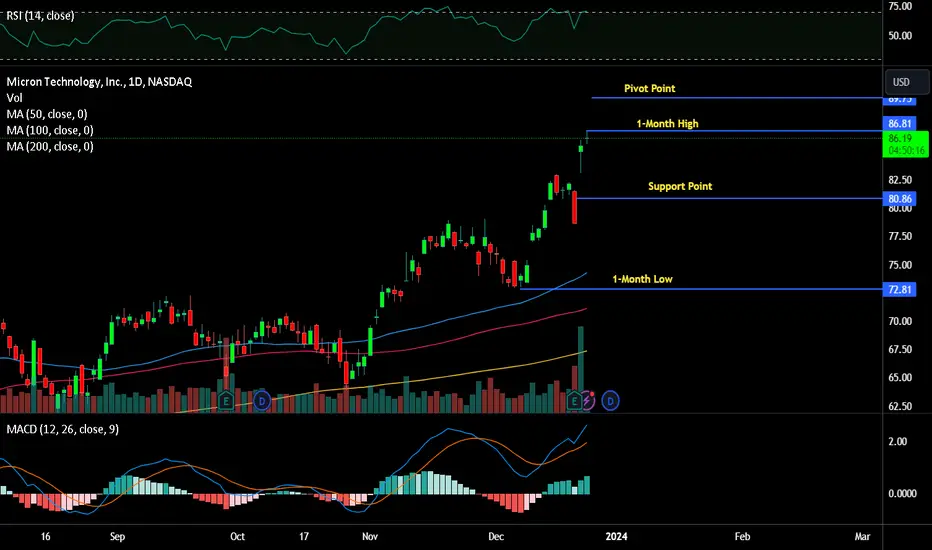
Micron's Path to Recovery Signals a Bullish Trend for $MU Stock
After weathering a challenging post-pandemic downturn in the memory-chip markets, Micron Technology Inc. (NASDAQ: NASDAQ:MU ) is emerging from the storm with promising indicators of recovery. The company's fiscal first-quarter earnings report reflects higher revenue, an improving gross margin, and rising average selling prices for DRAM and NAND chips. As global shipments of PCs are poised for growth in the coming year and demand for AI-computing capacity continues to rise, Micron anticipates a record year for the memory-chip industry in 2025.
A Glimpse into Micron's Performance:
Despite still facing financial losses, Micron's recent fiscal performance showcases encouraging signs. In the first quarter, the company reported a 16% year-over-year revenue growth, reaching $4.7 billion. This growth was primarily driven by robust sales of DRAM chips. Notably, DRAM bit shipments surged by over 20% from the previous quarter, accompanied by an upward trend in average selling prices. The NAND business experienced a mixed quarter, with bit shipments decreasing by a mid-teens percentage while average selling prices soared by about 20%.
PC Market Resurgence:
One key factor contributing to Micron's recovery is the anticipated return to growth in the global shipments of PCs in the upcoming year. With inventory levels across the PC supply chain stabilizing and returning to normal, Micron is well-positioned to benefit from increased demand for memory chips. As the world adapts to new work and learning paradigms, the demand for PCs is expected to rise, driving Micron's growth in the market.
Smartphone Shipments and AI-Computing Demand:
In addition to the positive outlook in the PC market, Micron stands to gain from potential growth in smartphone shipments. After a prolonged slump, the smartphone market is showing signs of revival, presenting Micron with additional avenues for revenue generation. Moreover, the relentless demand for artificial intelligence (AI)-computing capacity is expected to buoy the market for servers, further contributing to Micron's positive trajectory.
Looking Ahead to 2025:
While Micron acknowledges that 2024 will be a recovery year, the company is optimistic about the industry's prospects in 2025. Micron envisions 2025 as a record year for the memory-chip industry, suggesting sustained growth and profitability for the company. Investors eyeing the long-term potential of the semiconductor market may find Micron's forecast compelling, as the company positions itself for a robust future.
Micron's recent performance, coupled with positive industry trends, paints a promising picture for NASDAQ:MU stock. As the memory-chip market rebounds and key sectors such as PCs, smartphones, and AI continue to drive demand, Micron appears poised for a strong recovery. While challenges persist, the light at the end of the tunnel shines brighter, making Micron an intriguing prospect for investors seeking growth and resilience in the dynamic semiconductor landscape.
Technical Analysis
Micron Technology is in a rising trend channel in the medium long term. investors over time have bought the stock at higher prices and indicates good development for the company. The price has risen strongly since the positive signal from the rectangle formation at the break through resistance at 72.28.
MU: Potential BuyPrice in a rising channel, expecting the bullishness to continue backed with positive analyst expectations. First target around 90 USD. Areas plotted to look out for, combined with daily and weekly moving averages to be used as S/R confluences.

MU looks bullish pre earnings I tried analyzing MU and I feel it is bullish. It is not a current market price trade as risk is way down near 73 but target is 87.
I am long and will continue to hold it as I see $88++ coming.
