January Effect: Mid and Small-Cap Stocks Outperform Mega-CapsIn the first half of the first month of the year the market is clearly dominated by mid and small-cap stocks (which carry more influence in equal-weighted index than in the cap-weighted).
They are outperforming mega-caps by 1.94%.
This could be a sign of the January Effect where small stocks tend to outperform early in the year.
Midcapstocks

DAM Capital Base Formation After Correction Risk Reward SetupTechnicals:
Trading in a broader sideways to range-bound structure after a sharp correction earlier in the year following that decline, the stock has spent time absorbing supply and recently found strong support in the ₹205–212 zone. The latest bounce from this area has formed a short-term higher low on the daily chart, indicating improving price stability rather than fresh selling pressure.
Price is currently hovering around ₹219–222, with the EMA flattening and price attempting to hold above it. This suggests a transition from a weak phase into base formation. structurally, the stock is moving toward a descending trend-line zone around ₹255–265, which aligns with a prior supply area. This zone is likely to act as the first major reaction area. From a risk-reward perspective, the setup favors a controlled pullback trade, with upside potential toward ₹275–300, while downside risk remains protected around ₹190, which marks the last strong demand and structure invalidation zone.
Momentum is also improving. RSI has recovered from oversold conditions and is now sustaining above the 50 level, pointing toward a shift from bearish to neutral-to-positive momentum. As long as price holds above the ₹212 support band, the bias remains constructive for a measured upside retracement toward higher resistance.
Fundamentals:
Operates as a financial services and investment banking firm, with revenues closely linked to capital market activity, deal flow, and overall market sentiment. after a strong listing and initial enthusiasm, the stock corrected sharply as market expectations normalized and broader mid-cap financial stocks saw valuation compression.
fundamentally, the business remains sensitive to equity market cycles, IPO activity, and advisory volumes periods of consolidation or lower market participation tend to reflect in muted earnings visibility, which explains the prolonged sideways movement in price however, as market activity stabilizes and risk appetite improves, earnings can recover relatively quickly due to the asset-light nature of the business.
At current levels, the stock appears to be transitioning from expectation reset to valuation discovery. The recent stabilization in price near long-term support suggests that downside risk is being gradually priced in, while the market waits for clearer earnings consistency and deal momentum. Any pickup in capital market activity, stronger quarterly numbers, or improvement in advisory pipeline could act as a catalyst for a re-rating, which would align with a breakout attempt above the descending trend-line on the chart.
Levels to watch
Support zone: ₹205–₹212
Risk protection / invalidation: ₹190
First reaction zone: ₹250–₹255 (trend-line and supply confluence)
Upside extension targets: ₹275–₹300
Like, comment your thoughts, share this post
Explore more stock ideas on the right hand side!
Disclaimer: This post is for educational purposes only and should not be considered a buy/sell recommendation.

INTA NASDAQ:INTA
INTA has made a formation of RECTANGLE with RSI supporting ABOVE 60 along with MACD cross.
Once price closes above $47.55 we can expect price upto $59. We can trail stop loss at $41.3.
which is showing risk to reward is 1:2.
Analysis is made to best of my knowledge, if you are taking trade please make your own analysis . Thank you

Coforge Limited 4th Wave Contracting TriangleCoforge Limited 4th Wave Contracting Triangle
The larger trend remains bullish, and the current structure fits well as a Wave 4 correction unfolding as a contracting triangle (A–B–C–D–E). Waves A, B, C, and D are already in place with clear overlaps and decreasing volatility, which is typical of a triangle in Wave 4. The ongoing dip looks like the final Wave E, holding above the rising support line, suggesting correction is nearing completion.
Once Wave E finishes, a decisive breakout above the triangle resistance should trigger Wave 5, which is usually sharp and impulsive, often carrying price beyond the previous Wave 3 high.
(Educational view only, not a trading recommendation.)

Direxion Midcap Bull 3x | MIDU | Long at $45.67Like my predictions for AMEX:TNA , I believe midcap stocks will likely rise as interest rates are lowered over the next few years (probably a little too early given the looming economic situation). While it may be a bumpy ride and everything truly depends no announcement of an "official" economic recession (by which all stock expectations would change to the negative), there could be significant room to run here before a top - but always stay cautious...
Thus, at $45.67 AMEX:MIDU is in a personal buy zone.
Targets:
$55.00
$75.00 (longer-term if the economic data/news hold up strong)

Nifty Breaks Record High: Will the Rally Continue Next Week? Nifty closed at 26202 marking a fresh all-time high. The index made a high of 26310 and a low of 25842. On the monthly timeframe, Nifty has formed a strong bullish candle and delivered a bullish close, indicating sustained strength on the higher timeframe. As mentioned last week, Nifty once again moved precisely within my projected range of 26600–25600. For the upcoming week, I expect Nifty to trade within 26700–25700 unless a breakout triggers new momentum.
Key levels for Nifty:
Resistance: 26492 is a strong Fibonacci level. Sustaining above this level can push Nifty towards 26700.
Support: 26117 is the first line of defence. Below this, 25700 remains a strong support zone.
Bank Nifty continues to lead the market’s upside. The index posted an all-time high weekly close at 59752, with a high of 59897 and a low of 58649. Bank Nifty has now reached a major psychological and Fibonacci level at 60087. Sustaining above this zone can open the path towards 60300 and 60900.
Midcap vs Smallcap:
A common query is when Midcap and Smallcap will start moving along with Nifty. Currently, the Midcap index is better positioned on the monthly timeframe compared to the Smallcap index. Smallcap investors may need to wait longer or shift focus to stronger opportunities within the Midcap space.
S&P 500 outlook:
As discussed last week near the 6840 region, S&P 500 has formed a bullish marubozu candle. The upcoming week will be crucial.
Above 6885: The index can extend its move towards 6930, 7000, and 7026 (important Fibonacci level).
Below 6726: The rally may weaken and pull the index towards 6568 (key Fibonacci support) and 6454.
Bonus level for Nifty traders:
Monday’s upper range limit is around 26350.

ASAHI INDIA GLASS- Bullish Flag & Pole Breakout (Daily T/F)Trade Setup
📌 Stock: ASAHI INDIA GLASS ( NSE:ASAHIINDIA )
📌 Trend: Strong Bullish Momentum
📌 Risk-Reward Ratio: 1:3 (Favorable)
🎯 Entry Zone: ₹851.00 (Breakout Confirmation)
🛑 Stop Loss: ₹809.00 (Daily Closing Basis) (-5 % Risk)
🎯 Target Levels:
₹875.10
₹897.85
₹920.90
₹945.65
₹969.00.00 (Final Target)
Technical Rationale
✅ Bullish Flag & Pole Breakout - Classic bullish pattern confirming uptrend continuation
✅ Strong Momentum - Daily RSI > 60, Weekly RSI >60 Monthly rsi >60
✅ Volume Confirmation - Breakout volume 121.30K vs previous day's 1.63M
✅ Multi-Timeframe Alignment - Daily and weekly charts showing strength
Key Observations
• The breakout comes with significantly higher volume, validating strength
• Well-defined pattern with clear price & volume breakout
• Conservative stop loss at recent swing low
Trade Management Strategy
• Consider partial profit booking at each target level
• Move stop loss to breakeven after Target 1 is achieved
• Trail stop loss to protect profits as price progresses
Disclaimer ⚠️
This analysis is strictly for educational purposes and should not be construed as financial advice. Trading in equities involves substantial risk of capital loss. Past performance is not indicative of future results. Always conduct your own research, consider your risk appetite, and consult a financial advisor before making any investment decisions. The author assumes no responsibility for any trading outcomes based on this information.
What do you think? Are you watching NSE:ASAHIINDIA for this breakout opportunity? Share your views in the comments!

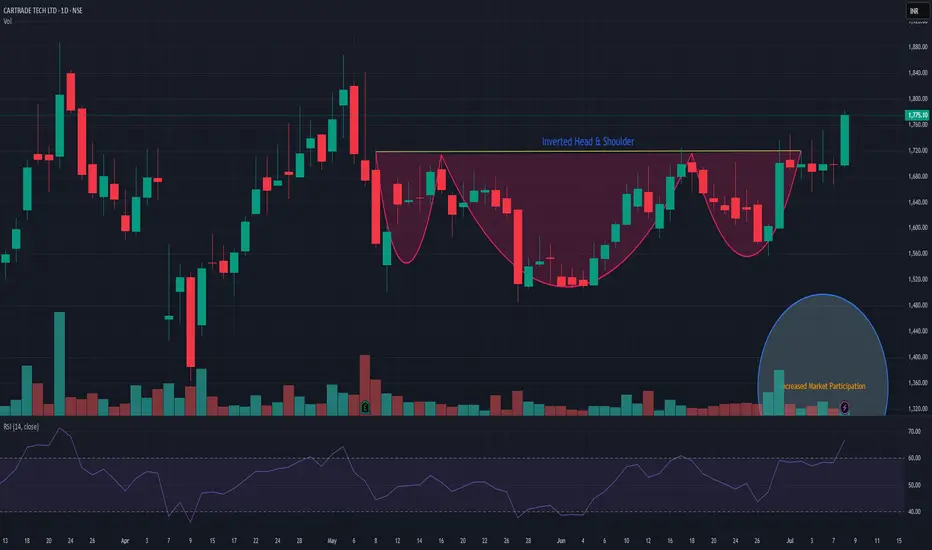
CARTRADECARTRADe is showing strength and has given Inverted head & Shoulder breakout with decent market participation. support is near 1620. It has a potential to go up! Keep it on radar. Closing below 1620 may change my view.
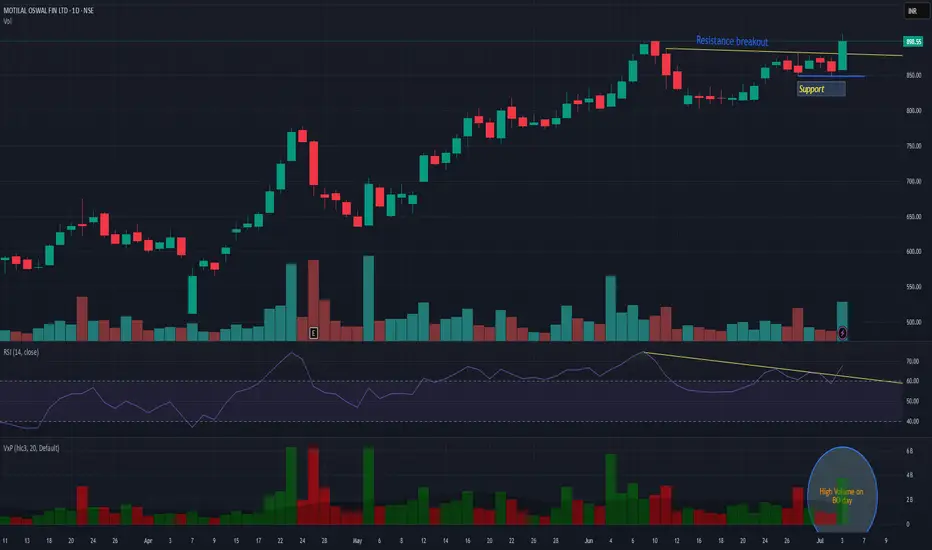
MOTILALOFSMOTILSLOFS has given resistance breakout with decent volume. Strong support can be seen near 845 levels. It may continue momentum rally till 1008. And if it sustain above that then it may do wonders! Keep it on radar.
SUN PHARMA | Inverted Head & Shoulders BreakoutSun Pharma has completed an Inverted Head and Shoulders pattern on the daily chart, signaling a potential bullish reversal.
📈 Entry: Buy above ₹1800 (breakout confirmation)
📉 Stop Loss: ₹1722 (below right shoulder support)
🎯 Targets (based on Fibonacci extensions & previous resistance zones):
• ₹1837.30
• ₹1875.35
• ₹1914.20
• ₹1953.90
• ₹1994.35
• ₹2034.55
The neckline breakout has occurred with decent volume, reinforcing the validity of the setup. As always, risk management is key — trailing stop loss recommended as price moves in favor.
💡 Disclaimer: This is for educational purposes only. Do your own research before making any trading decisions.

Where is $HIMS going next? Massive upsideWhere is NYSE:HIMS going next? Massive upside
Watch now to find out!
Not financial advice

Bearish Flag Breakdown in Nifty 50 – A Shorting Opportunity Bearish Flag Breakdown in Nifty 50 – A Shorting Opportunity
🚨 Entry: Sell at 23,645
🚨 Stop Loss: 24,050
🚨 Target: 22,580
🚨 Risk-to-Reward Ratio: 1:3
🔍 Analysis:
The Nifty 50 has formed a classic bearish flag pattern, signaling potential downside momentum. A breakdown below 23,645 provides an ideal entry point for short-sellers, with a tight stop-loss to limit risk.
With a strong confluence of technical indicators pointing toward further downside, the target of 22,580 aligns with the measured move of the flagpole, offering an attractive risk-to-reward ratio of 1:3.
💡 Tip: Always adhere to your trading plan and risk management strategy. Never risk more than you can afford to lose.
---
⚠️ Disclaimer:
This analysis is for educational purposes only and does not constitute financial advice. I am not SEBI-registered. Please consult with your financial advisor before making any trading decisions. Trade responsibly!
---
What’s your view on this setup? Let me know in the comments below!

Ramco Cements: Bullish Flag BreakoutNSE:RAMCOCEM Ramco Cements has recently given a bullish flag breakout at ₹1040, indicating a strong upward momentum in the stock. A bullish flag pattern is a continuation pattern that signifies the resumption of an uptrend after a brief consolidation phase. The breakout from this pattern suggests a renewed buying interest, backed by robust volumes.
Trading Setup:
Entry Price: ₹1040
Stop Loss: ₹987 (below the consolidation zone)
Targets:
First Target: ₹1072.10
Second Target: ₹1104.10
Third Target: ₹1136.10
Fourth Target: ₹1168.05
Final Target: ₹1200.05
Risk-Reward Ratio:
This trade setup offers a favorable risk-to-reward ratio of 1:3, making it an attractive opportunity for swing traders.
Key Observations:
The stock has been in an uptrend, supported by strong institutional buying.
The breakout is accompanied by above-average volumes, adding conviction to the move.
Key resistance levels are expected at the target prices, while the stop loss is strategically
placed below the recent consolidation range to minimize risk.
Recommendation:
Traders can consider buying Ramco Cements at ₹1040 for the above-mentioned targets. Ensure strict adherence to the stop loss of ₹987 to manage risk effectively.
Disclaimer: This analysis is for educational purposes only. Please conduct your own research or consult with a financial advisor before taking any trading or investment decisions.

Here is the Down Low on $DLO! 149% UpsideHere is your next H5 Setup! 🚀
DLocal Limited - NASDAQ:DLO
Here is the down low on DLO!
- H5 Indicator is GREEN
- Falling Wedge Breakout! I want to see it break $11.78
- MACD is approaching a cross of the Zero line! Bullish
- Launching off AVP Shelf with a GAP to Fill
🎯 $17.26
🎯 $24.22
📏 $29 (⏳Jun2026) 📈 149% Pot. Upside!
NFA

Mid/Smallcap || Recovery As Expected, What now? The Midcap and Small Cap Index have shown signs of recovery as anticipated in my previous analysis. The index is now trading above the 20 EMA Band in the 2-hour timeframe (TF). However, several key conditions must still be met before we can confirm a sustained bull run:
1. 2-hour RSI should cross above 75 to signal strong upward momentum.
2. Daily timeframe (DTF) RSI needs to exit the Bear Zone.
3. NIFTY50 is still awaiting confirmation to move out of the Bear Zone, which would provide broader market support.

Mid/Smallcap || Nearing Key Reversal Zone?Many traders focus on midcap and small-cap stocks, so this index movements can significantly impact portfolios. However, stock selection is crucial; choosing stocks in a downtrend or sideways movement often limits potential upside.
Index Analysis:
1. RSI for Midcap and Smallcap Index in the daily timeframe (DTF) is close to oversold zone
2. 2hrsTF RSI is already in ovsersold zone, however there’s an RSI positive divergence in the 2-hour chart, a bullish indicator,
3. the index sits within a support zone, suggesting a possible reversal.
Market Outlook:
Limited Downside Expected: Significant further declines in midcap and small-cap may not be likely. Even if they dip, a recovery within the same 2-hour candle is possible.
Key Resistance:
A confirmed bull run may require the RSI to break above 75.
Disclaimer: This is based on my analysis and experience. It’s not investment advice, and market conditions may vary.
Hope for the Best


MIDCAP NIFTY Rallies Strong! Long Trade Hits All TargetsMidcap Nifty has shown a solid uptrend following the entry at 12921.15 on 11th October at 12:15 PM, with the price successfully reaching all profit targets.
Key Levels
Entry: 12921.15 – The long trade was initiated at this level, supported by bullish momentum.
Stop-Loss (SL): 12891.70 – Positioned below recent support to protect against potential downside.
Take Profit 1 (TP1): 12957.60 – The first target was achieved, confirming the upward move.
Take Profit 2 (TP2): 13016.55 – Bullish pressure continued, leading to this level being reached.
Take Profit 3 (TP3): 13075.50 – Further gains pushed the price to this target.
Take Profit 4 (TP4): 13111.90 – The final target, marking a successful rally in the long trade.
Trend Analysis
The price has consistently remained above the Risological Dotted trendline, indicating a strong uptrend. The sustained upward movement suggests that market sentiment remains positive, supporting further gains beyond the final target.
The long trade on Midcap Nifty successfully hit all profit targets, with the final TP4 at 13111.90. The uptrend was well-supported by the Risological Dotted trendline, showcasing strong buying interest throughout the move.

Planned Positional Long Trade in DALBHARAT
In the picture above we have drawn Trendlines to understand the direction of the Price. We see that Price has come down violating the Demand areas and respecting the Supply areas forming Lower Lows, hence was in a clear downtrend
Now most of the times before changing the trend price goes sideways
Here we see Price clearly going sideways. So we know there will be a change in Trend from Down to Sideways to UP Let's see how
An Uptrend has a Source from where the Trend starts and there is a point which we have called as a Destination of the Trend where it is trying to reach. So we have the Start point and End point of this upcoming Buy Trend.
Let's Understand the Demand and Supply Curve wrt to Price here
This tells us where is low, middle and high, course as traders we gotta buy low and sell high and avoid the middle area. This clearly tells us where is low and where is high.
After reacting to the Weekly Source Demand, in the Daily chart we see that Price has formed a Daily Demand which has violated its previous High which confirms Buying Momentum.
Now we have two possibilities for outcome of this Trade either it will take the SL or it will take the Target.
As a Trader we have to ensure our Reward to Risk ratio is favourable enough making the Risk practically worth taking.
Trade Type : Position Swing Trade
Entry : 1861.35
SL : 1794.25
Target : 2220.35
Reward : 359
Risk : 67.10
Ratio : 5.35/1

POTENTIAL INVESTMENT TARDE FOR VODAFONE IDEA
Here we look at the Quarterly chart since 2008, We see price was rallying up violating Resistances and respecting the Support areas, until it starts doing the opposite.
Now recently Price has violated a Supply area which indicates that the Buyers have just won over the sellers and now Price has given a Pullback in a 6 Months Demand.
Now we have a 6 Months Demand; So understanding the timeframe role into this Trade as the Demand in which we buy this a 6 months Demand hence we will have to consider a minimum of 1 to 2 years considering at least 2 to 4 candles of 6 months each to achieve the Target.
Here we have the following to consider before entering the Trade
Trade Type : Investment Trade
Entry : 10.10
SL : 5.70
TGT : 39.74
Risk : Rs. 4.4
Reward : Rs. 29.64
Ratio for Reward to Risk : 6.7/1

Island Gap Potential, Dark Pool Buy Zone, HFTsThis stock has the potential to form an island gap, which are caused by High Frequency Trading activity that triggers on news. The gap down was too huge, so fundamentals are above the current price. This would be a gap UP potential at this point, to create the island gap.
The lows have been established clearly, so selling short this stock is not wise. But smaller funds and retail may try, as they tend to sell short stocks within a Dark Pool buy zone. Chaikin Osc and Money Flow Index are moving upward but the angle of ascent on price is steeper. The faster price ascent could be rapid accumulation from derivative developers.
UIPath creates software for Robotic Process Automation. It was one of the stocks discussed in the Case Study I did with my students in the summer of 2022 on the disruptive new technologies to watch over the next decade.

medium term trading opportunity in samvardhna mothersonHi,
NSE:MOTHERSON has given a Bullish Flag Breakout on Weekly charts with very good volume.
MACD is also on the bullish side on Weekly time frames. RSI is also on the bullish side on daily, weekly and monthly time frames.
In the current market scenario, I am expecting that the bullish momentum will continue.
Complete price projection like entry, stop loss and targets mentioned on the charts for educational purpose.
Don't Forget to Follow me to get all the updates.
Please share your feedback or any queries on the study.
Disclaimer: Please consult your financial advisor before making any investment decision

MidCap vs. LargeCap. Technical & Fundamental Levels to WatchThe Russell 2000 trailed the S&P 500 significantly in 2023, gaining about 17% compared to a gain of about 24% for the large cap index. That underperformance has spilled over into 2024.
As of July 10, 2024 the Russell 2000 YTD is about Zero compared to a 17.75% gain in the S&P 500 (SPX) and 23.50 gain in Nasdaq Composite Index (IXIC).
By the way, that valuation measures make the small cap Russell 2000 index much more compelling when compared to the S&P 500.
Small caps relative to the S&P 500 on a price-to-book basis is back to where it was in 1999.
As of June 30, 2024 small caps price-to-book (P/B) ratio is 2.10, as it described on FTSE Russell 2000 Index Factsheet, while Total US Market (Russell 3000) P/B ratio is 4.42.
I'll be brief. Perhaps it will be the briefest brief over the past ten god years I'm here on TV.
DON'T MISS IT, AS IT ONE PER LIFE OPPORTUNITY.
The main technical graph is ratio between RUT (Russell 2000 Index) and S&P500 Index, and it back to support that was never seen over the past 25 years, since March 1999.
What's happened with market at these times?
⭐ Nasdaq Composite Index doubled in price over the next 12 months (March, 1999 - March, 2000), than turned 4x down.
⭐ S&P500 Index printed +20 per cents (March, 1999 - March, 2000), than turned 2x down.
⭐ March 1999 was the absolute low and was a launch point of 12 years of outperformance for Small caps vs Large caps.
Will history repeat itself..? Who knows... But personally I believe - Yes, it can.
