Bitcoin heading to 98K Clear W pattern or double bottom here and if we break 91-600 to 91,700 rang then a 98K target makes sense.
If your struggling with understanding this let me know more than happy to help
Kris
Mindbloome Exchange
Mindbloomexchange

Netflix Going to 82 or lower? Here is a quick analysis of the market of we are currently seeing, if you need further help and are struggling send me a DM more than happy to answer any questions you may have
Trade Smarter Live Better
Kris

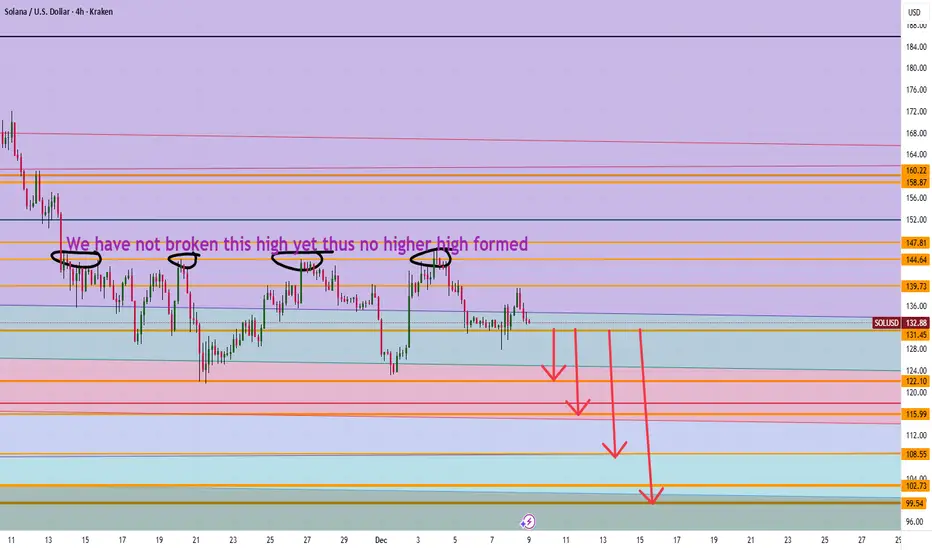
Is Solana heading to $100 It appears we have not made new higher highs in price action on the 4 hour and thus a possible movement down to $108 then 100 levels make sense. However if we can break 139 level then 147 can make sense going up.
Trade Smarter Live Better
Kris
BTC is Bearish 81400 Head & Shoulders Pattern Good morning
As you can see easy to spot head and shoulders pattern for this Bearish move for BTC with a target of $81,400 range and yes we can go lower however in this trade this is currently the target.
Any questions or struggling with understand on how to trade BTC let us know more than happy to help
Mindbloome Exchange/ Kris

Solana Breakout to 153/156/ and 159 Jump on this MOVE !! Breakout on COINBASE:SOLUSD gets real only if we clear 144.67 with conviction. Above that, the levels to watch are 153, 156, and 159 for potential take profits.
Trade Smarter, Live Better/ Mindbloome Exchange.
If your trading feels stuck or you’re wrestling with a position right now, shoot me a message. Tell me what you’re doing, what’s not working, and I’ll send you a free, specific tweak you can test this week. No fluff, just something you can implement and see if it moves the needle.
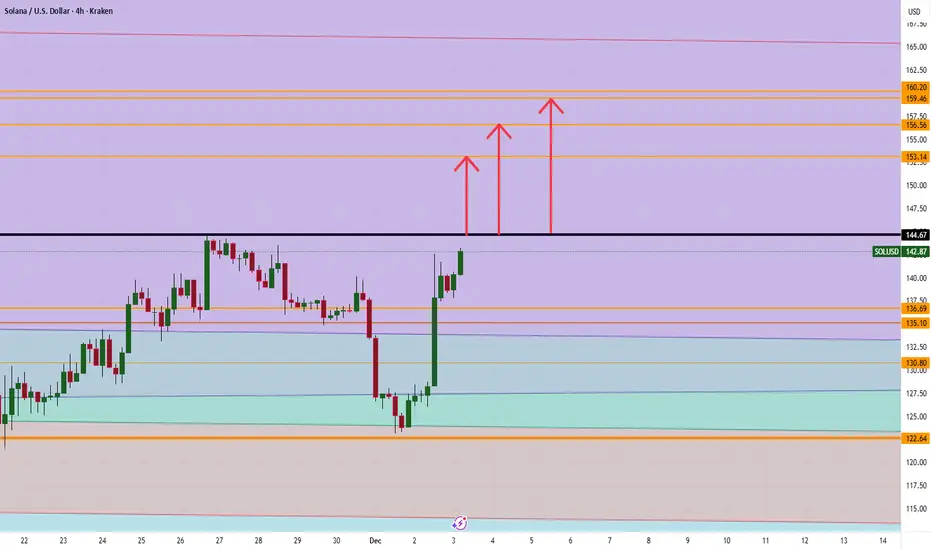
Solana Explosion: Will SOL Hit $183 or Crash Below $100?If SOL breaks above 144.77, next stops are 153.65 and possibly 183 on strong momentum.
But dropping below 130 could trigger a sharp slide toward the $100 zone—watch these levels!

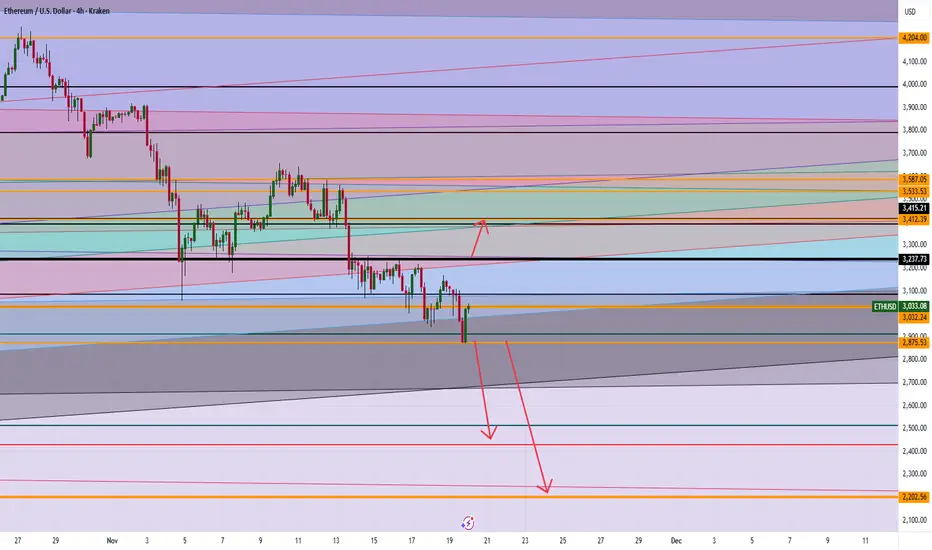
ETH Breakout Levels: Is $3,600 Next or Will Ethereum Crash to $2If ETH holds above 3237, clear momentum targets the 3400 range, with further upside potential toward 3500–3600 if buyers keep control.
A sustained break below 2875 opens the path to 2500, and possibly deeper toward 2200 on heavy selling pressure.
Any questions send me a DM
BTC DOWN TO 80K? Based on what we are seeing here if BTC breaks through 100K then the next level down is 80K marker and if that does not hold then 70-72K marker makes sense
However If we can make new highs and break 107K then it is possible to continue upwards
If you want a deeper dive on BTC or any other crypto or stock or commodity you have been watching comment below the stock or asset and I will send you personally an analysis of that asset.
Happy Trading
Trade Smarter Live Better
Mindbloome Exchange

Stop Overcomplicating Trading: The Consistency Blueprint No One Stop Overcomplicating Trading: The Consistency Blueprint Nobody Wants to Talk About
Two decades in the market have taught me a very real truth:
Profit isn’t about being the smartest or catching the breakout. It’s about showing up for yourself every week; especially when motivation disappears and the trades get hard.
I’ve been at this 20 years; through bull runs, ugly drawdowns, burnout, and those quiet Sunday reviews where nothing made sense. The only thing that’s kept me in the game and steadily profitable? Building ultra-simple consistency habits that actually fit my life.
Let me give it to you straight: here’s how to move the needle, no matter where you are:
Forget perfection. Track what REALLY matters.
For most, it’s not a magic strategy—often it’s reviewing trades, keeping promises to yourself, and taking care of your brain and sleep before the next setup.
Pick 2-3 metrics and make them sacred:
For me, it’s weekly trade review, a “focus” score for my setups, and legit sleep tracking. I only look at these, period.
Make review time non-negotiable:
I set aside 20 min a week, never skipped. It’s my reset button after wins and losses.
Write out quick wins & lessons—immediately after they happen.
Let the good trades teach you, but also let the ugly ones humble you and anchor your next week.
Adapt your process to real life:
Swing trading while working? Happens. Family? Kids? You can STILL win long-term—just make the review and tracking match your schedule, not some internet hustle template.
Build the feedback loop
When you slip, note it fast and tweak (don’t obsess). When you nail it, reward yourself—not with risk, but acknowledgment.
How do you know it works? Because it’s kept me in profit while teaching hundreds of traders to turn routines into actual results.
If you’re battling for consistency DM me “Tools” or drop it in the comments. I’ll send my simple routines that changed the game for me and dozens of traders.
Let’s build consistency that lasts and celebrate small wins relentlessly.
If I can help, I will.
Silver Market Update Easy Breakdown!Silver’s been showing some strong moves lately ⚡ but it’s at a key decision point right now.
Here’s what I’m watching:
📉 If silver drops below 51.2, we could see a pullback toward 49.30–49.00 before the next push higher.
📈 For silver to reach the next big highs around $70, it needs to break above 52.60 first.
If that happens, the next targets are 54.60 and 57.00.
💡 So short-term dips? Totally normal.
Long-term silver still looks strong if it can clear those resistance levels.
Want to see how I’m reading these moves and what I’m watching next before it happens?
💬 DM me “SILVER” and I’ll share my private breakdown and targets directly.
Mindbloome Exchange
Trade Smarter Live Better

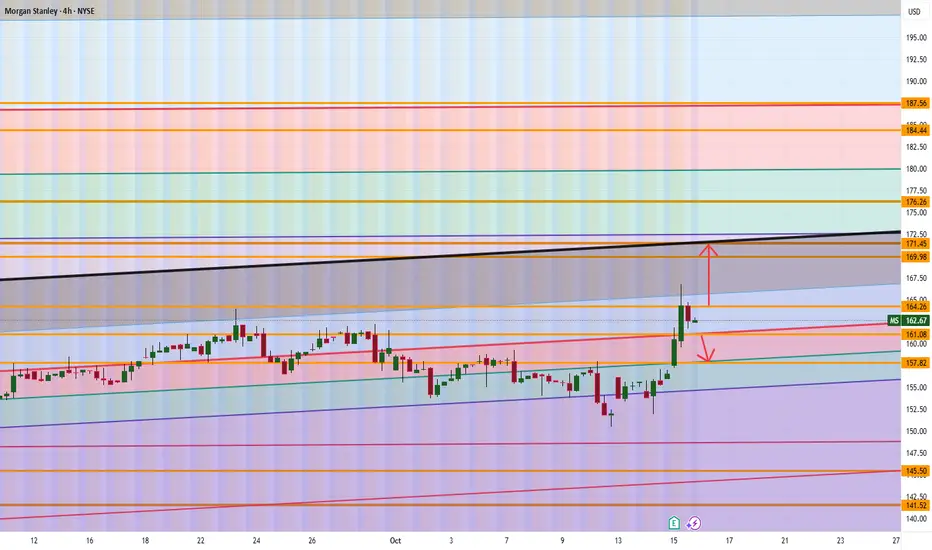
Morgan Stanley (MS) Simple Market Breakdown!MS is sitting at an important level right now; it’s getting ready to make its next big move 📊
Here’s what I’m watching:
📈 If we can close above 164.26, the next push could take us up toward 169–171 before hitting any major resistance.
📉 But if we drop below 161, then a move down toward 157.80 makes sense as the next target zone.
💡 In short: it’s all about which side breaks first; above 164.26 = bullish move 🔼, below 161 = bearish pressure 🔽.
Want to see how I’m planning around these levels and what confirmations I’m looking for before entering a position?
💬 DM me “MS” and I’ll share my full chart setup directly.
Mindbloome Exchange
Trade Smarter Live Better
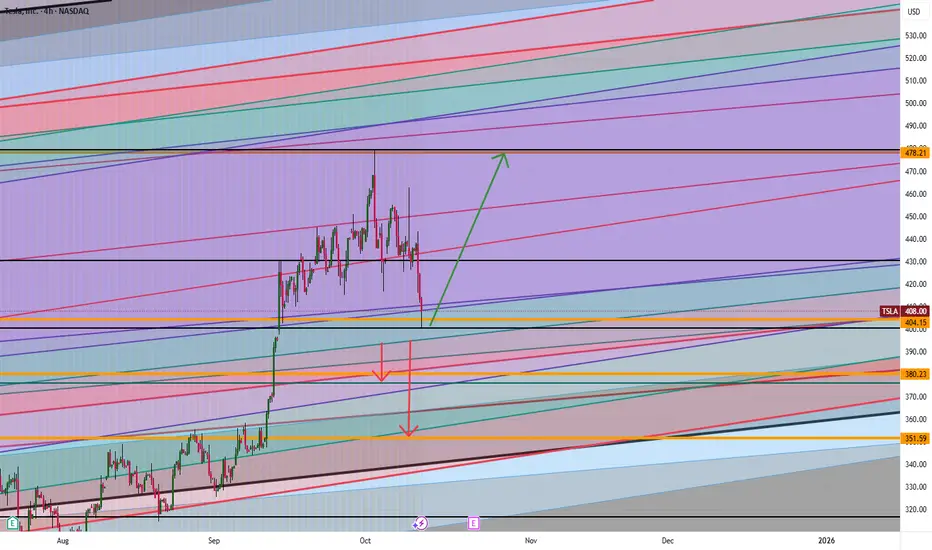
Tesla: Will It Blast Off or Fall Fast? The $404 Level Is the KeyTesla is at a big “make or break” point. If the price stays higher than $404, it could blast up to $437 or maybe even $478. But if Tesla drops below $404, watch out! It could fall down to $380 or even as low as $351.
Think about it:
What would you do if Tesla started moving toward those numbers? Do you think it will go up or will it go down?
If you’re not sure or have a question, send me a message! Sometimes asking one good question can help you make a smarter trade. What do you want to know about Tesla right now?
Mindbloome Exchange
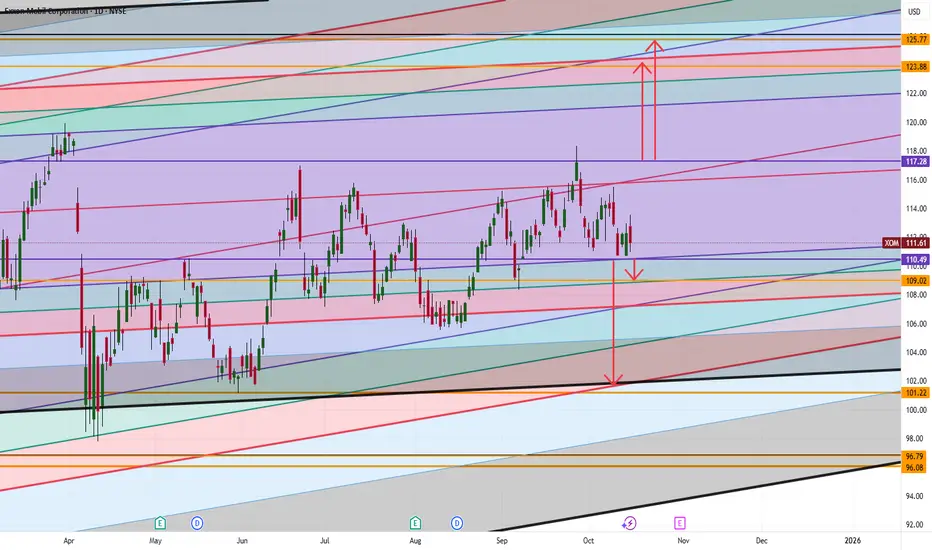
Exxon Mobil (XOM) Simple Market Breakdown!XOM’s sitting at a key level right now; momentum could go either way depending on the next breakout ⚡
Here’s what I’m watching:
📈 If we break above 117.28, that could open the door for a push up toward 123–125; that’s our next major target zone.
📉 But if we drop below 110.49, then we could see a move down toward 109, and possibly even 101 if selling pressure continues.
💡 So, short-term watch those breakout and breakdown levels closely.
Long-term ; whichever side breaks first will likely set the direction for the next big move.
Want to see how I’m tracking these levels and the signals I’m using to confirm the breakout?
💬 DM me “XOM” and I’ll share my private chart breakdown directly.
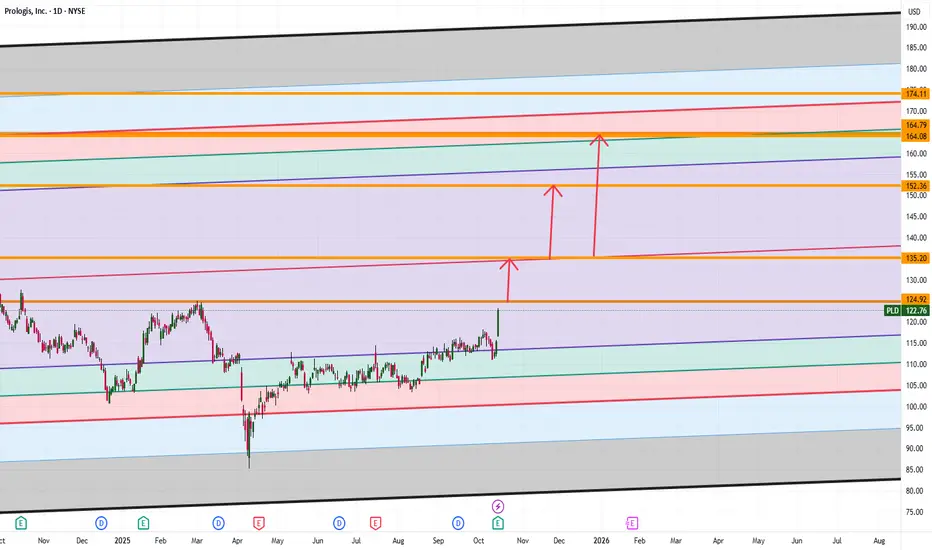
Prologis (PLD) Simple Market Breakdown!PLD’s been showing solid momentum lately 📈 and here’s the key zone I’m watching:
✅ If we break and hold above 124.92, the next target zone is around 135.20.
⚠️ At that level, we could see some correction or sideways movement (a bit of rest before the next move).
🚀 But if PLD breaks above 135.20 and holds, that could set up the next big leg toward 152, and possibly 164.
💡 So short-term; watch for a small pause. Long-term; momentum still looks strong if we keep closing higher.
Want to see how I’m mapping out the next levels and what signals I’m tracking for confirmation?
💬 DM me “PLD” and I’ll send you the full chart breakdown directly.
Mindbloome Exchange
Trader Smarter Live Better
Copper (HG1) Market Watch Simple & Clear!Copper’s looking strong right now 💪 and it might be setting up for a big move.
Here’s the key level I’m watching:
📈 If copper breaks and closes above 5.41, that could open the door for a run all the way up to 7.13.
That’s a big potential move but only if we hold strong above that breakout level.
💡 Right now, it’s all about confirmation ; a clean close above 5.41 could shift the trend in a big way.
Want to see the chart setup I’m using and how I’m planning around that 5.41 breakout?
💬 DM me “COPPER” and I’ll send you the exact breakdown directly. 🚀
Mindbloome Exchange
Trade Smarter Live Better

Gold Market Update (Easy to Understand!)Gold’s still shining bright; it’s in a bull market, meaning prices are mostly going up 🟢.
But even in a bull market, prices can dip before the next big move. Here’s what could happen next:
📉 If gold falls below 4205, we could see it slide down to 4184 or even 4181.
📈 After that, it might climb again toward 4252, maybe even 4279.
💪 But if gold breaks above 4239, it could keep running up right away!
👉 The big picture: gold still looks strong long-term; just expect a few short dips along the way.
Want to know where I see gold going next and how to trade around these levels?
💬 DM me “GOLD” and I’ll share my next target before it hits the charts. 🚀
Mindbloome Exchange
Trade What You See, Not What You Think

Natural Gas (NG1) Make-or-Break Zone AheadEveryone’s watching Natural Gas right now and for good reason.
We’re sitting right at the edge of a big move.
Here’s the simple breakdown 👇
⚡ Hold above $3.00 → Price could chop around (consolidate) a bit.
🚀 Break above $3.56 → That opens the door to $4.10, and if momentum holds, even $5.40.
⚠️ Drop below $3.00 → Then we’re likely heading toward $2.43, and worst case, $2.16.
So basically:
👉 Above $3.56 = bullish path
👉 Below $3.00 = more downside ahead
This is one of those setups where patience pays; the next breakout could decide the trend for weeks.
If you’re tracking NG1 and want help spotting the next move (without all the complicated jargon), DM me; happy to share how I’m mapping my entries and risk zones in real time.
Mindbloome Exchange

Gold Is on Fire: Can XAU/USD Hit $4130 Gold’s price is really strong right now. As long as gold stays above $4000, it can move up to $4130. But if gold drops below $4000, it could slow down or even start to fall.
What do you think will happen next, do you think gold will keep going up or fall back down? Have you ever watched gold make a big move before?
If you want to know what to do or have any questions, just ask me! Sometimes a simple question can help you learn something new about trading gold. What do you want to know about gold today?
Mindbloome Exchange
Trade Smarter Live Better

WTI Crude Oil: What Could Happen Next?Oil prices are sitting at a really important spot right now. Here’s what to watch for:
If the price drops below $58.28, it could keep falling toward $50.
If it breaks below $50, we might see it slide into the $43–$46 range.
But if oil climbs back above $65, it could run up toward $74 again.
So in simple terms:
👉 Below $58 = could fall more
👉 Above $65 = could rise again
We’re in a “wait and see” zone ; the next move will show which way oil really wants to go.
If you’re watching this market and not sure what these levels mean for your trades, feel free to DM us ; happy to break it down in plain English or share how I’m looking at it myself.
Mindbloome Exchange

BTC/USD: Danger Zone Ahead—Here’s What I’m Watching Take a close look at what’s happening now. BTC/USD is on the edge at 111,060, and if that breaks, the next major levels are 106,470, 103,200, then possibly even 100,000. Markets can shift fast; are you prepared with clear levels and a plan, or will you get caught reacting?
If you’ve ever felt unsure about how to spot big moves before they happen, or wondered how some traders seem to always stay one step ahead, you’re not alone. What’s the one thing you wish someone had told you when the market started moving fast? What’s your biggest struggle when the price gets volatile?
Drop your thoughts or questions in the comments
Or if you want to dig deeper, my inbox is always open for a real conversation. Sometimes the right question is all it takes to unlock a breakthrough. What do you want to see covered next?

EUR/USD Calm Before the Next Big Move?The Euro’s setting up for what could be a textbook correction before the next drive up.
The question now: does 1.14 hold… or do we break deeper? 👇
Here’s the simple map:
🔻 Correction zone: Price is cooling off toward 1.14.
⚡ If 1.14 holds, we could see a clean bounce and a new leg higher.
⚠️ If it breaks, then eyes on 1.12, 1.10, and in a worst-case dip, 1.08–1.07.
So basically:
👉 Hold 1.14 = bounce potential
👉 Break 1.14 = deeper pullback ahead
Momentum is slowing; this is where smart traders are patient, not panicked.
If you’re watching EUR/USD and unsure where the best risk-to-reward setups might form, DM me; I’ll walk you through how I’m mapping my key levels and what I’m waiting for before jumping in.
Mindbloome Exchange

S&P 500 (SPX) Simple Break Down The S&P (SPX) is sitting at a key turning point. Here’s what to watch for next:
If price drops below 6553, we could see it keep falling toward 6469 and if that breaks, then possibly down to around 6398.
But if price pushes above 6763, the next big target area could be 7237–7274.
So basically:
👉 Below 6553 = likely drop
👉 Above 6763 = likely climb
Right now, we’re in a tight spot where either direction could open up a strong move.
If you’re unsure how to trade around these levels or what kind of pullback makes sense, shoot me a quick DM
I can walk you through how I’m looking at setups and risk zones in plain English.
Mindbloome Exchange

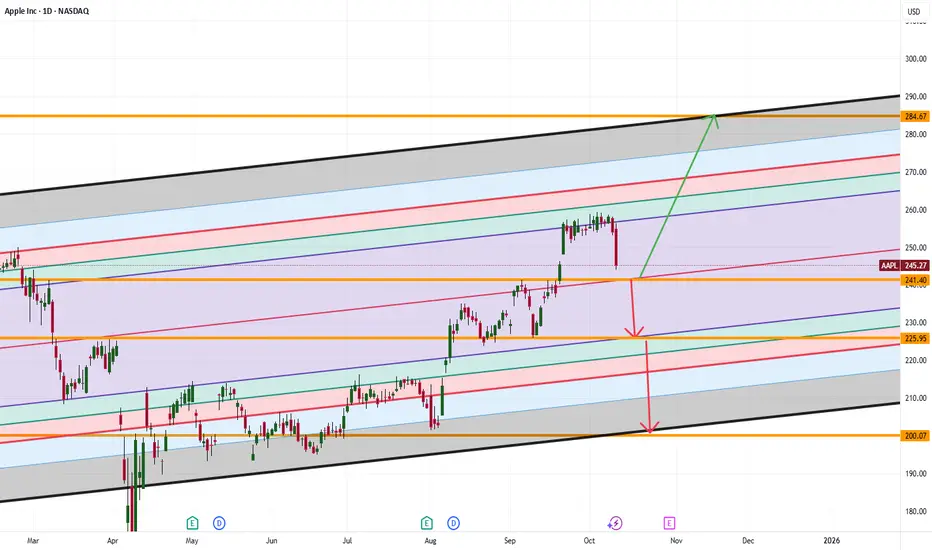
Apple’s $241 Bounce or Breakdown: Is This the Next Big Move?Apple’s stock price is moving down toward $241. This is an important zone. If Apple can stay above $241, it could jump up to $284. But if it falls below $241, the price might drop even more; maybe to $225 or even $200.
What do you think will happen next? Would you buy Apple if it drops to $241, or would you wait for a bigger move?
If you’re not sure what to do or have questions, ask me! Sometimes asking the right question gives you the answer you need to trade smarter. What’s your question about Apple right now?
Mindbloome Exchange
Trade Smarter Live Better