Missed the Silver Run? The Miners Are Finally Waking Up.📝 The Second Chance Setup If you followed our analysis on the WDC AI Vault and the Silver Supercycle , you caught the initial move. But if you missed those entries, don't chase the top. Look for the lag.
The "Catch-Up" Trade ( NYSE:CDE ) While Spot Silver has gone vertical to $80.00 (ATH), the miners have been asleep at the wheel. Coeur Mining ( NYSE:CDE ) is still trading near $20.40.
The FOMO Cure: You aren't buying extended highs here. You are buying a coiled spring that hasn't released yet.
The Valuation Gap: At $80/oz Silver, CDE is a cash-flow monster. The market is pricing it like Silver is still $30. That gap must close.
1. The Chart:
Daily Squeeze (Symmetrical Triangle) 📉 I’ve attached the Daily Chart.
It doesn't get cleaner than this:
The Pattern: A tight Symmetrical Triangle. We are coiled.
The Pressure: Price is pinned between the $20.50 Resistance and the rising support.
The Momentum: My "Fear & Greed" gauge is hitting 76 (Extreme Greed). Even though price is flat, the buyers are aggressive underneath.
📌 The Trade Plan We are playing the "Catch-Up."
Trigger: I am waiting for a Daily Candle Close above $20.55 to confirm the breakout.
Target 1: $23.60 (Recent Swing Highs).
Target 2: $28.00+ (Re-rating based on cash flow).
Invalidation: A close below $19.40 kills the setup.
Disclaimer: Just sharing my read on the sector rotation. Not financial advice.
💬 Discussion: Do you think the miners will outperform the metal in Q1? Let me know below. 👇
Mining

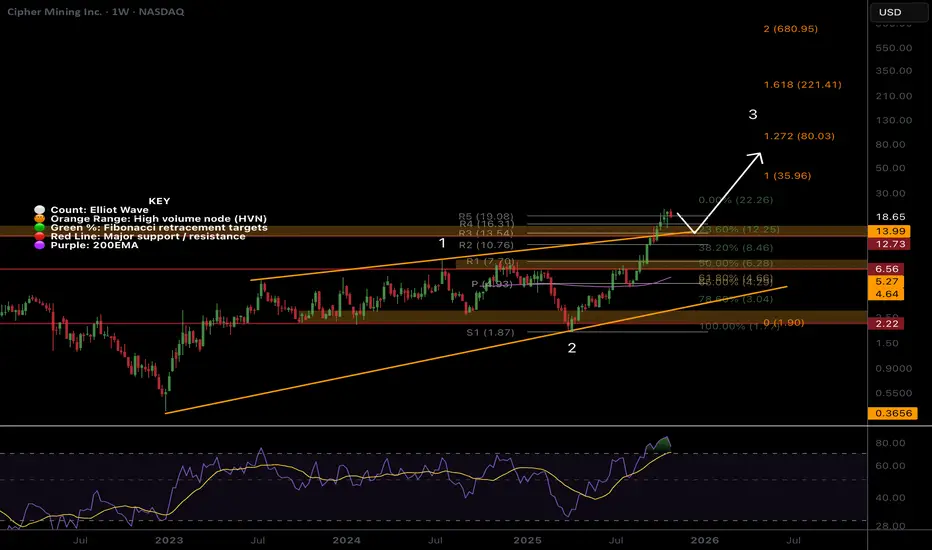
CIFR Macro analysis | The bigger picture | Long-term holdersNASDAQ:CIFR
🎯 CIFR remains in a wave (4) of 3 range, near the all-time high. Wave 4s are expected to be drawn out, often being a triangle or flat correction, where most traders give their money back to the market due to whipsaw and fakeouts.
📈 Weekly RSI has printed bullish divergence above the EQ, but with no strong reaction yet. This can take months to play out sometimes. Falling below the orange trend line will negate this divergence.
👉 Analysis is invalidated if price falls below the 0.5 Fibonacci retracement at $6.35
Safe trading

CIFR Short-term analysis | Trading and expectationsNASDAQ:CIFR
🎯 Wave d of the triangle may still be underway, wave e is expected to end at the daily pivot where price currently sits, above the daily 200EMA, showing the uptrend is still intact but flattening.
📈 Daily RSI bullish divergence has failed to play out, showing the bears are in control.
👉 Analysis is invalidated if price falls below wave C, $12.50, suggesting a deeper retracement
Safe trading

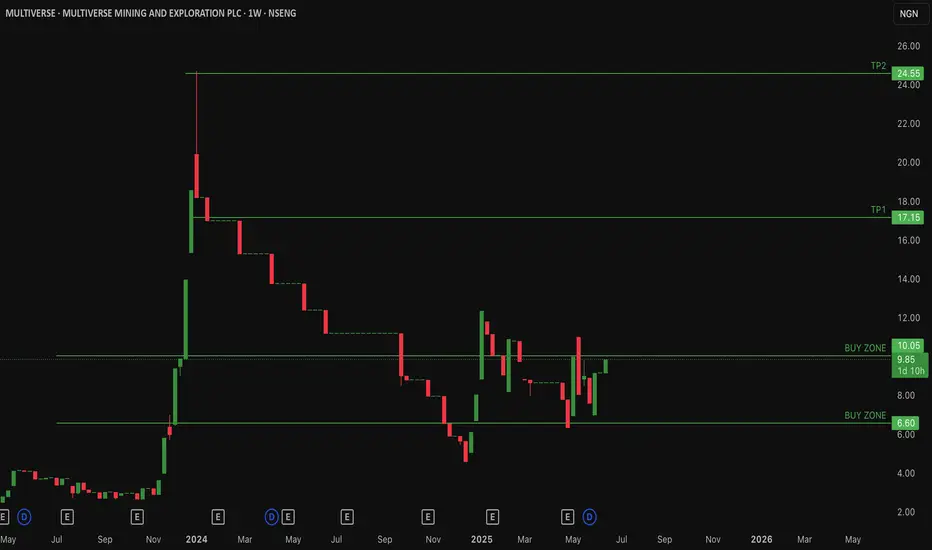
$MULTIVERSE Multiverse over 60% retracement from All time HighNSENG:MULTIVERSE Multiverse Mining & Exploration Plc focuses on quarrying solid minerals (granite, zinc, tin, tantalite, barite, columbite, gold, etc.) in Nigeria, with operations in Ogun and Nasarawa State.
Currently NSENG:MULTIVERSE has lost over 60% of its value from an all time high of 24.50/share and is in consolidation.
Current price: 9.85naira/share
Low risk Buy zone levels is between 6.8naira - 10naira/share
Expecting #Multiverse to retest previous resistances at 17naira/share and 24naira/share if price attempts a recovery.
📈 Key Levels
Breakout above ₦10.20 Breakout zone – key resistance turning into support if broken
₦17.1 TP1 – next major resistance (target)
₦24.5 TP2 – higher resistance / bull target
Invalidation of this idea is a weekly close under 6.8naira/share
Exploration of a possible longOn the Daily things look like they are on the rise for ILU. If the 50ema can act as support then and price action can bust through the ICH cloud and see a bit of daylight then a possible long is on the cards. Not financial advise, so it isnt.

Explosive set upLooking like coin flip time here on the daily chart of DNL. Looking for an entry point on lower time frames for a short play here. More to come and as always not financial advise, so its not.

The Real Bitcoin Bottom: It’s in the Power BillThe Cost of Mining 1 BTC – Autumn 2025 Deep Dive
First of all, I want to say that I already made a similar publication in 2020 about the cost of Bitcoin, and we reached these levels (the chart is below).
Introduction: The Bitcoin mining industry in Autumn 2025 stands at a crossroads. Network difficulty has soared to all-time highs, squeezing miner profit margins as hashpower races ahead of price. The hashprice – the daily revenue per unit of hashing power – has slumped to record lows around $54 per PH/s-day (down from ~$70 a year ago). Analysts expect this metric to languish between $50 and $32 until the next halving in 2028, underscoring how challenging the economics have become. In this environment, understanding the cost to mine 1 Bitcoin is more crucial than ever. Below, we present a detailed comparison of popular ASIC miners and analyze which rigs remain profitable (or not) at current prices. We’ll also explore how the cost of production acts like a magnetic price level for BTC – often drawing the market down to this “floor” before a rebound – and what that means for investors now.
Cost to Mine 1 BTC by ASIC Miner Model (at $0.03–$0.10/kWh)
To quantify Bitcoin’s production cost, we compare leading ASIC miners from Bitmain, MicroBT, Canaan, Bitdeer, and Block. Table 1 below shows key specs and the estimated cost to mine one BTC under different electricity prices (from very cheap $0.03/kWh to pricey $0.10/kWh):
Key Takeaways:
Electricity price is the dominant factor in mining cost. At an ultra-cheap $0.03/kWh (possible in regions with subsidized power or stranded energy), even older-generation miners can produce BTC for well under $30k per coin. In our table, all models have a cost per BTC between ~$21k and $27k at $0.03/kWh – a fraction of Bitcoin’s current ~$90k–$95k market price.
At a mid-tier rate of $0.05/kWh (typical for industrial miners in energy-rich areas), the top machines still show healthy margins. Bitmain’s flagship S21 XP leads with roughly $36k cost per BTC, while other new-gen rigs fall in the ~$39k–$45k range. These figures imply profit margins of 50–60% for efficient miners at $0.05 power.
At a pricey $0.10/kWh (common for retail electricity or high-tariff regions), mining costs skyrocket. Only the very latest ASIC (S21 XP) stays comfortably below the current BTC price, at around $72k per coin. Most other models hover in the $78k–$90k range, meaning their operators are earning little to no profit at spot prices. In fact, at $0.10/kWh, a miner like the Avalon A15 Pro would spend about $89k to generate one BTC – essentially breakeven with Bitcoin at ~$90k. This illustrates why high-power-cost miners struggle or shut off during downturns.
Profitable vs. Unprofitable: Current Market Reality
Which miners are still profitable at today’s rates? Given Bitcoin’s price in the low $90,000s and typical industrial electricity around $0.05–$0.07/kWh, the newest generation ASICs remain comfortably profitable, while older, less efficient models are on the edge. For example:
Latest-gen winners: The Bitmain S21 XP – with industry-best ~13.5 J/TH efficiency – can mine a coin for roughly $36k at $0.05/kWh, leaving a huge cushion against price. Even at $0.07/kWh (a common hosting rate), its cost per BTC would be on the order of ~$50k, still well below market price. Other 2024–2025 flagship units (Whatsminer M60S++, Bitdeer A2 Pro, Block’s Proto) likewise have breakeven power costs around $0.12–0.13/kWh; they remain viable in most regions except the very expensive ones.
Older-gen on the brink: By contrast, an earlier-gen workhorse like the Antminer S19 XP ( ~21.5 J/TH) or similarly efficient rigs from 2021–2022 generation become marginal at moderate power rates. An S19 XP mining at $0.08/kWh sees its cost per BTC climb to roughly ~$94k (near current price), and at $0.10 it exceeds $110k (mining at a loss). Many such units are only profitable in locales with <$0.05 power. This is why we’ve seen miners with older fleets either upgrade or retire hardware as the margin for profitability narrows.
The efficiency gap: The spread between best-in-class and older miners translates directly into survivability. A miner burning 30–40 J/TH can only stay online if they have extremely cheap electricity or if BTC’s price is far above average production cost. As of Q4 2025, Bitcoin’s price is indeed high, but so is the network difficulty – meaning inefficient gear yields so little BTC that electricity costs outweigh revenue in many cases.
According to one industry report, the cost of mining 1 BTC varies widely across companies – from as low as ~$14.4k for those with exceptional power contracts (e.g. TeraWulf’s U.S. facilities) to as high as ~$65.9k for others like Riot Platforms, even before accounting for overhead. (Riot’s effective cost was brought down to ~$49.5k after cost-cutting measures.) This huge range shows how electricity pricing and efficiency determine which miners thrive. In early 2025, the situation became so extreme that CoinShares analysts found the average all-in production cost for public mining companies spiked to ~$82,000 per coin – nearly double the prior quarter (post-halving impact) – and up to $137,000 for smaller operators
ixbt.com
. At that time Bitcoin was trading around $94k, meaning many miners, especially smaller ones, were underwater and operating at a loss. In high-cost regions like Germany, the breakeven cost even hit an absurd ~$200k per BTC, making mining there utterly unviable.
Bottom line: At current prices, only miners with efficient rigs and reasonably cheap power are making money. Those with older equipment or expensive electricity have minimal margins or are already in the red. This dynamic naturally leads to miners shutting off machines that don’t profit, which in turn caps the network hashrate growth until either price rises or difficulty drops. It’s a self-correcting mechanism – one that ties directly into Bitcoin’s production cost acting as a market floor.
Production Cost as Bitcoin’s “Magnetic” Price Level
There’s a saying in the mining community: “Bitcoin’s price gravitates toward its cost of production.” In practice, the production cost often behaves like a magnet and a floor for the market. When the spot price climbs far above the cost to mine, it invites more hashing power (and new investment in miners) until rising difficulty pulls costs up. Conversely, if price falls below the average production cost, miners start to capitulate – selling coins and shutting rigs – until the difficulty eases and the market finds a bottom. This push-pull keeps price and cost loosely tethered over the long run.
Notably, JPMorgan’s research this cycle highlighted that Bitcoin’s all-in production cost (now around ~$94,000) has “empirically acted as a floor for Bitcoin” in past cycles. In other words, the market has rarely traded for long below the prevailing cost to mine, because at that point fundamental supply dynamics kick in. As of late 2025, they estimate the spot price is hovering just barely above 1.0 times the cost (~1.03x) – near the lowest end of its historical range. This implies miners’ operating margins are razor-thin right now, and any extended move significantly below ~$94k would likely trigger miner capitulation and supply contraction. In plainer terms: downside from here is naturally limited – not by hope or hype, but by the economics of mining. If BTC dropped well under the cost floor, many miners would simply turn off machines rather than mine at a loss, removing sell pressure and helping put in a price bottom.
History supports this magnetic pull. In previous bear markets, Bitcoin has tended to retest its production cost during the worst of capitulations. For example, during the late-2018 crash and again in the 2022 downturn, BTC prices plunged to levels that put numerous miners out of business. But those phases were short-lived. Prices found support once enough miners quit and difficulty adjusted downward, allowing the survivors to breathe. The market “wants” to stay near the cost of production, as that is a sustainable equilibrium where miners neither drop like flies nor earn excessive profits. Whenever price strays too high above cost, it usually invites a surge in competition (hashrate) that raises the cost floor; when price sinks too low, hashpower falls until cost drops to meet price. It’s an elegant economic dance built into Bitcoin’s design.
Why Price Often Meets Cost Before Rebounding
If Bitcoin production cost is a de facto floor, why do we often see price fall all the way down to it (or even briefly below it) before the next big rally? The answer lies in miner psychology and market cyclicality:
Miner Capitulation & Shakeouts: Markets are cruel to the over-leveraged and inefficient. During bull runs, miners expand operations, often taking on debt or high operating costs under the assumption of continually high prices. When the cycle turns, Bitcoin’s price can free-fall toward the cost of production, erasing margins. The weakest miners (highest costs or debt loads) capitulate first – selling off their BTC reserves and unplugging hardware. This wave of forced selling can push price right to (or slightly under) the cost floor, marking a final “shakeout” of excess. Only when the weakest hands are flushed does the market rebound. It’s no coincidence that major bottoms often align with news of miner bankruptcies or mass liquidations.
The Iron Law of Hashrate: Miners are competitive and will run at breakeven or even slight loss for some time, hoping for recovery, rather than quit immediately. This means the network can temporarily operate above sustainable difficulty levels. Eventually, however, reality sets in. When enough miners can’t pay the bills, hashrate plateaus or drops, halting difficulty growth or causing it to decline. At that inflection point, the cost of mining stabilizes (or falls), giving relief to the remaining miners. The stage is set for price to rebound off the now-lower equilibrium. In essence, Bitcoin often has to tag its production cost to force a network reset and purge imprudent operators. Only after that cleansing can a fresh uptrend begin with a healthier foundation.
Investor Sentiment at the Floor: From a contrarian market perspective, a convergence of price and production cost typically corresponds with maximum pessimism. If Bitcoin is trading at or below what it “should” cost to make, it signals extreme undervaluation to savvy investors. In late 2022, for instance, estimates of BTC’s cost basis in the $18k–$20k range coincided with the market trading in the mid-$15k’s – a level where miners were going bankrupt and sentiment was in the gutter. Yet those willing to be greedy when miners were fearful reaped the rewards when price recovered. The same pattern could be unfolding now in late 2025: the public is fearful of Bitcoin’s recent pullback, but its cost floor (~$94k) suggests fundamental value support. Smart money knows that when price meets cost, downside is limited and upside potential grows.
Conclusion – Steeling Ourselves at the Cost Floor
In EXCAVO’s signature fashion, let’s cut through the noise: Bitcoin’s production cost is the line in the sand – the magnetized level where price and reality meet. As of Autumn 2025, that line hovers in the mid-$90,000s, and Bitcoin has indeed been gravitating here. The data shows miners barely breaking even on average. This is a make-or-break moment. If you’re bullish because everyone else is, check your thesis – the real reason to be bullish is that BTC is scraping its cost floor, a level from which it has historically sprung back with vengeance. Conversely, if you’re panicking out of positions now, remember that you’re selling into the teeth of fundamental support. The market loves to punish latecomers who buy high and sell low.
Yes, the mining industry is under stress; yes, the headlines scream fear. But those very pressures are what forge the next bull run. Every miner that shuts off today is one less source of sell pressure tomorrow. Every uptick in efficiency raises the floor that much higher, like a coiled spring tightening. Bitcoin has been here before – when production cost and price locked jaws in late 2022, and again in early 2025 post-halving. Each time, the doom and gloom was followed by a dramatic recovery as the imbalances corrected.
Our contrarian take: The cost of mining 1 BTC isn’t just a number on a spreadsheet – it’s the secret pulse of the market. Right now it’s telling us that the bottom is in or very near. Prices might chop around this magnet a bit longer, even dip slightly below in a final fake-out, but odds of a deep crash under the ~$94k cost basis are slim. The longer Bitcoin grinds at or below miners’ breakeven, the more hashpower will fall off, quietly tightening supply. When the spring releases, the next upward leg could be explosive (as even mainstream analysts like JPMorgan are eyeing ~$170k targets).
In summary, Bitcoin tends to revisit its production cost for one last test – and when it holds, it launches. Autumn 2025 appears to be giving us that test. The savvy, data-driven operator will view this not with panic, but with patience and resolve. After all, if you can accumulate Bitcoin near its intrinsic mining value while the herd is fearful, you position yourself on the right side of the trade once the inevitable rebound kicks in. As the saying goes, bears win, bulls win, but miners (and hodlers) who understand the cost dynamics win big in the end. Brace yourself, stay analytical, and remember: Bitcoin’s true floor is built in watts and hashes, and it’s solid as steel.
Best regards EXCAVO

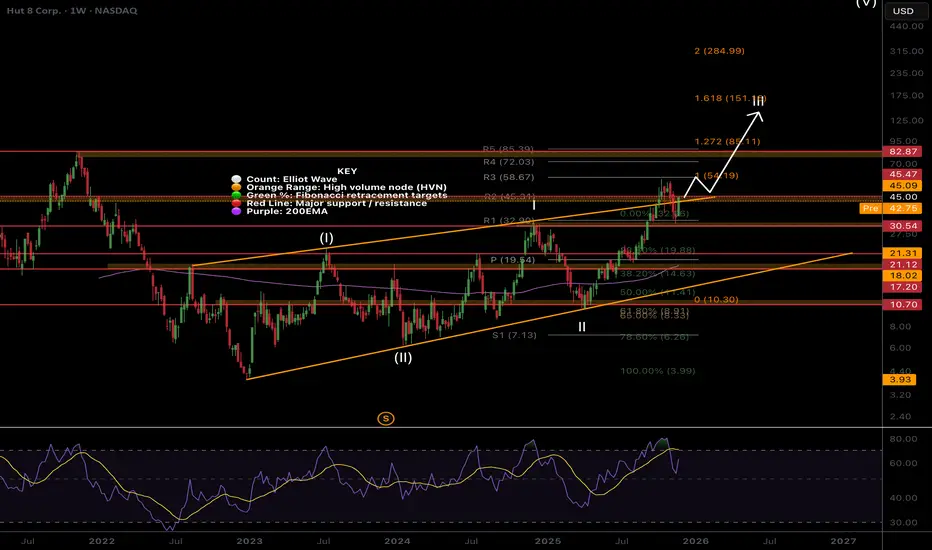
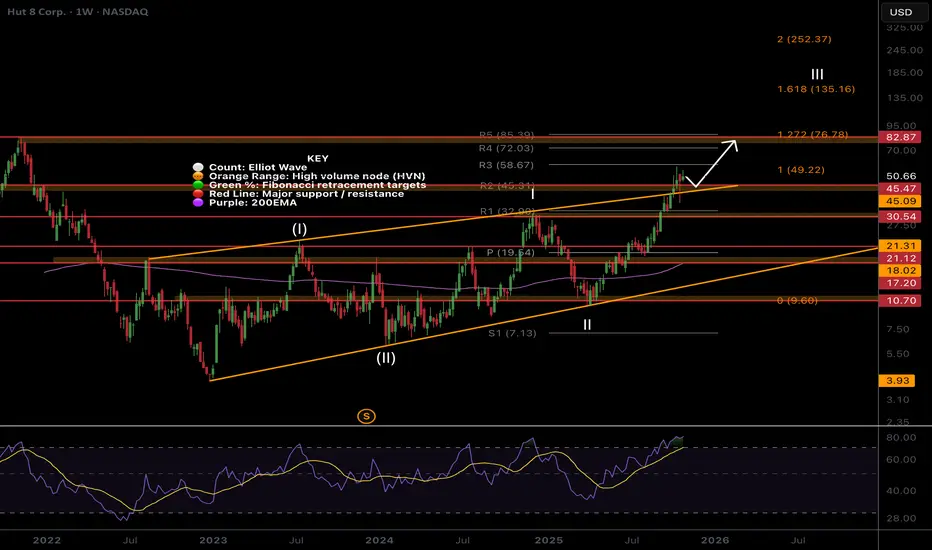
HUT Uptrend intactNASDAQ:HUT A large bearish engulfing candle at major resistance saw the price drop back into the range. It is now attempting break-out once more.
Price remains in a firm uptrend at major resistance with not much to add.
🎯 Terminal target for the business cycle could see prices as high as $135 based on Fibonacci extensions
📈 Weekly RSI hit overbought and reset back to the EQ.
👉 Analysis is invalidated if we close back below the weekly 200EMA
Safe trading
RIOT Macro outlook, weekly bullish divergenceNASDAQ:RIOT tested the upper boundary trend-line after its breakout. Expected behaviour.
A large weekly candle formed after hitting the weekly 200EMA and support suggesting the bottom is in.
Price remains above the downtrend and showed strength by poking above the wave 1 high.
🎯 Terminal target for the business cycle could see prices as high as $112 based on Fibonacci extensions
📈 Weekly RSI has bullish divergence
👉 Analysis is invalidated if we close below $6.33
Safe trading
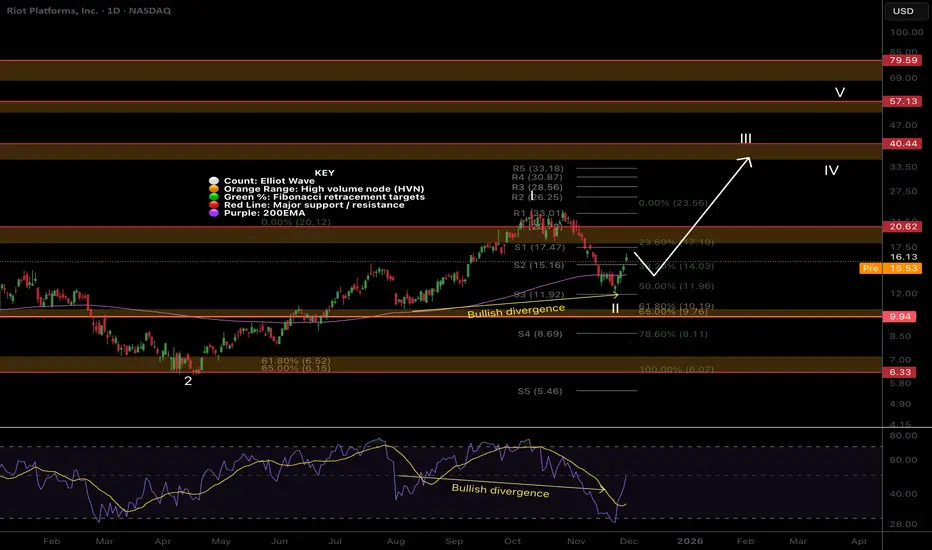
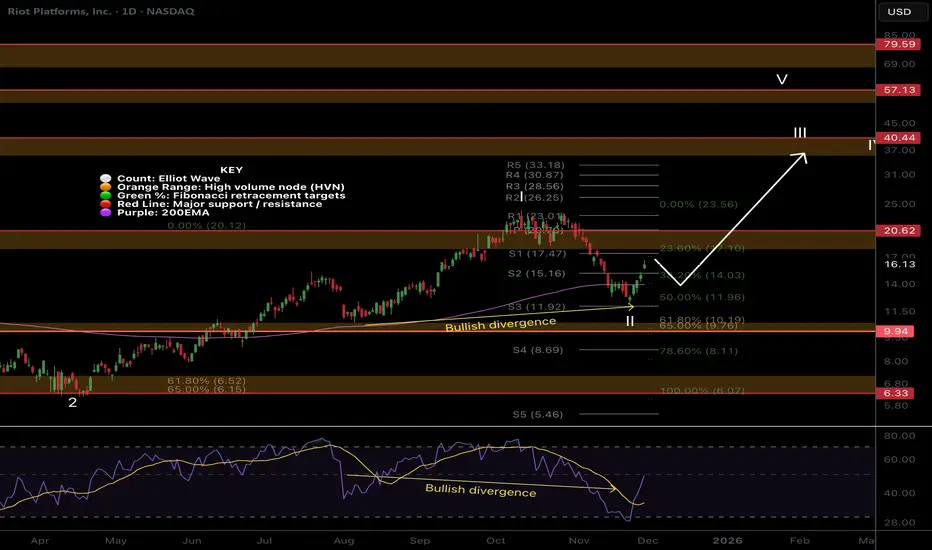
RIOT holding up stronger than the others..NASDAQ:RIOT Price remains in its uptrend and wave II of 3 appears complete with a 3 white knight bullish candle pattern.
Price recovered the daily 200EMA and looks rady for higher.
📈 Daily RSI hit oversold with bullish divergence
👉 Continued downside has a target of the High Volume Node, $10
Safe trading
MARA struggling...NASDAQ:MARA Price dropped hard, changing the Elliott wave count completely, stopping at the golden pocket.
Wave (z) of B appears complete, but we need to see a structure change to add confirmation, so the probability is to the downside with a target of the $8 High Volume node.
📈 Daily RSI went deep into oversold
👉 Continued downside has a target of the High Volume Node, $8
Safe trading

IREN, still lower to go...NASDAQ:IREN wave 4 appears to want one more pusher lower towards the daily 200EMA and 0.382 Fibonacci retracement.
Price has broken its uptrend on bearish divergence and is yet to show strong support, suggesting we continue lower next week.
📈 Daily RSI has printed a bullish divergence, but not from oversold
👉 Continued downside has a target of the daily 200EMA, $26.75
Safe trading

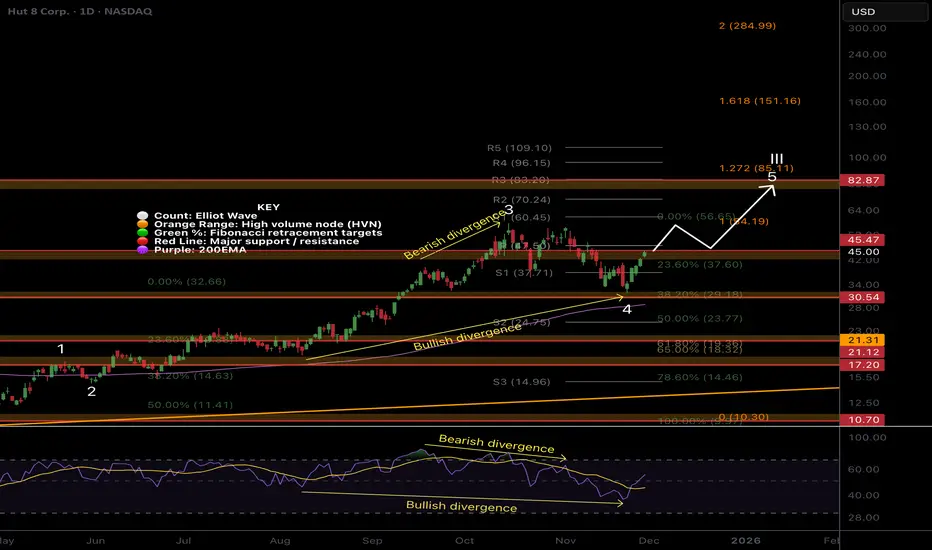
HUT ready for higher?NASDAQ:HUT Wave 4 appears complete at the 0.382 Fibonacci retracement and High Volume Node just above the daily 200EMA, proving its value by holding up better than the other assets.
Daily bearish divergence played out into bullish divergence as price caught a huge bid in the bullish, 3 white knights pattern. Resistance looms directly ahead, and a breakout above the daily pivot should see price head towards the $80 target High Volume Node.
📈 Daily RSI has printed a bullish divergence
👉 Continued downside has a target of the daily 200EMA, $28
Safe trading
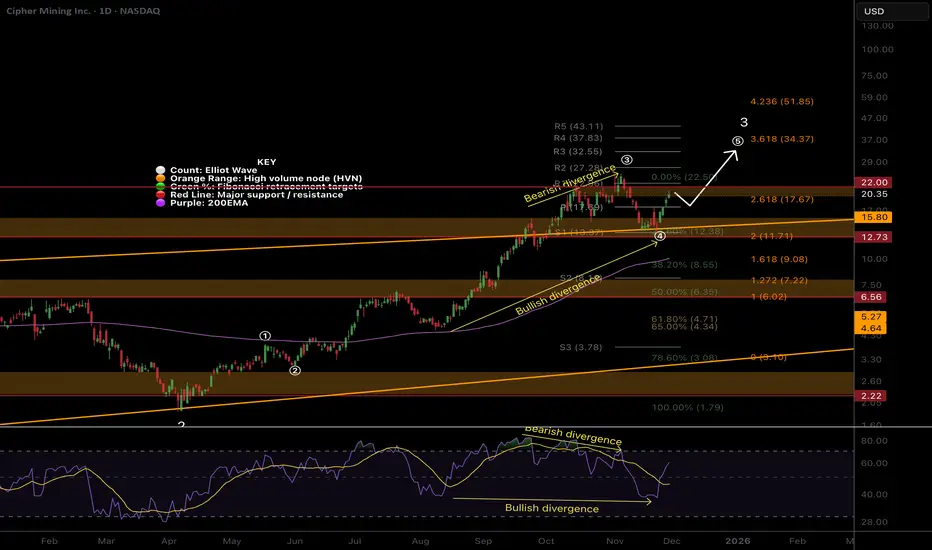
CIFR Ready for higher?NASDAQ:CIFR We got the pullback I was looking for from the last report. Locally, price appears to have completed wave (4) of 3 and looks ready for continued upside.
Wave (4) tested the previous trend-line, S1 pivot, 0.236 Fib and High Volume Node as support- a strong support area.
📈 Daily RSI has printed a confirmed bullish divergence from oversold.
👉 Continued downside has a target of the 200EMA at $11
IREN charges up after the pullbackThe price of IREN pulled back to the lower boundary of the expanding channel and touched the 100 period moving average on the 8 hour chart. The 48 zone acted as support earlier and buyers are showing interest there again. A base is forming. A breakout above 62 can activate movement toward 76 and later 100 where the next expansion target sits.
IREN operates large scale data centers and high performance computing infrastructure including bitcoin mining and enterprise hosting. The key advantage of the company is access to low cost renewable energy which keeps hash rate costs low and allows stable scaling.
The fundamental picture on November 26 remains stable. The company continues to expand its data center capacity. Leverage stays low. The bitcoin network maintains strong activity which supports revenue. Hash rate competition increases but operators with cheap energy access like IREN gradually strengthen their market position.
As long as the price stays above the 48 zone and above the 100 period moving average the recovery structure remains valid. A confirmed move above 62 opens the path to 76 and then 100 . A move below 48 will return price to deeper consolidation.
Even miners need a pause to recharge but after such pullbacks energy normally returns very quickly.

CHN ready to runCHN has demonstrated encouraging developments after emerging from a descending wedge pattern, bolstered by a bullish RSI divergence and the formation of a bull flag on the hourly chart. Furthermore, the daily chart reveals hidden bullish divergence, complemented by support from a trendline established in July and a .05 Fibonacci retracement level. A decisive move above $2 would serve as a strong indicator of a structural shift, potentially paving the way for a more substantial upward trend. Good luck and happy trading! 🍀

IREN ready for pullback?Price has overextended in a macro wave 3, the strongest and most powerful move described as a “wonder to behold” by Ellioticians. Novice investors are likely to get over-confident in these conditions, enter without risk management and keep chasing price upwards only to be underwater when it turns around.
Profit taking appears to be taking place, I have closed my positions waiting for re-entry. The weekly pivots have been ran.
Initial downside targets for wave (4) is the 0.236 Fib retracement at $39 followed by the 0.382, $26.43. Expect shorts to pile in adding to any downside momentum.
In the long term we have higher to go towards $100 in wave (5).
🎯 Terminal target for the business cycle could see prices as high as $100 based on Fibonacci extensions
📈 Weekly RSI is oversold with no divergence and can remain here for months as price keeps increasing.
👉 Analysis is invalidated if we close back below the weekly 200EMA

HUT, ready for more upsideHuge daily candles are perfectly normal behaviour and nothing to be afraid of, we stay zoomed out to observe the larger trend to keep our emotions check.
Price has broken out of the channel upper boundary and a test of the boundary took place as expected, quickly catching a bid. We are now looking for continuation to trigger a long.
The next target is the High Volume Node resistance at $82 just under the R5 weekly pivot. Fibonacci extension 2 has a terminal target of $252, achieved with momentum and tailwinds only.
📈 Weekly RSI is oversold with no divergence and can remain here for months as price keeps increasing.
👉 Analysis is invalidated if we close back below the weekly 200EMA
CIFR shallow pullback still on the cards!Price is in a macro wave 3, the strongest and most powerful move described as a “wonder to behold” by Ellioticians. When price is in a wave 3, pullbacks are shallow and few. Investors get overconfident and excited adding positioning without correct risk, swept up in the big move, aggravated by influencers and the media.
Testing the previous all time high at the 0.236 Fibonacci retracement and upper trend-line will be a strong support area and a place to look for a long, $14. While breaking out again into all time high could see price continuing its strong uptrend, this is doubtful as we have run the weekly pivots. Further downside has a target of the previous all time high and R1 pivot at $8.
📈 Weekly RSI is oversold with no divergence and can remain here for months as price keeps increasing.
👉 Analysis is invalidated below the weekly pivot and 200EMA ~$5
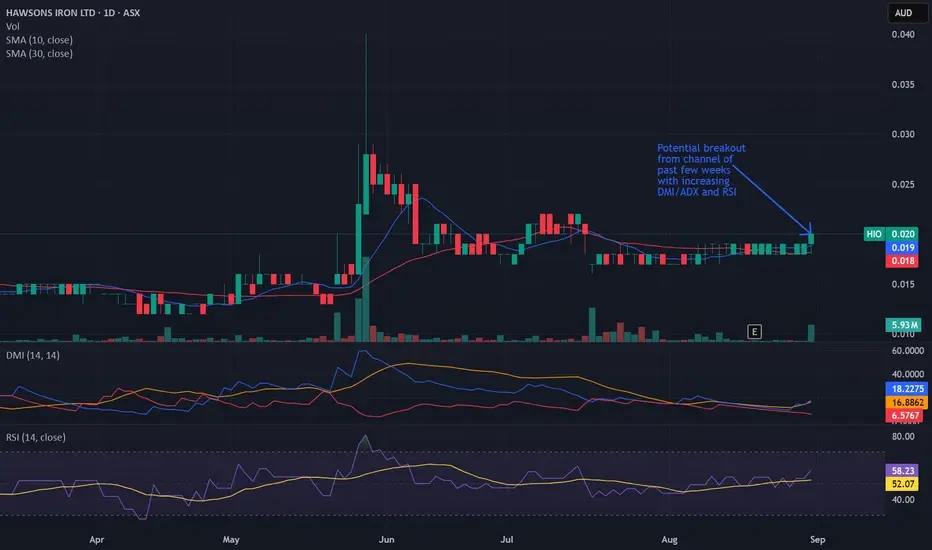
Bullish potential detected for HIOEntry conditions:
(i) higher share price for ASX:HIO along with swing up of indicators such as DMI/RSI (break out of recent channel).
Depending on risk tolerance, the stop loss for the trade would be:
(i) below previous support of $0.017 from the open of 7th August, or
(ii) below previous swing low of $0.016 from the open of 17th July.
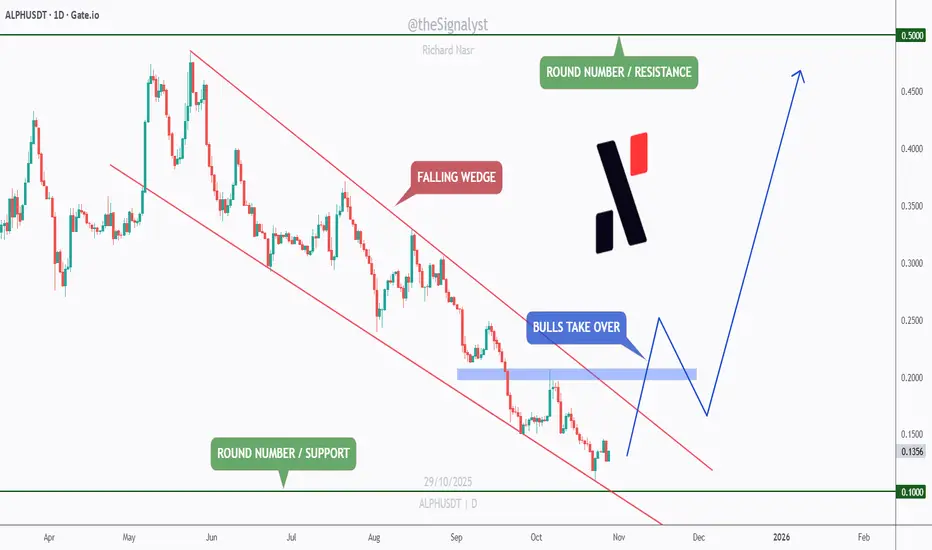
Alephium (ALPH) - “Wedge of Worth: Poised to Snap Higher"🌱 Fundamentals & Catalyst
- Alephium is a next-generation Layer-1 blockchain combining a stateful UTXO model, sharding tech (BlockFlow), and a “Proof of Less Work” consensus, offering high TPS and energy efficiency.
- The token ALPH powers the ecosystem: mining incentives, developer SDKs, and support for dApps built on the chain.
- Recent news show institutional-grade partnerships and roadmap momentum such as the Phase 2 Roadmap Teaser and PrimeVault custody integration.
Why this matters => The technical stack and ecosystem signals suggest ALPH is moving beyond speculative status into infrastructure play, creating a bullish tailwind for the setup.
📉 Technical Picture
- ALPH has been trading inside a clear falling wedge pattern, a classic bullish reversal structure indicating price compression ahead of a breakout.
- Price is now sliding toward the strong round-number support at $0.10, a psychological anchor and historical inflection zone.
- Trigger for confirmation: A clean break above the last major high (blue zone on chart) followed by a retest or sustained close above it.
- On that breakout, the first target is significant: the next round number at $0.50, offering substantial upside.
- Risk control: A sustained breakdown below $0.10 would invalidate the bullish reversal thesis and turn the wedge into a trap.
🧭 Trading Plan
- Watch zone: ~$0.10 support, ideal area to look for bullish reversal signals (rejection wicks, volume pickup, retest of breakout).
- Entry trigger: Break & hold above recent blue-zone high, with confirmation (H4/DAILY) + backing volume.
- Targets: $0.50 as primary upside; intermediate stops could scale profits earlier.
- Invalidation level: Close below $0.10 turns the bullish scenario off, flip to neutral/bearish until structural support reasserts.
⚠️ Disclaimer: This is not financial advice. Always do your own research and manage risk properly.
📚 All Strategies Are Good; If Managed Properly!
~Richard Nasr
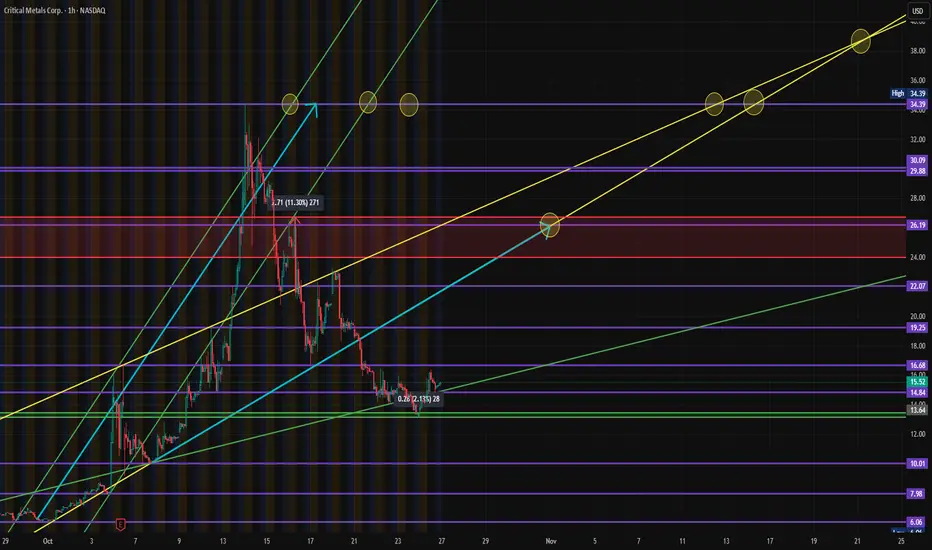
$CRML - Critical Metals - $16.08 Breakout | $26.19 RetestNASDAQ:CRML has been one of the most explosive rare-earth plays of 2025 — rallying from the single digits to a 52-week high of $34.39 before pulling back sharply to consolidate around the $13.64 support zone.
After cooling off from that massive run, price action has now begun compressing between $13.64 and $16.08, with early signs of base-building before another potential leg up.
🧩 Technical Outlook
Strong rally → deep correction → accumulation structure forming.
Support Levels: $13.64 (core zone), $10.01 (strong confluence), and $7.98 (long-term floor).
Resistance Zones: $19.25 → $22.07 → $26.19.
Channel projection shows potential for re-test of $26.19 by November if current momentum continues.
Higher timeframe targets extend to $30.09 and $34.39 in Q1 2026 if the bullish structure holds.
The setup favors accumulation entries below $16.08, with a short-term target to retest $22.07 and potentially $26.19 once momentum returns.
📰 Recent News & Fundamentals
Critical Metals shares have been volatile following major financing announcements:
📉 Announced offering of 18.03 million shares triggered a short-term selloff.
💰 Confirmed $50 million PIPE financing, strengthening capital for expansion.
🌍 Broader rare-earth momentum continues as China tightens export restrictions and JPMorgan initiates new investments into critical mineral supply chains.
Despite the correction, the sector tailwinds remain strong — and NASDAQ:CRML ’s European lithium and rare-earth projects (Tanbreez and Wolfsberg) position it strategically for the energy transition theme dominating the next decade.
📊 Sentiment Snapshot (from Schwab QORE Analytics)
Rating: F (Strongly Underperform) – percentile rank 100
26-week price change: +834%
Beta: 1.14
Sector: Materials / Diversified Metals & Mining
High volatility + weak sentiment ratings often precede large technical reversals — a setup that speculative traders should be watching closely.
💡 My Plan
I’m watching for clean accumulation below $16.08 for a potential re-entry swing trade.
Stop: under $13.50
Targets: $22.07 → $26.19 (swing)
Longer-term projections: $30 → $34 if the bullish trend resumes into 2026.
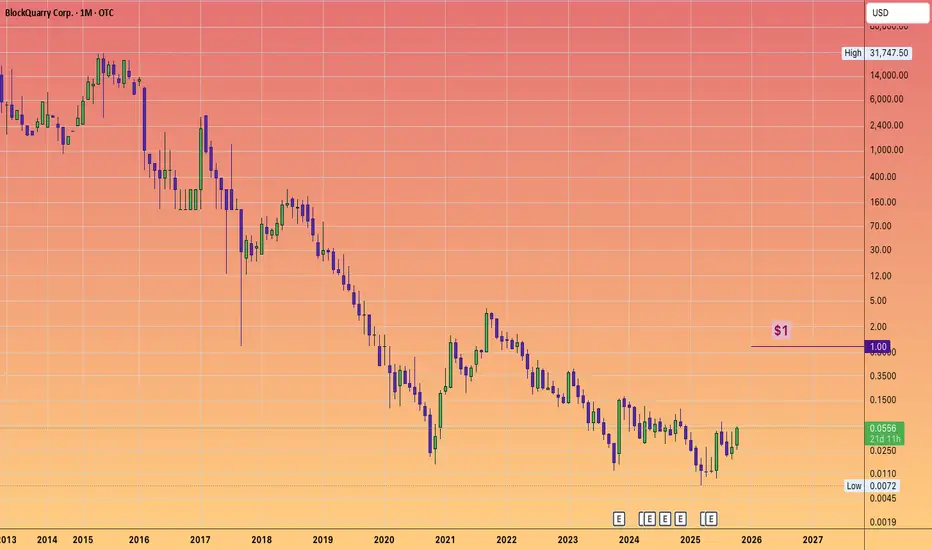
$BLQC Pink sheet stock can 20X --- BLOCKQUARRY CORP.What is it?
BLockQuarry has transitioned from pure #Crypto mining to advanced #AI data storage and HPC, tapping into high growth industries projected to reach $190 Billion for AI and $110B for HPC in the next several years.
The firm is leveraging state of the art data centers and infrastructure upgrades, focusing on scalable solutions for industries like Healthcare, finance and retail.
Financial Analyst forecasts:
Analysts have an average price target of $1.06 to $1.72 by late 2025!
Improved operational stability and freeing resources for expansion and debt reduction. A strengthened leadership team and new CEO with expertise in digital assets and operational growth in AI and HPC.
It's proprietary product BLQCBuster a US manufactured ASIC Bitcoin, features a modular chip architecture that enables superior mining capability per node. Which is meant to advance both performance and supply chain independence.