CIFR has reached key resistance zonePrice has reached the key resistance zone outlined in the October updates and is showing signs of at least mid-term topping action.
As long as price remains below 24, I’m watching for continuation to the downside into the 14–10 support zone.
Chart:
Previously:
• On resistance zone (Oct 13):
Chart:
www.tradingview.com
• On bullish structure and support (Sep 28):
Chart:
www.tradingview.com
Miningstocks

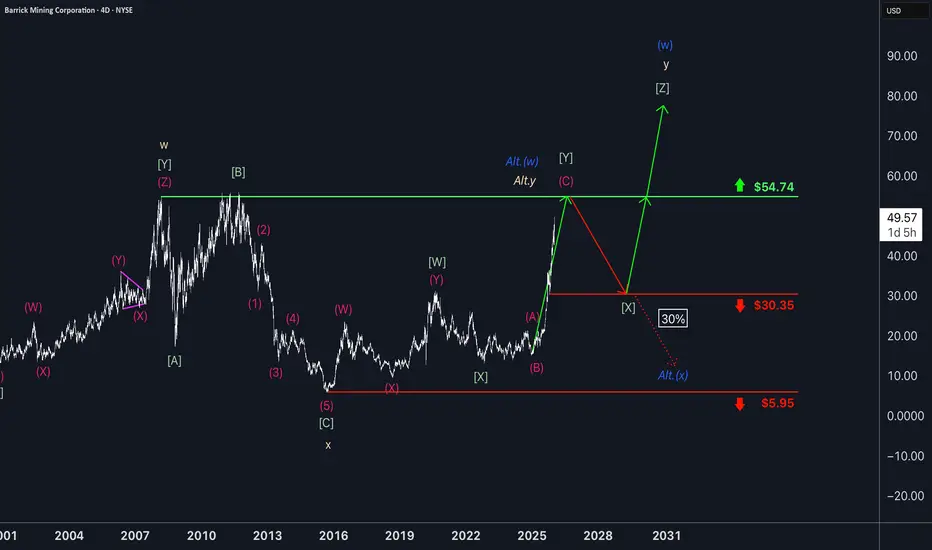
Barrick Gold slowly advancingWithin the ongoing three-wave pattern, the magenta wave (C) is expected to give the miner another boost, ultimately completing the green wave just below the resistance at $54.74. The following wave should then pull the stock back toward support at $30.35, from which wave is likely to start again. This move should once again lift Barrick higher, with the blue wave (w) projected to finish well above the $54.74 level. There is, however, a 30% chance that wave Alt.(w) could wrap up imminently. In that scenario, wave Alt.(x) would push price directly below $30.35, but would still bottom out before reaching the support at $5.95.
District Metals - Bullish outlook for the Uranium StockDistrict Metals (DMX): A Sweden-Focused Metals Story With a Regulatory Catalyst
District Metals is a Canada-listed exploration and development company with a strong focus on Sweden. The company is positioned around two key themes: polymetallic base and precious metals in historically productive mining districts, and long-dated optionality tied to energy and critical metals.
One of the company’s core assets is the Tomtebo project in the Bergslagen mining district. Bergslagen is one of Europe’s most established mining regions, with centuries of documented production across copper, zinc, lead, silver and gold. Tomtebo hosts multiple historical mines and polymetallic showings distributed along a large structural trend. The investment case here is straightforward: modern exploration techniques applied to an old mining district that was never explored with today’s geophysics, structural modeling, or systematic drilling. Value creation is driven by data — drilling results, geological continuity and scale — not narratives.
The second leg of the story, and the one attracting increasing attention, is Viken. This project hosts uranium alongside other metals such as vanadium, molybdenum, nickel, copper and zinc. For years, the economic potential of Viken has been structurally capped by Swedish legislation, as uranium extraction was effectively prohibited. That regulatory ceiling mattered — regardless of geology, uranium could not be part of any mine plan.
That is now changing.
Sweden has formally decided to reverse its long-standing uranium ban. The Swedish parliament has approved amendments to the Minerals Act and the Environmental Code that allow uranium to be classified as a concession mineral, meaning it can legally be explored for and extracted under the standard permitting framework. These changes are scheduled to come into force on 1 January 2026.
This is a material shift. It removes a hard legal stop that has existed for decades. For projects like Viken, uranium can once again be considered as part of the economic equation rather than being ignored entirely. That said, this is not a shortcut to production. Permitting, environmental assessments, technical studies, social acceptance and economics still apply. The law change does not eliminate risk — it eliminates prohibition.
From a market perspective, District Metals sits at the intersection of three forces: drill-driven exploration upside at Tomtebo, regulatory re-rating potential tied to uranium in Sweden, and a broader European push for domestic supply of critical raw materials. This is inherently high-risk territory, but that is where optionality and asymmetric outcomes live.
Execution, not sentiment, will decide the outcome.
Disclaimer: This post is not financial advice and should not be considered a recommendation to buy or sell any security. Always do your own research before making investment decisions.

Explosive set upLooking like coin flip time here on the daily chart of DNL. Looking for an entry point on lower time frames for a short play here. More to come and as always not financial advise, so its not.

A massive move for Outcrop may be imminent!This is Outcrop Silver vs spot silver.
As you can see, the breakout has not even come close to starting. This base has been building for more than six years.
The positive divergence on the quarterly RSI charts tell me that IF this breaks out, it will be an EPIC move.
Fundamental Update - Eric Sprott has been buying a lot of shares AND this just graduated from TSX.V to TSX a few weeks ago.

Will Defiance join the party?Defiance Silver is one of the few development companies that has not taken advantage of this massive move in silver.
So, either there are underlying issues hurting this stock price... OR... this thing is getting ready for a massive pop to the upside.

Arizona Metals showing positive divergence. This stock has been VERY stretched to the downside and is deeply oversold on the quarterly, monthly and weekly.
As per this chart, positive divergence on the weekly is developing.
If it can break back into the upper orange channel, that would be a great step for this to begin to rebound.
However, those weekly gaps below are concerning. If it breaks below 50 cents, those are definitely in play. Keep an eye on that!!!

BHP holds steady as copper cracksCopper has been on a rollercoaster in 2025. It broke above US$5/lb in May, driven by strong demand signals from China and clean energy projects. Then came the reversal. US tariffs on Chinese copper goods triggered a sharp selloff. Futures dropped more than 20% in days.
Traders reacted to headlines. But the long-term story remains intact.
BHP, one of the world’s largest copper miners, just delivered record output—over 2 million tonnes in FY25, up 8% year-on-year. Its Escondida and Spence mines are performing strongly. Copper is becoming a key pillar of BHP’s future production and revenue.
The stock is currently trading on the ASX near its 200-day moving average, around AU$39. This is a technical and psychological level that often acts as support in long-term trends. It’s a point where value investors typically step in.
The investment case for copper hasn’t changed. Electrification, energy transition, and AI-driven infrastructure will need vast amounts of copper. Supply remains constrained. New projects are few, and development timelines are long.
Short-term shocks create long-term opportunities. The tariff-driven selloff may shake out weak hands, but it doesn’t weaken the structural demand for copper.
BHP offers a cleaner way to invest in the copper story. It has scale, operational discipline, and a strong dividend yield. Investors get exposure to copper without the risks that come with smaller miners or speculative plays.
We believe this pullback is an entry point. BHP near its long-term average, with strong fundamentals, looks attractive for medium to long-term investors.
Copper may stay volatile. But the direction is clear. BHP is well-placed to ride the next leg higher.
The forecasts provided herein are intended for informational purposes only and should not be construed as guarantees of future performance. This is an example only to enhance a consumer's understanding of the strategy being described above and is not to be taken as Blueberry Markets providing personal advice.

Silver Dollar could fly!This is an ideal chart that could send this stock flying.
A perfect double bottom, with a squeezing pattern.
Sustaining above 50 cents will give this a chance to run much higher... perhaps closer to all-time highs.
The purple arc is in play FOR NOW. However, I'd prefer to see more bounces off that side to be comfortable.
Oh... and Sprott is a major owner of this stock.
Just keep an eye on Fibs for areas you may want to sell.

A long runway ahead for Outcrop (so far!) This chart shows a clear path to much higher levels.
However, a lot depends on this purple arc, which has been acting as support since 2019.
If it can stay inside this arc, that path is pretty clear. And, if it can sustain above 50 cents, it should see much higher prices over the next few months -- breaking out of an area with MAJOR resistance.
Of course, if Silver were to crash alongside a market crash, then all bets are off.

The kettle is boiling for Outcrop A move above this thick red cloud will be wonderful for holders of this stock. Above that, the (RED) 10 year moving average would be the target.
If this drives higher, expect the thick black lines to be major resistance and good times to take profits.

14 Year HVF that still offers 7X upside. SILVER Miner. $EXKEndeavour Silver is a mid tier producer with 4 mines in Mexico and Peru.
Focusing on exploration projects across the Americas.
EXK aims to become a leading senior silver producer.
It's Terronera reached commercial production last month and is forecast to process 350k tonnes over the next 6 months with avg grades of 120g/t Silver and 2.5g/T of Gold
EXK has a extensive pipeline of exploration projects.
The company expects free cash flow in Q4 2025 and Q1 2026
Management targets 30M ounces by 2030
EXK is in growth phase by higher production and new mine outputs but has faced earnings pressure due to derivative losses and rising costs. It has a solid asset base, and future earnings outlook anticipate improved cash flows.

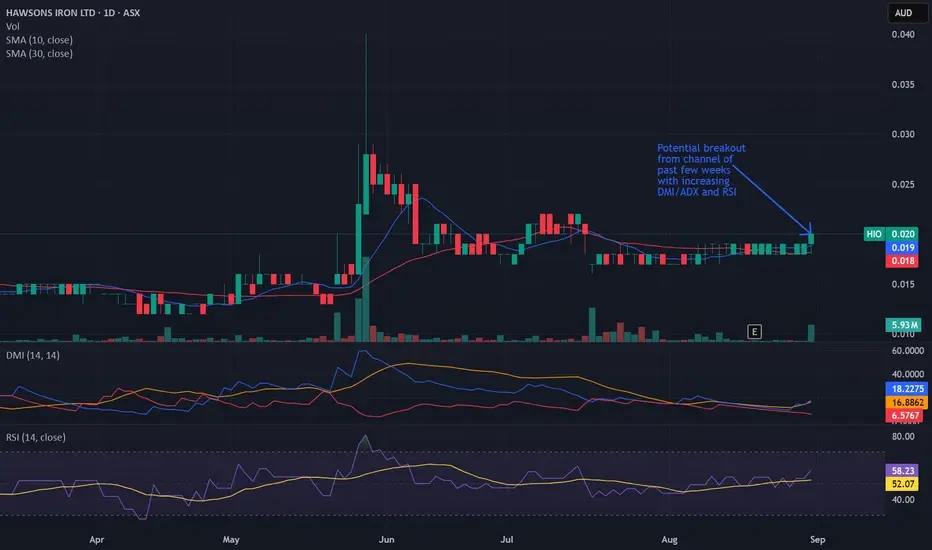
Bullish potential detected for HIOEntry conditions:
(i) higher share price for ASX:HIO along with swing up of indicators such as DMI/RSI (break out of recent channel).
Depending on risk tolerance, the stop loss for the trade would be:
(i) below previous support of $0.017 from the open of 7th August, or
(ii) below previous swing low of $0.016 from the open of 17th July.
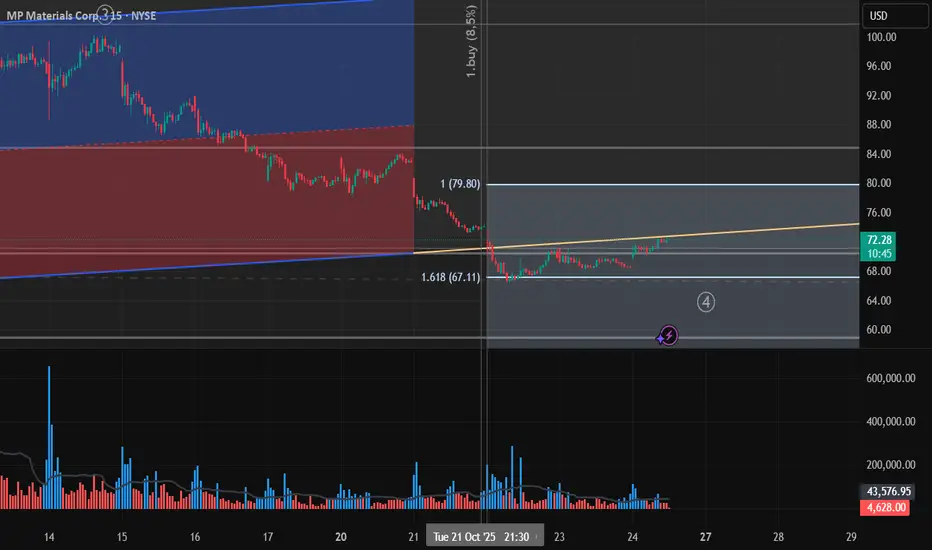
MP LONG RETAIL FLUSHOUT CONFIRMATIONCheck out my last chart. Value Zone around 68$ has been tested. Expect hightend volatility in the next 2-3 weeks - pre earnings!
+BIAS: bullish (macro context, investment talks US-AUS, and NpdR prices have doubled since MAi25)
Love to hear you're thoughts
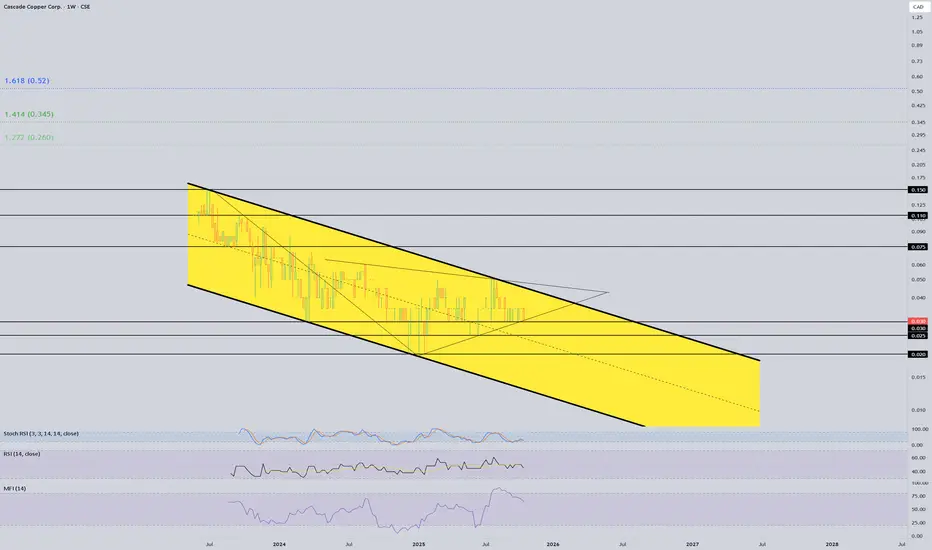
This parallel channel could resolve soonA beautiful parallel channel is continuing here.
If it breaks out, would be wise to take some profits at .075 cents, .11 and .15.
If it gets above it's all time high, .27 and.35 is in the cards.
TRIPLE BOTTOM: COEUR MINING #CDEThe Triple Bottom Pattern is a bullish reversal chart formation defined by three separate troughs occurring at approximately the same price point, succeeding an extended downtrend.
This pattern indicates a possible shift from bearish to bullish sentiment, generally suggesting a robust support level from which the asset's price could increase.
How to Recognize the Triple Bottom Pattern on a Chart:
Prior Downtrend: Prior to the emergence of the triple bottom, there must be a clear downtrend in the asset’s price. This establishes the framework for the reversal pattern.
Three Troughs: Identify three separate price troughs or lows. These troughs should be approximately at the same price level, with slight variations.
Volume Consideration: Typically, volume decreases during the formation of the troughs and rises during the price increase between them. A notable increase in volume during the breakout (when the price surpasses resistance) enhances the pattern’s credibility.
Separation Between Troughs: Each trough ought to be spaced apart by a duration of time with a moderate price increase in between. This price increase often halts at a similar resistance level, creating the apex of the pattern.
Breakout: The validation of the pattern occurs with a breakout above the resistance level established at the peaks between the troughs. The breakout indicates a potential reversal of the preceding downtrend.
Powerful Reversal Indicator: The Triple Bottom Pattern is highly regarded by traders as it signifies a robust shift in market sentiment. Following a prolonged downtrend, the formation of three successive troughs at approximately the same price point demonstrates a significant support level.
This support area is where buyers regularly step into the market or where the selling pressure begins to diminish. The mere occurrence of the price testing this level three times without breaking through indicates a decline in bearish momentum.
Duration: The pattern may develop over a span of several weeks to several months. Extended formations typically yield more substantial reversals.
Predictive Power: Once the Triple Bottom is validated—usually through a breakout above the resistance level—it can give traders a target price, presenting a quantifiable method for potential profit. By calculating the distance from the resistance level (established at the peaks between troughs) to the bottom of the pattern, and subsequently projecting that same distance upwards after the breakout, traders can establish price targets and modify their trading strategy as needed.

B Barrick Mining- Closed off 25% of the position on Barrick, looking to take advantage of this rally in
the metals and mining sector. If the price of gold/silver sells off, then considering adding back to the position around $22. Will need COT reports to show taking profits and adding to short positions. Till then, I remain bullish on this market long-term.

Discovery Silver is now in Blue Sky Territory
The stock has broken into new all-time highs with no resistance ahead.
Momentum is strong, and the upside potential is wide open. very bullish
not financial advice

Lucara long Lucara is almost below the TSX lows made in 2008. If you bought equity in the company anywhere in the last 10 years you are losing money. The company is in debt to finance the construction of new mining facilities and has been taking their sweet time.
However, the owners are Lundin and they know how to play the game with equity, marginal pricing, debt, balance sheet shenanigans, and leverage. I would not at all be surprised if the debt in the company's balance sheet is mostly owned by the family and they are just taking out their pay in the form of debt repayments instead of in the form of dividends.
Diamonds are famous for being used in drilling, I'm not sure if Lucara sells diamonds for drilling, but Trump's policy is drill baby drill. Even if Lucara does not sell diamonds for drilling they should benefit from the news cycle and public perception.
This is a very speculative play and it depends of a series of factors, but I reckon there is a good chance it goes to 0.88 USD/share, 1.10, even 1.45.

Barrick Gold Corp (B) – Riding the Gold SupercycleCompany Snapshot:
Barrick $B is a global gold and copper mining powerhouse, poised to thrive amid soaring gold prices and escalating macroeconomic uncertainty.
Key Catalysts:
Gold Bull Run Tailwind 📊
Spot gold is surging, with projections aiming for $2,700/oz. As a low-cost, large-scale producer, Barrick stands to gain significantly from margin expansion and free cash flow acceleration.
Global Diversification 🌍
Operations across North America, Africa, and Asia offer geographic balance—mitigating regional risk while ensuring strong production continuity.
Insider Confidence + Lean Costs 🔒
CEO Mark Bristow and other execs are actively buying shares, signaling deep conviction.
With industry-low all-in sustaining costs (AISC), Barrick boasts high operational leverage to gold’s upside, especially in an inflationary environment.
Investment Outlook:
Bullish Entry Zone: Above $18.00–$19.00
Upside Target: $28.00–$29.00, fueled by macro gold strength, disciplined execution, and insider alignment.
⛏️ Barrick is a prime gold cycle play, combining operational excellence with strategic global scale.
#BarrickGold #GoldStocks #GoldPrice #Commodities #InflationHedge #MiningStocks #InsiderBuying #AISC #PreciousMetals #MacroTailwinds #B

Silver X Mining: Grinding it outThis stock is still resting, and I think waiting for Silver to make it's move to $50 first. Until then, this will continue to grind sideways to lower. There's a lot to clear first.

Atleast 3x your moneyAlright, this is getting set to fly high now. Catching with gold and other commodities. All the best !!

Wheaton precious Metals can push on to $90It could be a HOT summer for the gold and silver bugs
And the speculators in the mining sector!
WPM ( formerly Silver Wheaton #SLW)
Has a broken out of a inverse head and shoulders
Two targets provided
Also important to note this inv head and shoulders is a continuation pattern not a bottom pattern.
