SA Seabridge Gold: 93.3% Score - And Why I'm Watching CloselyIs this the World's Largest Undeveloped Gold Project?
Gold has been on a tear in 2025, and for good reason. Rate cuts on the horizon, central banks accumulating, geopolitical uncertainty everywhere. In this environment, I have been scanning for gold equities that combine technical strength with real assets. Seabridge Gold NYSE:SA emerged with a 93.3% score on my system, one of the highest I have seen in the precious metals sector this year. Here is what I found when I looked under the hood.
So Why This Stock Caught My Attention
I evaluate over 15 technical conditions with intelligent weighting, and NYSE:SA passed nearly every checkmark. The setup shows Perfect Order moving average alignment, with price trading comfortably above all key averages. The 3-month gain stands at 67.33%, more than double my 30% threshold, while relative strength versus SPY registers at 62.36%. Against its own sector, SA leads by 64.22%.
The price structure confirms a healthy uptrend with 5 higher highs and 5 higher lows over the last 10 days, weekly timeframe aligned, and the stock sitting just 5.85% below all-time highs. Momentum indicators across the board confirm bullish conditions. Most importantly, the risk warning section shows all clear: no distribution detected, no warning signals, no chasing situation.
The only weakness is the Tightening score at 39 out of 100, suggesting the consolidation needs a few more days to compress before the ideal breakout emerges.
The Company Behind the Score
Seabridge Gold is not your typical gold miner. They do not operate mines. Instead, they acquire, explore, and advance world-class deposits, then partner with major mining companies to develop them. This asset-light model means lower operational risk and massive leverage to rising metal prices.
Their flagship is the KSM project in British Columbia's Golden Triangle, and the numbers are staggering: 47.3 million ounces of gold and 7.3 billion pounds of copper in reserves. This makes KSM the world's largest undeveloped gold project and the third-largest undeveloped copper resource. The 2022 Pre-Feasibility Study outlines a 33-year mine life with all-in sustaining costs of just $601 per ounce, compared to the industry average of roughly $1,500. That cost advantage comes from copper byproduct credits and access to BC Hydro's clean, cheap hydroelectric power, giving KSM one of the lowest carbon footprints of any large-scale mining project globally and I like Green companies a lot.
What separates Seabridge from other developers is execution. They spent over $1 billion and 20 years advancing KSM through exploration, economic studies, and permitting. In July 2024, they secured "Substantially Started" status from the BC government, locking in environmental permits for the life of the project. Most competitors are still fighting permitting battles. Seabridge already won that war.
Beyond KSM, the portfolio includes Courageous Lake in the Northwest Territories with 11 million ounces of indicated gold, and the Iskut project just 20 kilometers from KSM, which management believes could become "another KSM" based on recent drilling results at Snip North. A maiden copper-gold resource at Iskut is expected by early 2026.
The Catalyst That Could Change Everything
CEO Rudi Fronk announced on November 12 that Seabridge is now in direct negotiations with a preferred JV partner after three finalists completed site visits. A deal could come before year-end. This is the moment the company has been building toward for 25 years.
The JV structure makes sense for everyone. Seabridge lacks the $5-6 billion needed to build KSM alone, but they hold 100% of a permitted, de-risked, world-class asset. Major miners have the balance sheets but struggle to find quality projects at this scale. The expected deal structure involves a phased earn-in, allowing Seabridge shareholders to retain meaningful exposure while a larger partner funds development.
B. Riley Securities raised their price target from $50 to $65 on December 2, citing rising gold and copper prices and the imminent JV catalyst. Stonegate Capital values the company between CA$42 and CA$67 per share. Current price: around $29.
My Take
SA checks nearly every box on my system. Perfect Order alignment, exceptional relative strength, clean risk profile, proximity to highs, and a fundamental story that could drive significant re-rating. The macro environment supports gold, the company sits on irreplaceable assets, and a transformational catalyst is weeks away.
I am watching for a decisive break above $29.31 with volume confirmation. If the consolidation tightens further and gold holds its strength, this setup could deliver. The 10 EMA will serve as my trailing stop reference.
Bottom Line
SA has the technical setup, the fundamental story, and the timing. I hope it follows the path of NASDAQ:GLUE which has gained nearly 50% since I first highlighted it.
Disclaimer
This analysis reflects my personal research and trading approach. It is not financial advice. I may hold or initiate a position in SA. Always do your own research before making any investment decisions
Momentumstrategy

HindCopper Showing Strong Momentum; Breakout Setup DevelopingDaily Timeframe Analysis – HindCopper
HindCopper is forming a broadening wedge pattern on the daily timeframe, with a key support zone around ₹300. The stock has completed its five-wave structure and is currently showing strong upward momentum.
If this momentum sustains and the price breaks above the ₹375–₹380 resistance zone, the stock could move toward the pattern target near ₹450.
Additionally, as long as the momentum support around ₹340 holds, the probability of higher levels remains strong.
Thank you.

Granules: Important Key Levels on RadarThis is the daily timeframe chart of Granules.
The stock is currently sustaining above the LOP support zone at ₹530–540.
As long as the price holds above this level, the bullish momentum is expected to continue.
However, if the stock breaks below this support, a decline toward the lower boundary of the channel may follow.
Thank you.

JUBLFOOD: Diamond Pattern Forming on Key SupportThis is the daily timeframe chart of Jubilant FoodWorks (JUBLFOOD).
The stock is trading within a well-defined parallel channel, with a key support zone around ₹590–₹570.
The price structure is also forming a Diamond Pattern:
Support Zone: ₹580–₹590
Pattern Resistance: ₹615
A breakout above ₹615 may trigger fresh momentum, with the first target near ₹645 and a pattern target around ₹670.
Thank you.

SONACOMS: Bullish Momentum ActivatedThis is the daily timeframe chart of SONACOMS.
The stock is trading within a well-defined upward channel, with the lower-boundary (LOP) support positioned near the 470–480 range. It is currently sustaining above this support zone.
If the stock continues to hold this level and the ongoing bullish momentum remains intact, SONACOMS may potentially move toward the channel resistance near the 600 level.
Thank you.

$SPX The trend remain up, but it's crucial to stay alert!SPX: Analyzing the weekly chart, at first glance, it seems that everything is under control. However, since the formation of the doji three weeks ago, the SPX has lost upward momentum, despite Friday's attempt with a positive opening that failed to consolidate by the close of trading.
It's clear that the 10-week simple moving average is on the market's radar and is currently holding. We can also draw a blue oblique support line; however, last week's doji is signalling uncertainty in the market, in addition to having closed below the horizontal support level at 6754.
Meanwhile, the MACD is about to issue a sell signal. For now, the SPX remains fine, but it needs to hold firm; otherwise, it might need to test the strength of the next support level, located at 6550, where the 20-week simple moving average will also be found next week.
The stakes are high!

FINAL TRADE OF THE WEEK: CADJPY Follow-Through ExecutionSetup Analysis:
CADJPY formed a Momentum Low yesterday, followed by a sustained pullback/sideways pattern that established our structural point. This consolidation created the perfect setup for a continuation entry.
Trade Execution:
Entry triggered this afternoon after the break of the internal wave structure, confirming Sellers conviction and follow-through.
Trade Management:
Strong momentum immediately after entry
Target 2 (T2) achieved in under 2 hours
Profit: +50 pips
Exit Decision:
Position closed at T2 after price displayed strong reversal signals. This is mechanical trading—take profits when price action shows the move is exhausted.
Key Lesson:
The best trades are the ones where:
✅ Structure is clear
✅ Entry confirms momentum
✅ Price moves decisively in your favour
✅ You exit with discipline when reversal patterns emerge
This is the WavesOfSuccess methodology in action—patience for setup, precision on entry, discipline on exit.
Result: +50 pips in under 2 hours ✅
Have a blessed weekend! 🙏
👍 Hit the boost button if you found this valuable
👤 Follow for more educational trading content

Sub-sector Relative Performance - study.Studying the RP of sub-sectors after the "tariff crash" to see if it had any predictive power.
NASDAQ:SOXX : 80% to the top. 112% return.

The BTC Long! Bullish Divergence SetupBTC Perpetual Contract - Bullish Divergence Setup at Critical Trendline Support
Bitcoin is presenting a high-conviction long opportunity as price tests a significant ascending trendline that originated in August 2024. This setup combines multiple technical confluences that suggest a potential reversal zone.
Technical Structure:
Price has been respecting a well-defined ascending trendline established from the August 2024 lows, which has acted as dynamic support through multiple retests. We're currently at another critical touch of this trendline around the $94,000-$95,000 zone, coinciding with a horizontal support level that has proven significant on previous timeframes.
Smart Divergence Engine Confirmation:
The overlay panel is displaying clear bullish divergence signals (green "BUY" labels) at key support levels. Notice how price made lower lows while the Smart Divergence Engine indicator (bottom panel) formed higher lows - this is textbook bullish divergence indicating weakening bearish momentum. The divergence pattern has accurately identified previous reversal points, as evidenced by the successful signals earlier in the chart that led to substantial rallies.
Smart Moving Average Dynamics (SMAD) Analysis:
The SMAD indicator is showing extreme bearish readings (deep red territory around -100.0), which historically marks oversold conditions and potential capitulation zones. When SMAD reaches these extremes near critical support structures, it often precedes strong mean-reversion moves. The indicator's position suggests we're at a momentum extreme that typically doesn't persist.
Trade Rationale:
This setup offers an asymmetric risk-reward opportunity. The confluence of the long-term trendline support, bullish divergence confirmation, and extreme SMAD readings creates a high-probability reversal scenario. Historical price action shows that this trendline has been respected consistently since August 2024, and each successful defense has led to significant upside continuation.
Risk Management:
A sustained break below the trendline and horizontal support would invalidate this setup. However, the current technical evidence suggests buyers are likely to defend this zone aggressively, given its significance in the broader uptrend structure.
The multiple timeframe alignment and indicator confirmation provide conviction for a long position targeting a return to recent highs around $108,000-$110,000, with extended targets at the $120,000-$130,000 zone if momentum accelerates.

Accumulating Insurance ETF, wonder if bottom for $UNH.With wobbly markets, Insurance ETF have shown strength. In a monthly macd view, it's supported above the zero.
Positionally, bulls have been exhausted, not perfect momentum MAs, people lacking positions is the driving FOMO force.
NYSE:UNH

GLUE jumped 191% with 93% score on the indicator almost perfectHi guys,
A stock that jumped in the daily scan of the indicator and could be very interesting right now.
It received a score of 93 percent and therefore caught the eye like fire. My indicator is simply enthusiastic about it - it sees an almost perfect setup for momentum there.
It has a near-perfect stop and the third quarter 2025 reports were released this morning before the open. These reports can move the stock in either direction, so I recommend waiting to see the market's reaction and then perhaps considering an entry. I personally will not enter until I see that the market has digested the reports.
About the company:
Monte Rosa Therapeutics is a relatively small company from Boston that was founded only in 2019, but it is doing something really special. They have developed an innovative technology called Molecular Glue Degraders (MGD for short). It's basically a type of small drug that uses the body's natural mechanisms to break down proteins that cause disease instead of just blocking them.
Their secret engine is called QuEEN and uses artificial intelligence to identify proteins that can be broken down and design precision drugs. It's a technology that's considered revolutionary in the industry because it can treat diseases that no other drug has been able to treat.
The company is currently developing three main drugs in parallel. MRT-2359 to treat cancers driven by the MYC protein (including hard-to-treat prostate cancer), MRT-6160 for autoimmune and inflammatory diseases like lupus, and MRT-8102 for inflammatory diseases related to the NLRP3 mechanism. The first drug is already in advanced clinical stages with promising results, and the other two are in the early stages of human testing.
Institutional investors and large banks believe in this company. They have 10 analyst coverage and the majority of the average is BUY with an average target price of $13.50, which is another increase of almost 110 percent from the current price.
Massive Collaborations:
This is the interesting part. Last September, they announced a second collaboration with Novartis, one of the largest pharmaceutical companies in the world. In this agreement, Novartis paid them $120 million immediately in cash, and there is another potential of $5.7 billion if they meet all the milestones.
This is in addition to the first agreement they already had with Novartis in October 2024 for the drug MRT-6160, where they received $150 million upfront and up to an additional $2.1 billion in milestones. In total, there is a potential of almost $8 billion from the two agreements with Novartis alone.
They also have a collaboration with Roche to research and develop additional drugs in the field of cancer and neurological diseases. This shows that their technology is of interest to the big players in the industry.
Latest news:
Last week, the company presented strong preclinical data on MRT-6160 at the ACR Convergence 2025 conference, showing that the drug degrades more than 90 percent of the VAV1 protein and significantly inhibits the function of T and B cells. This is important because VAV1 is involved in many autoimmune diseases.
A few weeks ago, they announced that they would be attending four investor conferences in November-December 2025, including at Guggenheim Healthcare in Boston, TD Cowen Immunology Summit, Jefferies Global Healthcare in London, and Piper Sandler in New York. This means that they want to promote their story to big investors.
In March 2025, they presented exciting results from the clinical study of MRT-2359 in patients with castration-resistant prostate cancer (CRPC). Of the three patients treated, one achieved a confirmed partial response (PR) and two achieved stable disease (SD). Interestingly, all three patients had mutations that link resistance to standard treatments. In one of them, PSA levels dropped by 90 percent and the tumor shrank by 57 percent. As a result, they plan to expand the study to 20-30 more patients.
In July 2025, they began dosing the first people in a phase 1 study of MRT-8102 (the anti-inflammatory drug) with results expected in the first half of 2026.
In their second-quarter 2025 financial statements released in August, they reported revenue from collaborations of $23.2 million, a huge jump from $4.7 million in the same quarter last year. Their net loss fell from $30.3 million to $12.3 million. They have $295.5 million in cash that should fund operations through 2028.
In the fourth quarter of 2024 (reported in March 2025) they reported a colossal $60.6 million in revenue from collaborations and $38.9 million in R&D expenses.
Technical View:
Technically, the stock was at an ATH of around $44 in September 2021 and then crashed to $3.50 in August 2025. Since then, it has been on a strong rise and has already climbed to $13.22, a 191% increase in three months.
It is now at $12.31 in a three-day consolidation in the range of 11.50-13.22. The price is above the EMA10 at 11.9 and above the SMA200 at 5.88. There is a Perfect Order of all moving averages here and they are rising at a slope of 24.34 percent - this is a Strong Uptrend.
The average volume is 1.13 million shares per day and the ADR (average daily volatility) is 7.61 percent. The RSI is at 68.3 which is still normal and not overbought. The performance ratio compared to the S&P 500 is 181.93 percent - the stock is simply driving the market crazy.
In the last 10 days there have been 6 Higher Highs and 6 Higher Lows, this is a classic and clean uptrend.
There are currently no distribution signs or warnings on the chart. This is a Setup looking Ready for a breakout.
Weekly Trend:
Here I have one comment - in the weekly view the trend is still Neutral. This means that although the stock has made a strong increase in recent months, it has not yet clearly broken above significant resistance levels on the week. This should be taken into account.
*Sentiment and Social Networks:
I searched StockTweets and Reddit and saw that there are discussions, but they are not super active. This is not a stock that is talked about a lot on the networks or social media.
The main investors here are institutional rather than retail traders. The sentiment on StockTweets seems neutral to slightly positive but there is not a lot of activity there.
The analysts and experts are actually very positive. There are 9 companies with an Outperform or Buy recommendation, an average of 1.8 (scale of 1 to 5).
The risks:
This is still a clinical-stage biotech company without sales of real drugs. All the drugs are still in development and they have to go through the regulatory processes. If one of the clinical trials fails, the stock could collapse. Their cash is only supposed to last until 2028 and if they don't get more money from Novartis or other investors, they will have to raise capital.
The biotech sector is one of the most volatile and risky sectors. Most companies at this stage fail. The stock's beta is 1.53, which means it is 50 percent more volatile than the market.
It should be noted that the M-Score (financial manipulation indicator) has a score of 23.4 which could indicate a warning, but this is common in biotech companies at this stage because there is a lot of fluctuation in revenue from collaborations.
In conclusion:
I'll wait for the report.
My method is always to wait for large volume in the pre-market, which is at least 1.5 times and preferably the average volume, and then use my ORB indicator to get additional confirmation in the first 5 minutes of the open; but since they have reports coming out and I still don't know if it'll be far enough to cause a commotion in the pre market I'll wait.
This is a stock that my indicator really likes technically - it has a Perfect Order, strong momentum, and a clean setup. Fundamentally it has innovative technology, collaborations with giant pharmaceutical companies, promising clinical data, and good cash for several years.
But this is biotech with all the risks that come with that. The reports came out this morning and the current price of $12.31 already embodies some of the expectations. I personally wouldn't enter now before seeing the market's reaction to the reports and maybe wait for a small pullback to the 11-11.50 area where there is support. If it breaks 13.48 on high volume then you could consider entering with a very short stop loss below 11.84.
Definitely a stock to watch, but with great caution.
Just before you jump in:
Listen, I'm not an investment advisor and I don't want to be one. What I've written here is simply my analysis with the indicator I developed, and it could be completely wrong.
Biotechnology is not a game - it's one of the riskiest sectors there is. Ninety percent of clinical-stage companies fail and the money goes down the drain. You could lose everything.
I **do** not own this stock now and **will** not enter before I see what happens with the reports that came out today . I don't know you, I don't know the state of your portfolio, and I don't know how much risk you can take.
Before you put money in - do your homework, talk to someone professional who knows you, and only then decide. And don't invest money that you need for your electric bill.
Good luck to all of us, and may the goddesses shower us with an abundance of money.

GBPJPY IDEA FOR OCT, 11TH 2025.The price is breaking new highs, which signals bullish momentum. If the price holds its current zone of resistance, that signals expectations of short-term selling power. Before it continues upwards, the price is still overall bullish.
As usual, my calls or analysis are based on what I see, the current Bias, and from a probability standpoint, meaning that this projection may be or may not be validated, so tread carefully. This is not financial advice; trade responsibly.

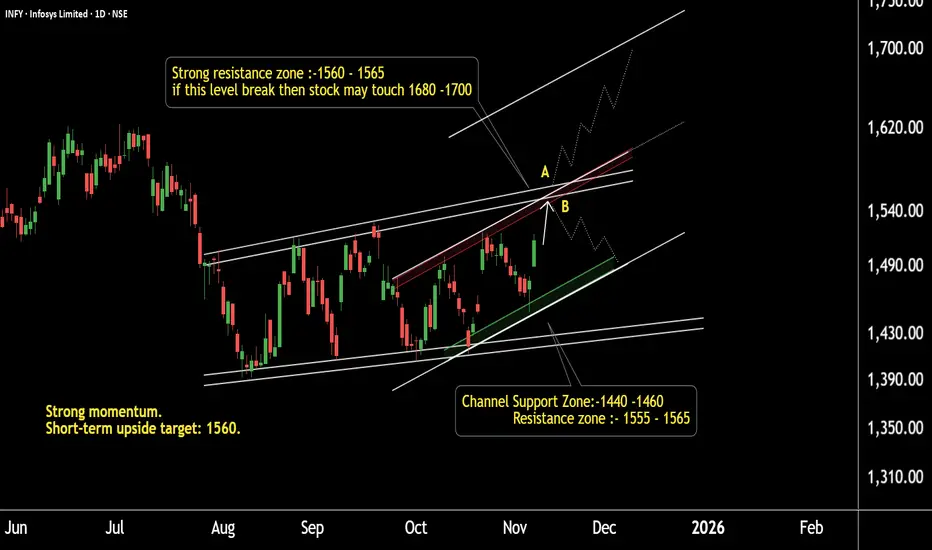
INFY Battle Zone: Levels That Decide the TrendThis is the daily timeframe chart of INFY.
The stock has a strong support zone near 1410 and 1440.
It is facing major resistance within the short-term and mid-term channel around 1555–1565.
Currently, INFY is trading near 1520, and the ongoing move may extend toward 1560.
If the stock fails to break this resistance, a short-term decline may occur.
However, if the resistance is decisively broken, INFY has the potential to rally toward 1680–1700 based on the channel trend.
Thank You !!
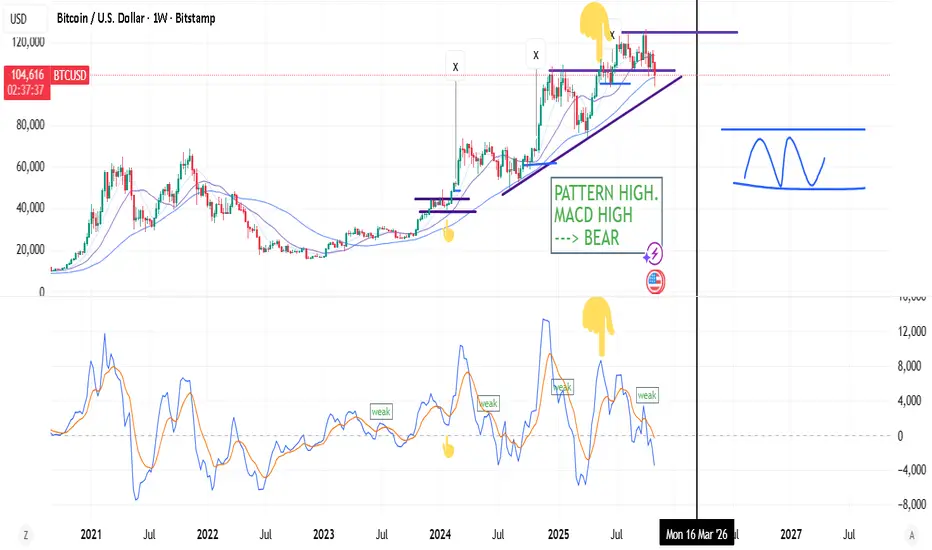
PATTERN logic + MACD LOWS/POTENCIAL = High probabilities.If you combine basic FACTORS of Patterns + MACD (weaknesses or Lows/Highs) you get pretty straightforward probability.
Weekly MACD above zero (and daily macd above zero) mean strong impulse, trend. But sometimes deep corrections in negative territory (bears) are not negative, because every chart pattern require strong "push" to break the pattern. I think you can see if there's smoke, in advance.
$XAUUSD Bearish Momentum Divergence. Quick trade oportunityIF and only IF:
The price breaks under this small tight channel.
The 3 SMA cross back under the 20 SMA.
The prices remains under the 150 SMA.
It would be a great opportunity to take a 2:1 quick trade on a 1H chart.
Why I say IF and only IF? Because the divergence itself isn't enough as a trigger, we need confluence, we need confirmations.
I'm setting up alerts in case the entry is confirmed.
Let's see

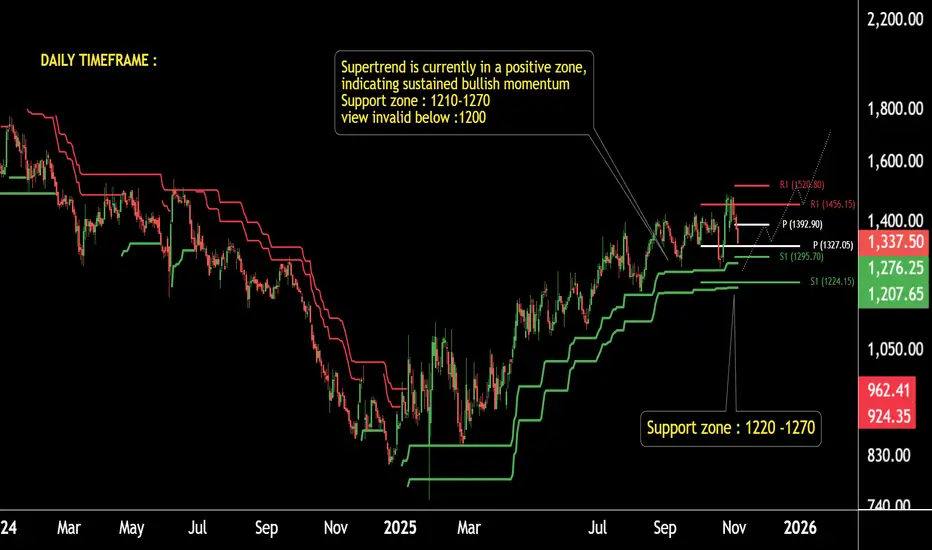
CREDITACC Heating Up… Key Levels Triggering the Next Bull Move!This is the daily timeframe chart of CREDITACC.
The stock is moving within a well-defined structure and consistently respecting the Supertrend support on every decline.
Each time it touches the Supertrend zone, the price forms a fresh higher high, maintaining a strong upward rhythm.
The current Supertrend support zones are placed near 1270 and 1220. The stock also holds a firm pivot support around 1224.
If this momentum continues and the stock keeps respecting these support levels, we may see higher prices in the coming sessions.
THANK YOU !!
Gap-Up Alert: Hind Rectifiers | Rectangle Breakout ConfirmedBUY Setup ⚡
Entry: ₹1,803-1,810 (Current Level)
Target 1: ₹1,832-1,840
Target 2: ₹1,851-1,860
Target 3: ₹1,875-1,890 (Extended)
Stop Loss: ₹1,775
Technical Rationale:
Massive breakout from rectangle consolidation (1,600-1,800 range)
Explosive +5.00% surge with exceptional volume (84.66K)
Breaking above long-term resistance at 1,800 with strong conviction
RSI spiking to 69.43 - strong bullish momentum
Gap-up opening showing institutional buying interest
Trading well above EMA (1,663.41) confirming uptrend
V-shaped recovery from October lows
Power electronics/rectifier sector gaining traction
Multiple resistance levels mapped: 1,832, 1,851, 1,875
Clear support established at 1,747-1,775 zone
Volume significantly above average confirming breakout
Risk-Reward: Good 1:2.5+ ratio
Pattern: Rectangle breakout + Gap-up - powerful combination for continuation
Strategy: Short to medium-term swing - Book 35% at T1 (1,835), 35% at T2 (1,855), trail remaining with SL at 1,810 after T1
Key Levels:
Breakout Zone: 1,800 (critical level crossed)
Strong Resistance: 1,832, 1,851, 1,875
Major Support: 1,775, 1,747, 1,720
Sector Catalyst:
Power sector demand increasing
Electronics manufacturing push
Infrastructure spending
Caution: Already up 5% today - consider waiting for minor pullback to 1,790-1,795 for better entry, or enter in tranches
Disclaimer: For educational purposes only. Not SEBI registered.

CSB Bank Gaining Strength – Momentum Trade Setup ActiveCSB Bank – Daily Timeframe Analysis
Stock has taken reversal from Supertrend support.
Currently trading above Pivot level.
Supertrend support lies near ₹400 zone.
Daily MACD has given a positive crossover and is moving in the positive zone.
If this support sustains, momentum is likely to continue upward.
Possible new highs can be seen in the coming sessions.

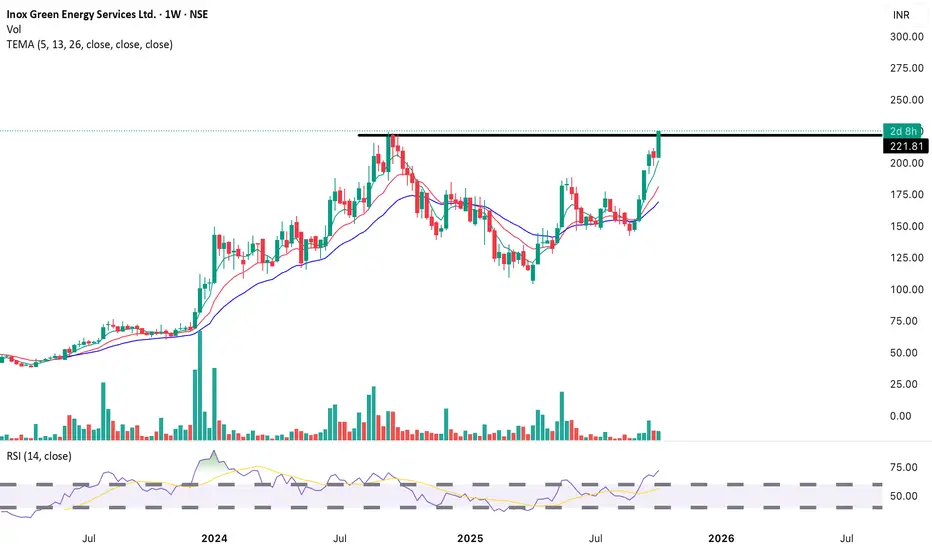
Long (Bullish) – Continuation expected if price sustains Resistance Turned Support: ₹221
Next Target Zone: ₹250–₹275
Stop-loss: Below ₹201 (recent swing low and major moving average)
HYPE / USDT Breaking Out — Potential Rally Towards $50 AheadHYPE is breaking out with strong potential from its trendline resistance. Momentum is building, and if price holds above the breakout zone, we can expect a short-term rally towards $45 - $50.
Always manage risk wisely and wait for confirmation before entering.

Bharti Airtel on Fire — Strong Momentum Ahead!Bharti Airtel – Momentum Trade Update
On the weekly timeframe, the stock is sustaining above its Law of Polarity (LOP) level, indicating underlying strength. It is likely to move toward the upper boundary of the channel, placed around the ₹2100–₹2120 zone.
On the daily timeframe, Bharti Airtel is trading within a well-defined parallel channel and has recently given a breakout above the middle boundary. The price action now suggests a potential move toward the upper boundary of the channel, positioned near ₹2100–₹2110.
If this momentum continues, we may see further upside in the coming sessions.
Thank you.

HealthCare Global Enterprises Ltd. BUY SetupEntry: ₹709-712 (Current Level)
Target 1: ₹723-725
Target 2: ₹737-740
Target 3: ₹755-760 (Extended)
Stop Loss: ₹690

Buy Kfin Technologies above 1,145 INR Buy Kfin Technologies above 1,145 INR.
Target: 1,180 / 1,220 INR.
Stoploss: 1,078 INR.
