BEN Stock Going UP, Confirmed Monday 6/30/25Hello,
Ayrfolio trade ideas are based on weekly charts and momentum, so remember to be patient! No day trades here unless the stock soars up intraday. Today we’re covering:
COMPANY: Franklin Resources, Inc.
STOCK SYMBOL: BEN
POSITION: Long
TP1 Risk-Reward Ratio: 2.26
TP2 Risk-Reward Ratio: 4.52
Stop Loss: must wait AFTER daily candle closes to exit trade (regular candle, NOT Heiken Ashi)
Ultimate Stop Loss: can exit IMMEDIATELY if price reaches this level during any trading hours
EXPLANATION: Weekly momentum increased and confirmed on Monday 6/30/25 at $24.88/share. Although the stop losses are listed on the chart, if momentum has been lost then we can exit before the price reaches the stop loss.
DISCLAIMER: Please do your own due diligence before making any decisions.
P.S. - Stocks can soar. YOU can soar. Soaring is possible!
-Ayrfolio
Momentumstrategy

PINC Stock Going UP, Confirmed Monday 8/11/25Hello,
Ayrfolio trade ideas are based on weekly charts and momentum, so remember to be patient! No day trades here unless the stock soars up intraday. Today we’re covering:
COMPANY: Premier, Inc.
STOCK SYMBOL: PINC
POSITION: Long
TP1 Risk-Reward Ratio: 1.78
TP2 Risk-Reward Ratio: 3.57
Stop Loss: must wait AFTER daily candle closes to exit trade (regular candle, NOT Heiken Ashi)
Ultimate Stop Loss: can exit IMMEDIATELY if price reaches this level during any trading hours
EXPLANATION: Weekly momentum increased and confirmed on Monday 8/11/25 at $24.95/share. Although the stop losses are listed on the chart, if momentum has been lost then we can exit before the price reaches the stop loss.
DISCLAIMER: Please do your own due diligence before making any decisions.
P.S. - Stocks can soar. YOU can soar. Soaring is possible!
-Ayrfolio

AZN Stock Going UP, Confirmed Monday 8/11/25Hello,
Ayrfolio trade ideas are based on weekly charts and momentum, so remember to be patient! No day trades here unless the stock soars up intraday. Today we’re covering:
COMPANY: Astrazeneca PLC
STOCK SYMBOL: AZN
POSITION: Long
TP1 Risk-Reward Ratio: 1.67
TP2 Risk-Reward Ratio: 2.0
Stop Loss: must wait AFTER daily candle closes to exit trade (regular candle, NOT Heiken Ashi)
Ultimate Stop Loss: can exit IMMEDIATELY if price reaches this level during any trading hours
EXPLANATION: Weekly momentum increased and confirmed on Monday 8/11/25 at $79.17/share. Although the stop losses are listed on the chart, if momentum has been lost then we can exit before the price reaches the stop loss.
DISCLAIMER: Please do your own due diligence before making any decisions.
P.S. - Stocks can soar. YOU can soar. Soaring is possible!
-Ayrfolio

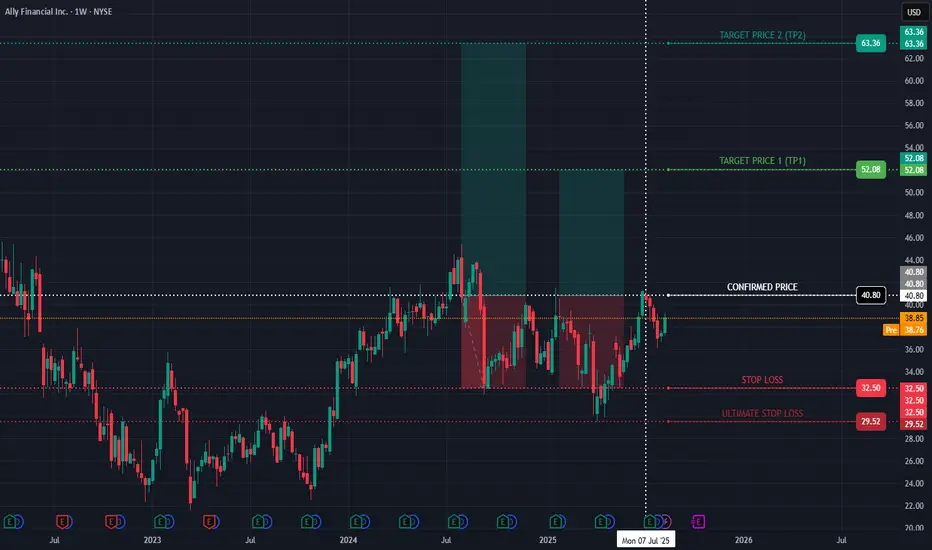
ALLY Stock Going UP, Confirmed Monday 7/7/25Hello,
Ayrfolio trade ideas are based on weekly charts and momentum, so remember to be patient! No day trades here unless the stock soars up intraday. Today we’re covering:
COMPANY: Ally Financial Inc.
STOCK SYMBOL: ALLY
POSITION: Long
TP1 Risk-Reward Ratio: 1.36
TP2 Risk-Reward Ratio: 2.72
Stop Loss: must wait AFTER daily candle closes to exit trade (regular candle, NOT Heiken Ashi)
Ultimate Stop Loss: can exit IMMEDIATELY if price reaches this level during any trading hours
EXPLANATION: Weekly momentum increased and confirmed on Monday 7/7/25 at $40.80/share. Although the stop losses are listed on the chart, if momentum has been lost then we can exit before the price reaches the stop loss.
DISCLAIMER: Please do your own due diligence before making any decisions.
P.S. - Stocks can soar. YOU can soar. Soaring is possible!
-Ayrfolio
HMC Stock Long Position Confirmed Monday 7/28/25Hello,
Ayrfolio trade ideas are based on weekly charts and momentum, so remember to be patient! No day trades here unless the stock soars up intraday. Today we’re covering:
COMPANY: Honda Motor Company, Ltd.
STOCK SYMBOL: HMC
POSITION: Long
TP1 Risk-Reward Ratio: 1.49
TP2 Risk-Reward Ratio: 2.99
Stop Loss: must wait AFTER daily candle closes to exit trade (regular candle, NOT Heiken Ashi)
Ultimate Stop Loss: can exit IMMEDIATELY if price reaches this level during any trading hours
EXPLANATION: Weekly momentum increased and confirmed on Monday 7/28/25 at $33.51/share. Although the stop losses are listed on the chart, if momentum has been lost then we can exit before the price reaches the stop loss.
DISCLAIMER: Please do your own due diligence before making any decisions.
P.S. - Stocks can soar. YOU can soar. Soaring is possible!
-Ayrfolio

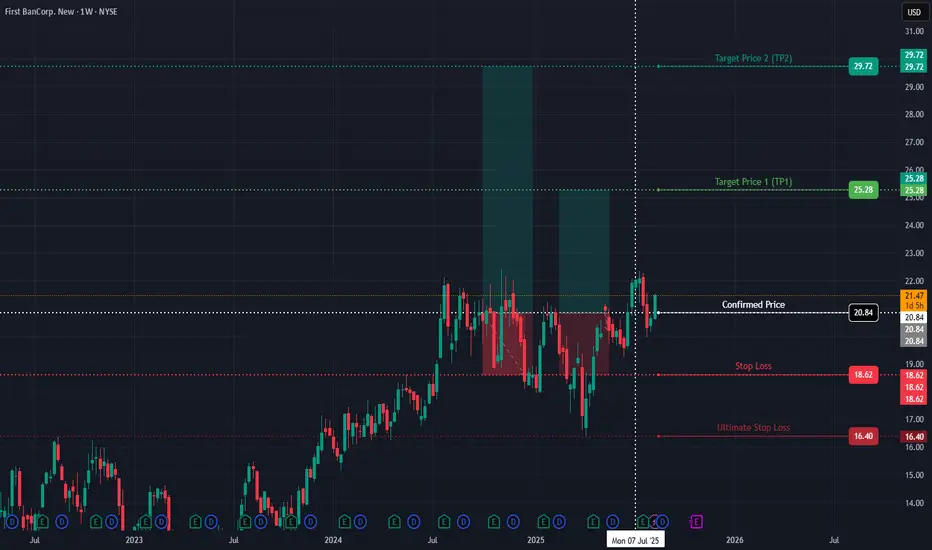
FBP Stock Long Position Confirmed Monday 7/7/25Hello,
Ayrfolio trade ideas are based on weekly charts and momentum, so remember to be patient! No day trades here unless the stock soars up intraday! Today we’re covering:
COMPANY: First BanCorp
STOCK SYMBOL: FBP
POSITION: Long
TP1 Risk-Reward Ratio: 2.0
TP2 Risk-Reward Ratio: 4.0
Stop Loss: must wait AFTER daily candle closes to exit trade (regular candle, NOT Heiken Ashi)
Ultimate Stop Loss: can exit IMMEDIATELY if price reaches this level during any trading hours
EXPLANATION: Weekly momentum increased and confirmed on Monday 7/7/25 at $20.84/share. Although the stop losses are listed on the chart, if momentum has been lost then we can exit before the price reaches the stop loss.
DISCLAIMER: Please do your own due diligence before making any decisions.
P.S. - Stocks can soar. YOU can soar. Soaring is possible!
-Ayrfolio
GPC Stock Long Position Confirmed Monday 7/28/25Hello,
Ayrfolio trade ideas are based on weekly charts and momentum, so remember to be patient! No day trades here unless the stock soars up intraday! Today we’re covering:
STOCK SYMBOL: GPC
POSITION: Long
TP1 Risk-Reward Ratio: 1.82
TP2 Risk-Reward Ratio: 3.63
Stop Loss: must wait AFTER daily candle closes to exit trade (regular candle, NOT Heiken Ashi)
Ultimate Stop Loss: can exit IMMEDIATELY if price reaches this level during any trading hours
EXPLANATION: Weekly momentum increased and confirmed on Monday 7/28/25 at $133.70/share. Although the stop losses are listed on the chart, if momentum has been lost then we can exit before the price reaches the stop loss.
DISCLAIMER: Please do your own due diligence before making any decisions.
P.S. - Stocks can soar. YOU can soar. Soaring is possible!
-Ayrfolio

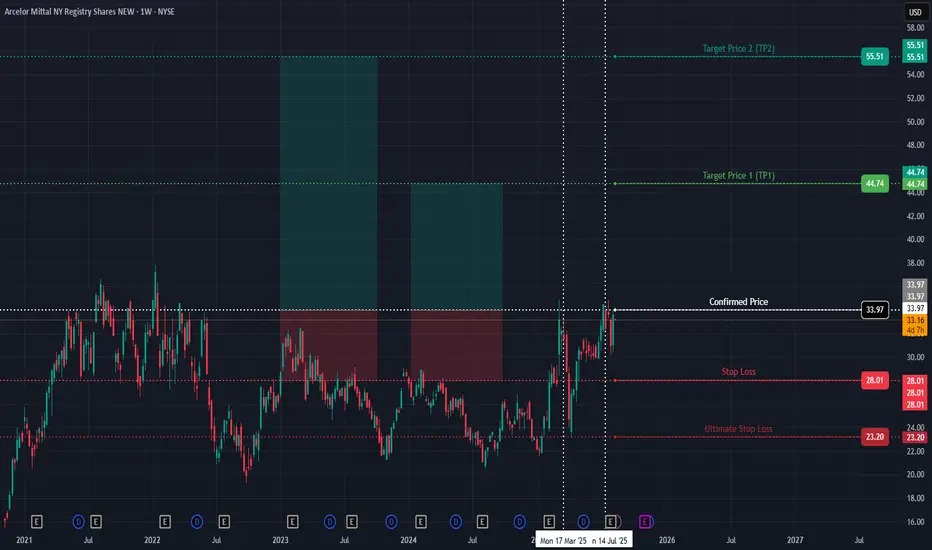
MT Stock Long Position Confirmed Monday 7/14/25Hello,
Ayrfolio trade ideas are based on weekly charts and momentum, so remember to be patient! No day trades here unless the stock soars up intraday! Today we’re covering:
STOCK SYMBOL: MT
POSITION: Long
TP1 Risk-Reward Ratio: 1.81
TP2 Risk-Reward Ratio: 3.61
Stop Loss: must wait AFTER daily candle closes to exit trade (regular candle, NOT Heiken Ashi)
Ultimate Stop Loss: can exit IMMEDIATELY if price reaches this level during any trading hours
EXPLANATION: Weekly momentum increased and confirmed on Monday 7/14/25 at $33.97/share. Although the stop losses are listed on the chart, if momentum has been lost then we can exit before the price reaches the stop loss.
DISCLAIMER: Please do your own due diligence before making any decisions.
P.S. - Stocks can soar. YOU can soar. Soaring is possible!
-Ayrfolio
PHG long position confirmed Monday 7/28/25Hello,
Ayrfolio posts stock trade ideas that can potentially soar up! Our strategy is based on weekly charts and momentum so you must be patient! No day trades here unless the stock soars up intraday! Today we’re covering:
STOCK SYMBOL: PHG
POSITION: Long
TP1 Risk-Reward Ratio: 1.99
TP2 Risk-Reward Ratio: 3.43
Stop Loss: must wait AFTER daily candle closes to exit trade (regular candle, NOT Heiken Ashi)
Ultimate Stop Loss: can exit IMMEDIATELY if price reaches this level during any trading hours
EXPLANATION: Weekly momentum increased and confirmed on Monday 7/28/25 at $26.46/share. Although the stop losses are listed on the chart, if momentum has been lost then we can exit before price reaches the stop losses.
DISCLAIMER: Please do your own due diligence before making any decisions.
P.S. - Stocks can soar. YOU can soar. Soaring is possible!
-Ayrfolio

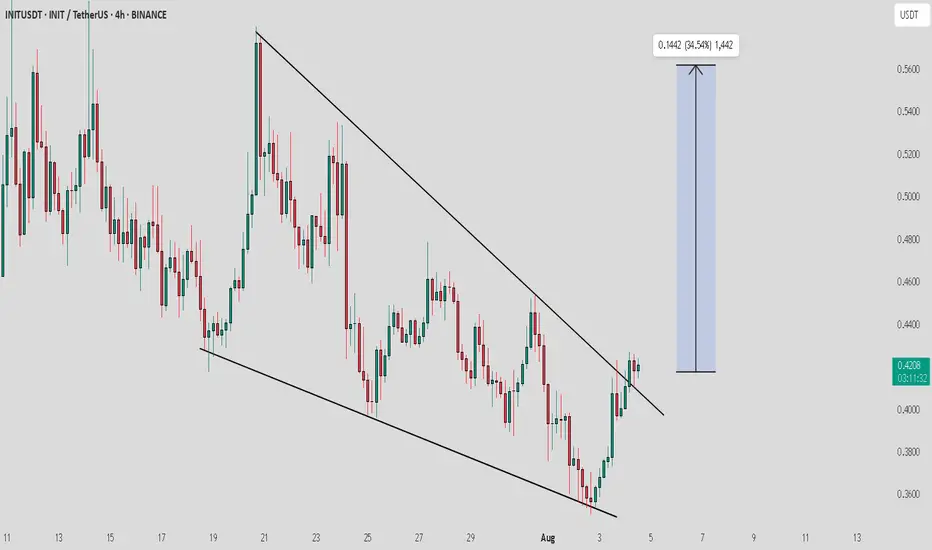
INIT / USDT : Momentum building..Keep a close watchINIT/USDT Breakout Alert
INIT/USDT is showing a strong breakout from a descending channel pattern, signaling a potential bullish move. This setup has great potential, and if the breakout continues, we could see significant upward momentum.
Target: Keep an eye on the next resistance levels, with a move potentially reaching towards $0.5.
BTC Double BottomFibonacci sequence is a mathematical concept; it appears in various aspects of everyday life and nature. It's not directly used in a calculated way, but its principles are reflected in the patterns we see around us. Its key for traders to pinpoint these reversal areas to keep a positive risk/reward ratio. Bulls will target 116k if this low can be sustained.

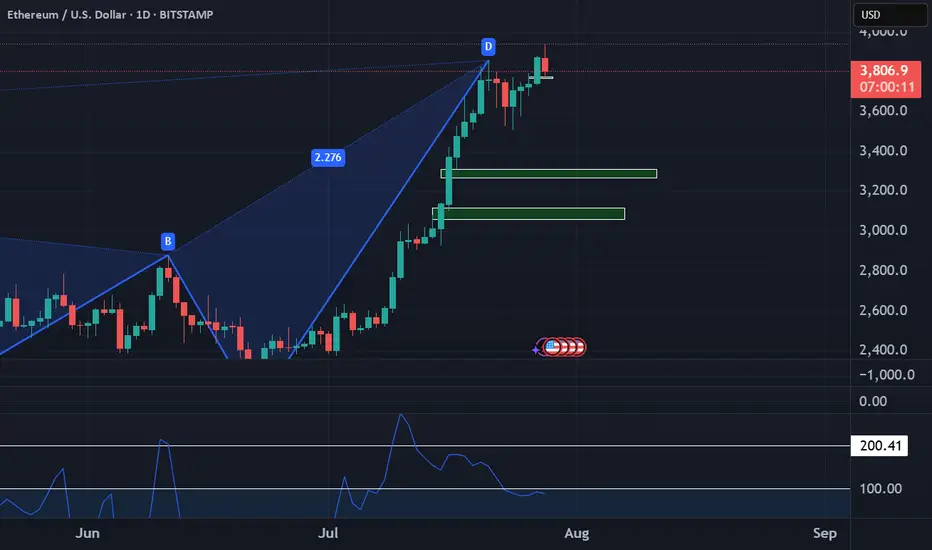
Ethereum bigger pictureToday we are measuring the difference between Ethereum's current price and its average price over a specific period. We see how far the current price deviates from its statistical average. This helps traders identify potential overbought and oversold conditions. Even though institutions and etfs have bought up over 32x the supply of Ether since May, it has showed in the past 36 Days with ether running over 80%, we look at reducing exposure as the risk remains for a correction in the short term.
SWING IDEA - AJANTA PHARMAAjanta Pharma , a mid-cap pharma player with strong branded generics in ophthalmology, dermatology, and cardiology, is showing a compelling swing trade setup backed by a high-probability technical breakout.
Reasons are listed below :
Bullish engulfing candle on the weekly timeframe, indicating reversal strength
2,500 zone acting as a crucial support
Holding above 0.382 Fibonacci retracement level , suggesting healthy correction
Price trading above 50 & 200 EMA on the weekly chart – long-term strength intact
Breakout from narrow consolidation near the 50-week EMA
Target - 3080 // 3400
Stoploss - weekly close below 2415
DISCLAIMER -
Decisions to buy, sell, hold or trade in securities, commodities and other investments involve risk and are best made based on the advice of qualified financial professionals. Any trading in securities or other investments involves a risk of substantial losses. The practice of "Day Trading" involves particularly high risks and can cause you to lose substantial sums of money. Before undertaking any trading program, you should consult a qualified financial professional. Please consider carefully whether such trading is suitable for you in light of your financial condition and ability to bear financial risks. Under no circumstances shall we be liable for any loss or damage you or anyone else incurs as a result of any trading or investment activity that you or anyone else engages in based on any information or material you receive through TradingView or our services.
@visionary.growth.insights


CSBBANK at Best Support !!This is the Daily Chart of CSBBANK.
CSBBANK is currently showing momentum while taking support from the EMA and SMA at 380 and 368 range.
If this level is sustain , then We may see higher prices in CSBBANK
Thank You !!

Most Traders React to Markets. The Best Anticipate Them.Most Traders React to Markets. The Best Anticipate Them.
Hard truth:
You're always one step behind because you trade reactively.
You can’t win a race if you're always responding to moves already made.
Here's how reactive trading burns your edge:
- You chase breakouts after they've happened, entering at the peak.
- You panic-sell into downturns because you didn't anticipate.
- You miss major moves because you're looking backward, not forward.
🎯 The fix?
Develop anticipatory trading habits. Identify scenarios in advance, set clear triggers, and act decisively when probabilities align - not after the market confirms.
TrendGo provides structure for anticipation - not reaction.
🔍 Stop responding, start anticipating. Your account will thank you.

$SSP Low volume on Wave 2, momentum risingFirstly, on the line chart is possible to watch the possible targets - blue lines - which one of it is almost as the same level as 2,618.
Fibonacci measured from the breakout to monthly resistance.
res M = monthly resistance
During the Wave 2, the two candles from last two days showed low volume as usual to happen during formation of W2, and it is possible to see that price at the breakout and after it was above average which can be read as high interest from buyers.
Confirming the volume, the EFI even though is decreasing still show strength,OBV follow the price trend but looks like buyers are entering again.
When it comes to momentum is possible to see that RSI did not crossed the equilibrium even after two bearish days, as ROC being a leading indicator which already changed direction . ADX is showing some strength for the trend direction confirmed by as DMI+ is still above DMI-
DTC = 1,36

Bitcoin Strong Momentum Below Key Resistance__________________________________________________________________________________
Technical Overview – Summary Points
__________________________________________________________________________________
Momentum: Strong bullish momentum across higher timeframes. Generalized “Up” alignment via MTFTI, strong leverage from the Risk On / Risk Off Indicator (Strong Buy on all timeframes except temporary 2H Down).
Supports / Resistances: Price evolving just below major resistances (107643.9, 109952.8, 111949) and holding above key defensive zones (104940/105287.8, then 100353/100335).
Volumes: Average on higher timeframes, very high/accelerating on 30min/15min (potential buying climax or local volatility spike).
Multi-TF/ISPD DIV Behaviour: ISPD mostly neutral, but “Sell” warning on 30min during volume peaks (risk of quick profit-taking or fake breakout).
__________________________________________________________________________________
Strategic Summary
__________________________________________________________________________________
Global Bias: Ultra-bullish. Momentum structure supported by technical/sectoral/on-chain convergence.
Opportunity: Buy on defended pullbacks (support 104940/105287.8) or daily confirmation > 107700. Extension toward 109950–111949 upon pivot breakouts.
Main Risk: Extreme volumes + ISPD Sell alerts (30min) = caution, speculative excess/whipsaw possible, quick profit-taking, lack of macro catalyst (weekend proximity).
Macro Catalysts: No urgent catalysts (macro stable, low exogenous risk).
Action Plan:
Tactical entry on defended pullbacks or validated daily signal > 107700.
Stop-loss below 104940 (pivot), swing validation below 100335/100353 (on-chain).
Active management of 107600–107700 zone (potential climax/local capitulation).
__________________________________________________________________________________
Multi-Timeframe Analysis
__________________________________________________________________________________
1D (Daily): Strong momentum, price just below pivots, no sell signal. Supports: 100300/93337.4.
12H: Similar structure, buyers in control, potential dip under 107600–109900.
6H/4H: Ongoing bullish impulse, test of the critical 107640–107644; no signs of weakness bar minor consolidation.
2H: Only TF Down, technical breakout underway, “Up” signal restoring (watch for fakeout below 107600).
1H: Strong Up momentum, breakout confirmed, next candle confirmation needed.
30min/15min: Record volumes, ISPD Sell at 30min: high “bull trap” risk. Microsctructure strongly bullish but high post-spike volatility risk.
Risk On / Risk Off Indicator: Strong Buy on all major timeframes.
Bullish Confluences:
Up alignment (all majors except 2H), breakouts, confirmed sectoral momentum.
Very high volumes = new trend or potential buying climax.
Short-term risks:
ISPD Sell + extreme volume 30min/15min = possible local exhaustion.
Critical zone: 107600–107700. Watch out for fake breakouts!
__________________________________________________________________________________
Strategic Bias – Pro Summary
__________________________________________________________________________________
Technical: Setups remain bullish. Pivot breaks “open” the target zone up to 109950–111949. Stops below 104940 (pivot), swing validation sub 100335/100353. Switch to active management on exhaustion signals (vol spike or ISPD Sell).
On-Chain: Mature distribution; upside limited without new catalyst, but 103700/104940 zone remains pivotal.
Macro: No bearish macro/news catalyst short-term, technical dominance prevails.
Operational Summary:
Tactical bullish stance.
Favor buying dips toward 104940–105287.8.
Partial profit-taking above 109950.
Switch defensive on daily break 104940/104000.
__________________________________________________________________________________

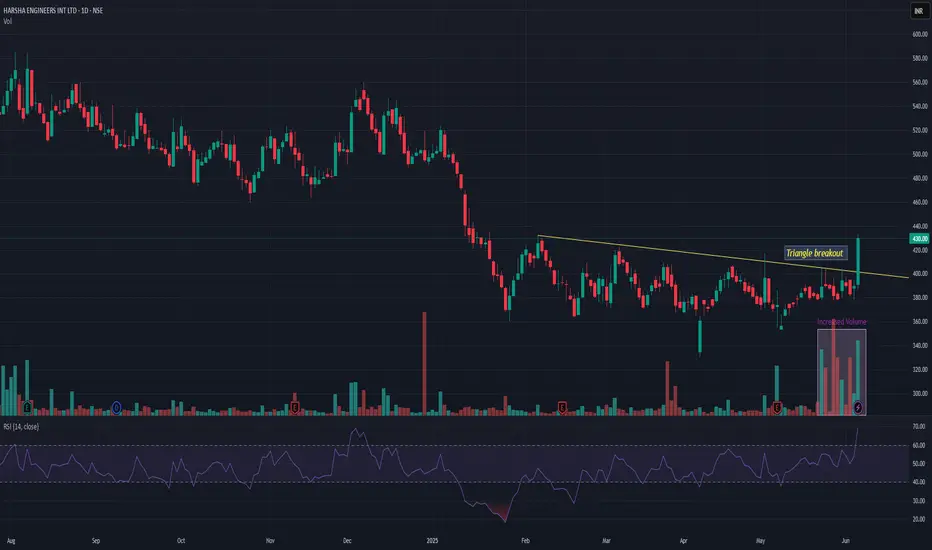
HARSHAHARSHA giving triangle breakout with decent volume. It is coming out of long 5 months consolidation. 400 seems good support. HARSHA may give momentum rally in nr future with resistance near 510.
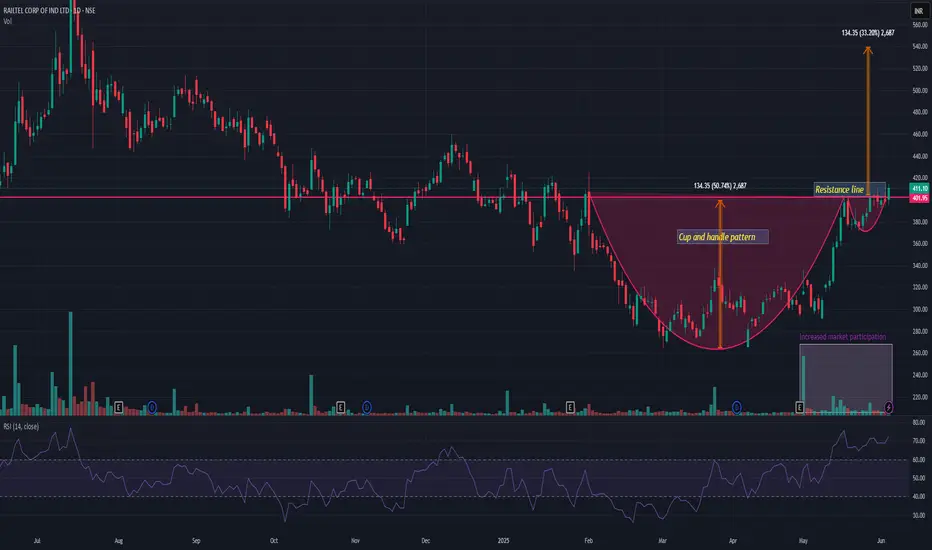
RAILTELRAILTEL showing very good strength and currently trading above resistance line. It has also been observed cup and handle pattern breakout with decent increased volume in recent days. If I consider recent depth then we may see approx 30-33% rally in coming days provided that it holds and closing above 380 levels all the time. Strong up move is on the table!
BTC/USDT: Strong Bullish Alignment, All Signals Green (01/06/25)__________________________________________________________________________________
Technical Overview – Summary Points
__________________________________________________________________________________
Momentum: Bullish structure confirmed by Risk On / Risk Off Indicator (“BUY” across all timeframes).
Key Supports: 103k–104k, consolidated on every horizon (1D to 15min).
Resistances: 105.5k–108k (short-term), 110k as a main pivot.
Volume: Moderately high, with no climax or distribution signals.
Behaviour: Proprietary indicators (ISPD DIV) show strong bullish confluence across timeframes; no divergences or significant bearish signals.
__________________________________________________________________________________
Strategic Summary
__________________________________________________________________________________
Directional Bias: Dominant bullish bias across all timeframes.
Opportunities: Tactical entries on pullbacks to 103k–104k, main exits >108/110k.
Risk: Invalidation below 101k; watch for extreme volumes or major macro catalysts.
Catalysts: Strong global risk-on dynamics (tech rally, institutional flows, weak USD); monitoring SEC regulation and macro events (NFP, CPI, FED).
Plan of action: Buy defended support zones, reduce on exuberance >110k, dynamic stop below 101k, stay reactive ahead of major events.
__________________________________________________________________________________
Multi-Timeframe Analysis
__________________________________________________________________________________
1D: Major resistance at 110k (Pivot High), strong support 101–104k, Risk On / Risk Off Indicator “BUY,” healthy volume; maintained momentum.
12H: Confluent resistance 105.5–110k, support 102.5–104k, bullish indicators, no divergence or volume climax.
6H: Resistances 105.5/108k, solid support 103–104k, strict bullish confirmations.
4H: Clustered resistances 105.5/108k, dense support 103–104k, digestion phase in volume (healthy consolidation).
2H: Major pivots 105–108k, supports 103k/101.5k, strong demand on pullback.
1H: Barriers 105.5–106k, support 103.4–104.2k, no bearish signals.
30min: Spot resistance at 105.5k+, support 103.8–104.2k, microstructure favors buying, weak selling pressure.
15min: Support 104k, resistance 105.5–106k, intraday flow remains pro-buy on weakness.
Risk On / Risk Off Indicator: Consistent “BUY” signal across all timeframes — sector and behavioural momentum alignment.
ISPD DIV: Positive histogram, no red zones or distribution alerts.
Volumes: Normal to moderately high, no climax suggesting trend end.
Summary: Strong multi-timeframe technical alignment. Bullish momentum, firmly defended supports. No imminent reversal signals, healthy consolidation within dominant risk-on trend.
__________________________________________________________________________________
Strategic & Fundamental Synthesis
__________________________________________________________________________________
Technical bias: Strong bullish conviction as long as 103–104k is defended, supported by Risk On / Risk Off Indicator/ISPD.
Fundamentals: Macro momentum (Nasdaq/US tech rally, weak USD), OI and spot dominance high, growing euphoria (ATH ~111k), watch for potential distribution if buyer exuberance peaks (P/L ratio 12:1).
Scenarios: Buy on defended flows 103–104k, TP >108–110k; caution on extreme volume at support.
Macro: Anticipate reactions to major events (NFP, CPI, FED). If a key event is due within 48h: prudence, adapt post-release.
Opportunities: Potential rotation to altcoins (SOL/ETH), short-term swing as BTC momentum pauses.
Momentum prevails, but caution warranted on any volume spikes or major macro headlines. Market remains a buy at support, optimal strategy is dynamic pullback/TP management, strict discipline in case of high-volume sell-off.
__________________________________________________________________________________
Actionable Summary
__________________________________________________________________________________
Entry: Buy securely on 103–104.2k zone
Stop: Hard invalidation if <101k (on volume)
Take Profit: 108–110k+
Risk: Excessive on-chain euphoria, violent support break
Stay agile near major releases and watch flow rotations (BTC/ALT)
__________________________________________________________________________________


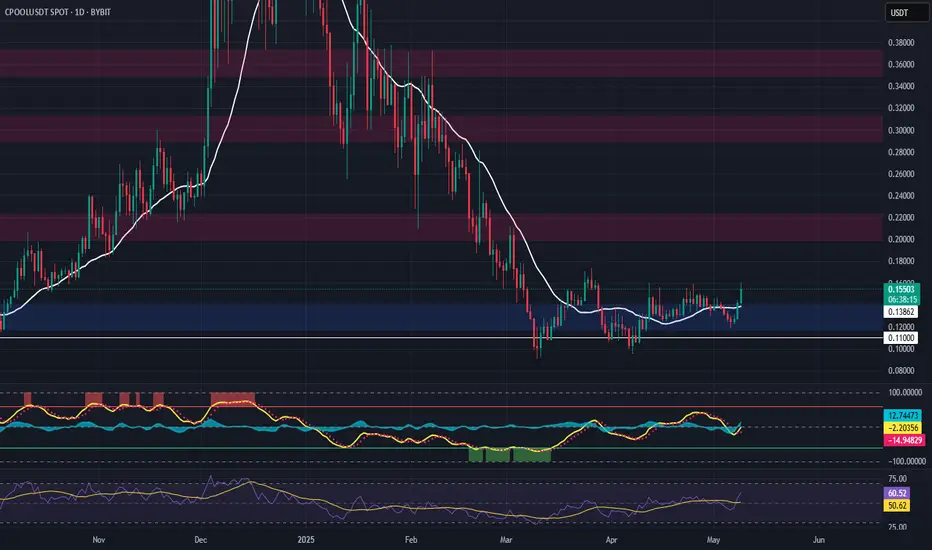
CPOOL (Clearpool) – Momentum Reversal Trade SetupCPOOL is flashing signs of a potential early trend reversal, supported by a strong bounce off a key support zone around $0.140. Price action suggests a reclaim of market structure, positioning this trade for a momentum shift with healthy upside targets.
🔹 Entry Zone:
Around $0.140 (support level)
🎯 Take Profit Targets:
🥇 $0.20 – $0.22
🥈 $0.29 – $0.31
🥉 $0.35 – $0.37
🛑 Stop Loss:
Daily close under $0.11