Eicher Motors – Breakout Trade SetupPrice has broken out of a 2-month consolidation range (₹6,880–₹7,200) with strong volume.
This indicates momentum continuation toward upper resistance levels.
✅ Buy Above: ₹7,200 (Breakout confirmation zone)
🎯 Targets (Swing / Short-Term):
T1 – ₹7,227
T2 – ₹7,336
T2 – ₹7,468
🛡️ Stop-Loss: ₹6,880 (below range support + 20EMA area)
⏳ Duration:
5–10 trading sessions (short-term swing trade)
📈 Reasoning (Professional View):
Breakout from a long consolidation box
Strong bullish candle + volume expansion
RSI breakout above 60 shows momentum shift
Above 20EMA after a sharp reversal
education purpose only
Momentumtrading

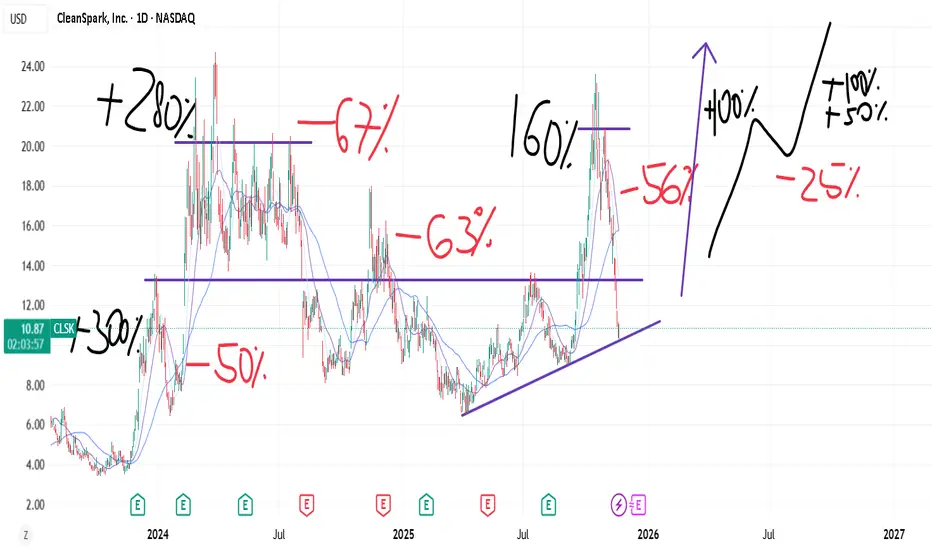
CLSK: Based on momentum principles.As long as BITSTAMP:BTCUSD delivers and AMEX:BLOK is relatively strong, and obviously NASDAQ:NVDA strong.
NASDAQ:CLSK every correction shows less damage (%) which I think is a bullish sign.
Momentum based on Dan Zanger principles. If you had a 160% rally. Even if trend was broken, I dont think you can kill a momentum this easily. Hence, at least "some" strength should follow. There are many examples, that I can show/fact proof.
The risks: I think TVC:TNX rallying is not good and TVC:DXY rally would both be a head wind.
Good: Gold topping should be defacto bottom for BTC near term? ie the driver for rotations. % chasing.
$XAUUSD Bearish Momentum Divergence. Quick trade oportunityIF and only IF:
The price breaks under this small tight channel.
The 3 SMA cross back under the 20 SMA.
The prices remains under the 150 SMA.
It would be a great opportunity to take a 2:1 quick trade on a 1H chart.
Why I say IF and only IF? Because the divergence itself isn't enough as a trigger, we need confluence, we need confirmations.
I'm setting up alerts in case the entry is confirmed.
Let's see

Weekly Market Outlook | Nifty · BankNifty · S&P 500Nifty closed 25,285 (+390 pts) after making 25,330 / 24,881 — once again perfectly respecting my range of 25,300–24,500! 💪
As expected, BankNifty confirmed its W-pattern breakout, jumping 2% — strength clearly visible in the PSU bank pack.
Next week focus
• Above 25,450 → breakout toward 25,700+
• Below 25,130 → selling pressure till 25,000 / 24,850
Range for the week: 25,700–24,850
Shorters, stay patient — only if BankNifty cracks 55,700 does weakness confirm. Till then, it’s buy-on-dips for me.
Global cue: Trump’s proposed 100% China tariff shook US & crypto markets — watch its spillover effect on sentiment.
S&P 500 closed 6,552 (-160 pts). Holding above 6,360 = buy-on-dips;
Above 6,625 → uptrend resumes.
Below 6,360 → correction toward 6,225 / 6,142 / 6,100.
Exciting week ahead for both momentum traders & option sellers!

Subros Ltd – Shakeout to Breakout Setup in ActionSubros Ltd – Shakeout to Breakout Setup in Action
NSE:SUBROS
📈Pattern & Setup:
Subros just played a textbook “shakeout and reversal” setup. After a deep shakeout candle that trapped late buyers and triggered weak-hand exits, the stock quickly regained momentum, closed strong, and reclaimed the high of the shakeout candle — a classic bullish signal.
The strong green candle closing above 1160 with sharp volume confirms buyers are back in control. This bounce from the shakeout zone shows that demand is returning with conviction.
Currently, price is positioned just below its short-term resistance near 1175. Once this level breaks with follow-through, we could see a clean rally toward 1300+.
📝 Trade Plan:
Entry: Above 1175 breakout with volume confirmation.
🚩Stop-Loss: 1100 (below the shakeout candle low).
🎯Targets:
Target 1 → 1230
Target 2 → 1305 (12% potential move)
💡Pyramiding Strategy:
1. Initiate 60% position above 1175.
2. Add rest once price sustains above 1200 on increasing volume.
3. Trail stop-loss to 1135 after crossing 1220.
🧠Logic Behind Selecting this Trade:
The stock has shown resilience after every minor dip, with each shakeout followed by a bullish engulfing or strong close — indicating absorption of supply.
This is a low-float stock (25.44%), and such setups can often give quick, sharp moves once the breakout triggers because limited free float amplifies demand-driven rallies.
It’s a perfect example of how a “shakeout candle” flips the market structure from weakness to strength when followed by volume confirmation.
Keep Learning. Keep Earning.
Let’s grow together 📚🎯
🔴Disclaimer:
This analysis is for educational purposes only. Not a buy/sell recommendation. Please consult your financial advisor before trading.

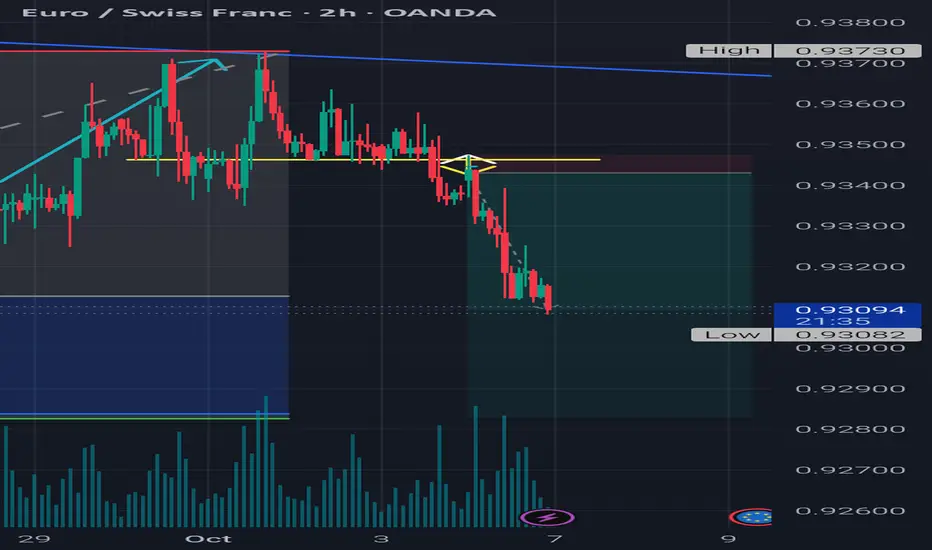
Momentum-Backed Retracement + Volume Retest | BadgerFX 📊 This setup establishes directional bias from the monthly chart (Current Bias: ). The trade idea integrates momentum-driven retracements in line with this bias and validates continuation through structure and volume on the 15m OANDA:EURCHF .
📍 0.93462 confirmed the shift in structure, supported by volume, reinforcing alignment with the monthly trend. Final execution 🎯 relies on candlestick precision for entry timing.
⚠️ Disclaimer: The information shared here is for educational and entertainment purposes only and should not be considered financial advice.
BadgerFX 🦡 – Honey Badger Don’t Care
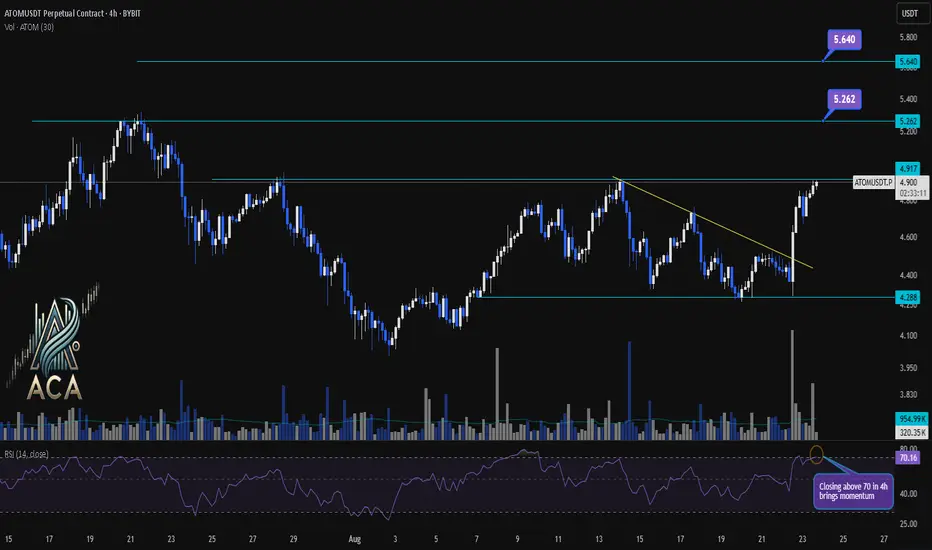
ATOMUSDT 4H Chart Analysis | Momentum Breakout in PlayATOMUSDT 4H Chart Analysis | Momentum Breakout in Play
🔍 Let’s dive into the ATOM/USDT perpetual contract and analyze the latest price action, outlining key bullish setups and momentum signals.
⏳ 4-Hour Overview
The 4-hour chart reveals a strong bullish push, with price surging above the trendline resistance and reclaiming the local $4.917 zone. Volume has notably increased, confirming the move’s strength. Meanwhile, the RSI indicator is closing above 70, marking the overbought territory and highlighting a surge in buyer momentum.
🔺 Long Setup:
On the upside, sustained momentum could ignite a rally toward $5.262 first, with a further target at $5.640 should follow-through buying persist. These levels line up with previous resistance zones and potential trend-based extensions.
📊 Key Highlights:
- 4H breakout confirms bullish bias and momentum shift.
- Volume spike adds conviction to the move.
- RSI closing above 70 signals strong momentum; a continuation could bring further upside.
- Short-term resistance targets are $5.262 and $5.640.
- “Closing above 70 in 4h brings momentum” — if sustained, might hint at a new trend leg.
🚨 Conclusion:
ATOM/USDT is showcasing renewed bullish momentum. Watch for confirmations above resistance and be mindful of short-term exhaustion signals in the overbought zone. If momentum holds, upside targets at $5.262 and $5.640 are in play.
S&P500: Losing Momentum !I see the rally comes to end, the recent upside move has no momentum. The stocks need a new catalysts to continue, but I do not think this to happen. I suggest that US500 to go down in the next 30 days or so.
Disclaimer: This content is NOT a financial advise, it is for educational purpose only.

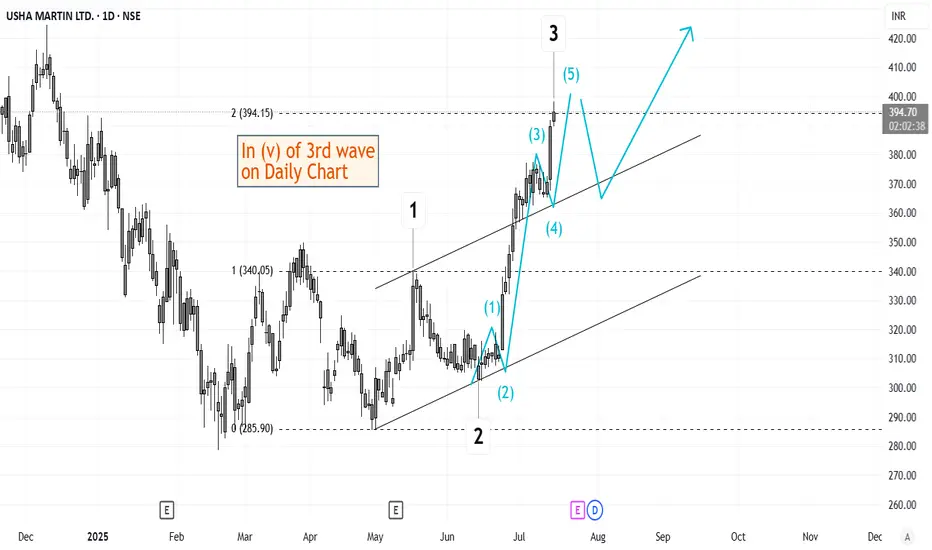
Elliott Wave Analysis of Usha Martin USHAMARTThe script is currently in (v) of 3rd wave on daily time frame. This should be followed by a short retracement and then a 5th wave up. Will keep updating this chart as it progresses.
Elliott Wave Analysis of Kirloskar Brothers KIRLOSBROSThe script is currently in 4th wave of hourly chart. The 4th wave seems to be ending, which means a 5th wave will start from here. The wave patters and patterns, retracements and analysis have been highlighted on the chart. Will update this as it progresses.

TFCILTDTFCILTD seems too strong and trading above all resistance zone. Strong volume has also been observed. Support can be seen near 275 levels. Seems too promising. Keep it on radar

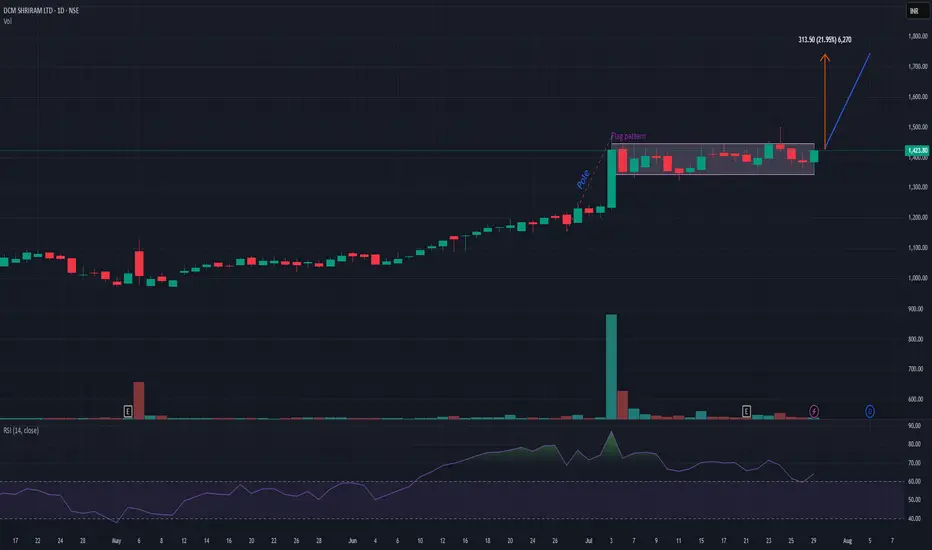
DCMSHRIRAMDCMSHRIRAM is on verge of flag pattern breakout provided that it closes above 1440 level. It has a potential to add up to 20-22% from this level. My view may change if it closes below 1350. Risk-reward is quite in favor. Keep it on radar.
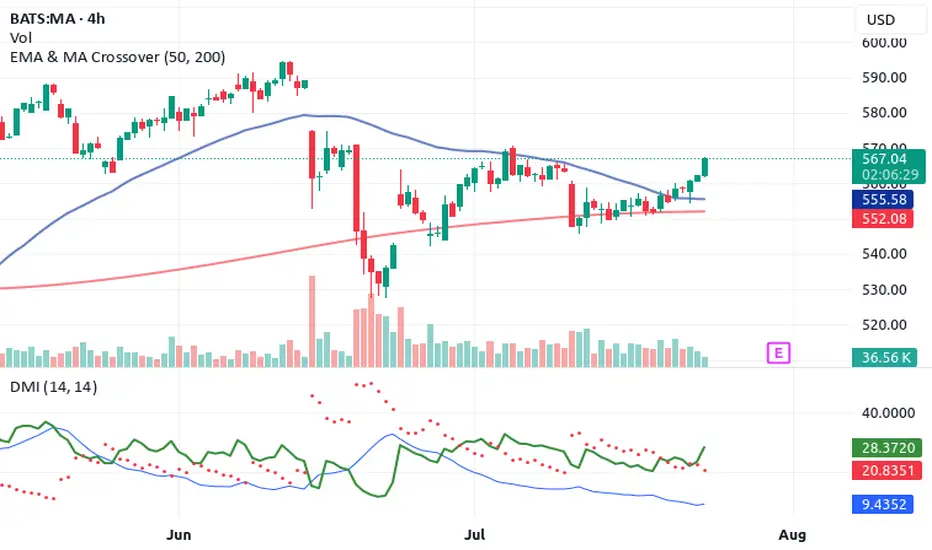
Top 4 Buy Signals Lighting Up Mastercard (MA) 🚀 Top 4 Buy Signals Lighting Up Mastercard (MA) | Rocket Booster Strategy
Mastercard Inc. (MA) is showing explosive potential, and it’s not just one signal—it’s a whole confluence of confirmations. When
you align this much market momentum, you don’t ignore it. Let’s break down how Rocket Booster Strategy gives us a powerful buy indication on the daily chart.
🔍 The Confluence Setup
✅ 1. DMI Buy Signal
The Directional Movement Index (DMI) is in bull mode. ADX is
rising and the +DI is firmly above -DI. This shows the trend is not just alive—it’s gaining strength.
🔻 2. Volume Oscillator Pullback
While Volume Oscillator is down, this is seen as constructive and not bearish. It suggests a quiet zone before the thrust—just like fuel loading before a rocket launch.
Smart traders know: momentum can build silently.
💥 3. Awesome Oscillator = Strong Buy
The Awesome Oscillator is green and firing hard. We’ve seen a clear twin-peak bullish formation followed by a break above zero
—classic acceleration sign.
🕯️ 4. Rising Window (Japanese Candlestick Pattern)
A Rising Window—a bullish continuation gap—has formed. This is one of Steve Nison’s top continuation patterns. It signals strong
institutional conviction in this trend.
📈 What Does This Mean?
When DMI, AO, candlestick patterns, and our own Rocket Booster Strategy all point up, it’s time to pay attention. This setup is rare—and high-probability.
🧠 Rocket Booster Strategy Recap
This strategy uses 3 momentum alignment points:
High Momentum Indicator (like AO) in Buy Mode
Pattern Confirmation (Rising Window or Engulfing)
Volume Correction Before Breakout (Fuel Before Fire)
When all 3 click into place, we have ignition.
🎯 Final Thoughts
Mastercard is looking primed for takeoff on the daily timeframe. Whether you’re an investor or a swing trader, this chart is
speaking loud and clear. But as always, risk management is your co-pilot.
✅ Add it to your watchlist.
🚀 Simulate entries.
🧠 Trust the confluence.
Rocket Boost This Content To Learn More
Disclaimer: This is not financial advice. Always use a simulation/demo account before committing real capital. Trade responsibly.
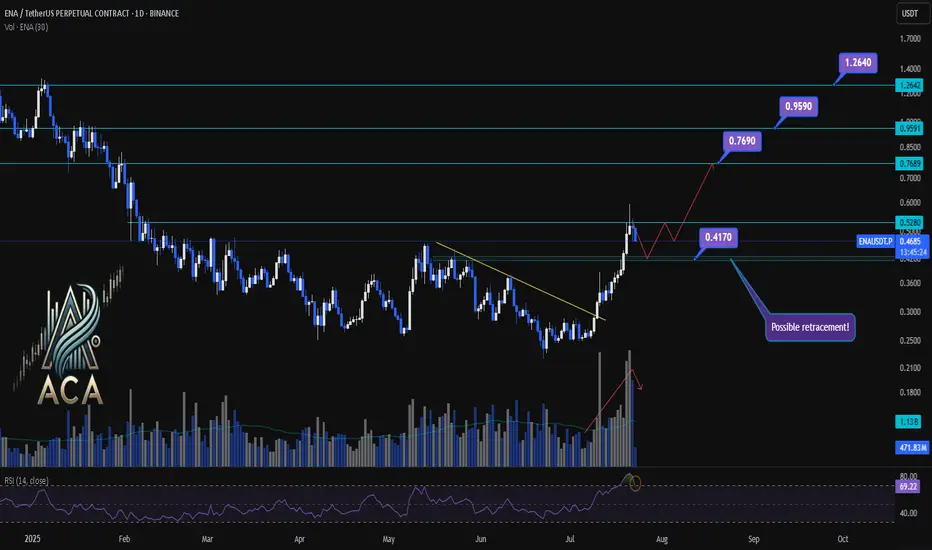
ENA/USDT Chart Analysis | Volatility Signals & Bullish TriggersENA/USDT Chart Analysis | Volatility Signals & Bullish Triggers
🔍 Let’s dive into the ENA/USDT perpetual contract and analyze recent price action, focusing on momentum shifts and key breakout scenarios.
⏳ Daily Overview
The daily chart shows that ENA recently reentered the overbought zone on the RSI, which can serve as a potential trigger for traders watching momentum shifts. Earlier, price action broke decisively above a long-standing descending trendline, resulting in a rapid, nearly 100% surge, a classic RR2 move off the trendline. This breakout coincided with a visible uptick in trading volume, confirming strong demand behind the move.
Now, during the ensuing rest or correction phase, trading volume is decreasing—often a constructive sign suggesting either profit-taking or a healthy pullback rather than panic selling.
🔺 Bullish Trigger & Setup:
- RSI Signal: Reentry into the RSI overbought zone is a potential long trigger, especially if confirmed by price action.
- Confirmation Level: A daily close with strong volume above $0.528 would add conviction to a bullish setup.
- Trendline Reference: The break above the recent trendline fueled the rapid advance, showing the importance of watching such key resistance levels.
📊 Key Targets (on further bullish confirmation):
- $0.769 — First upside resistance.
- $0.959 — Next bullish target.
- $1.264 — Extension target if momentum continues and broader market sentiment remains supportive.
🚨 Conclusion:
Eyes are on the $0.528 level—closing above it with volume, especially while RSI holds in the overbought zone, could provide the next strong entry signal. Current declining volume during pullbacks suggests this is likely a profit-taking phase or standard correction, not bearish capitulation. Keep monitoring RSI, volume profile, and price closes for the next actionable opportunity.
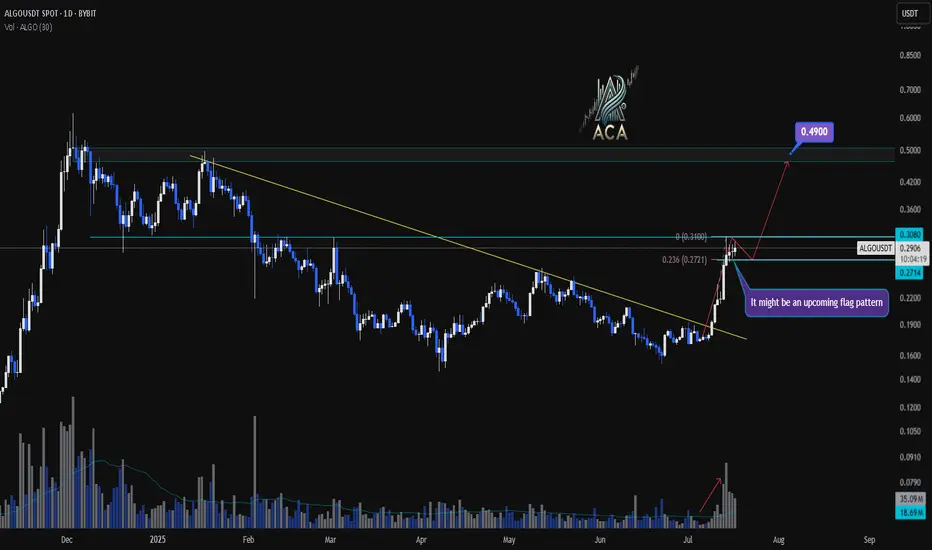
ALGOUSDT Daily Chart Analysis | Continuational patternsALGOUSDT Daily Chart Analysis | Momentum Picks Up on Higher Timeframe
🔍 Let’s break down the latest ALGO/USDT daily chart, highlighting a shift in market structure and key bullish signals.
⏳ Daily Overview
A decisive breakout above the long-standing descending trendline has flipped the narrative for ALGOUSDT. Increased volume during the breakout points to robust bullish momentum, suggesting buyers are regaining control at this multi-month inflection point.
🔔 Flag Pattern & Chart Structure
- Bullish flag pattern is emerging after the recent breakout, as price consolidates in a tight range—a classic continuation formation.
- Former trendline resistance is now acting as support, confirming a notable shift on the higher timeframe.
📐 Fibonacci & Target Levels
- The 0.236 Fibonacci retracement at $0.2771 is providing immediate support, with price consolidating above this anchor level.
- Upside targets:
- First resistance at $0.3080, which aligns with horizontal supply and previous pivot highs.
- If the flag pattern resolves upward, the next Fibonacci extension points to $0.4900, marking a significant confluence and potential for further gains.
📊 Key Highlights
- Strong daily candle and surging volume confirm momentum shift.
- Watch the developing flag pattern for breakout confirmation.
- Major trendline break on the daily signals structural reversal.
- $0.3080 is the immediate target; $0.4900 is the extended objective from the flag/Fibonacci alignment.
🚨 Conclusion
ALGOUSDT is setting up a compelling bullish scenario—keep a close eye on price behavior at the flag and $0.3080 level. A breakout may trigger the next impulsive move toward $0.4900.
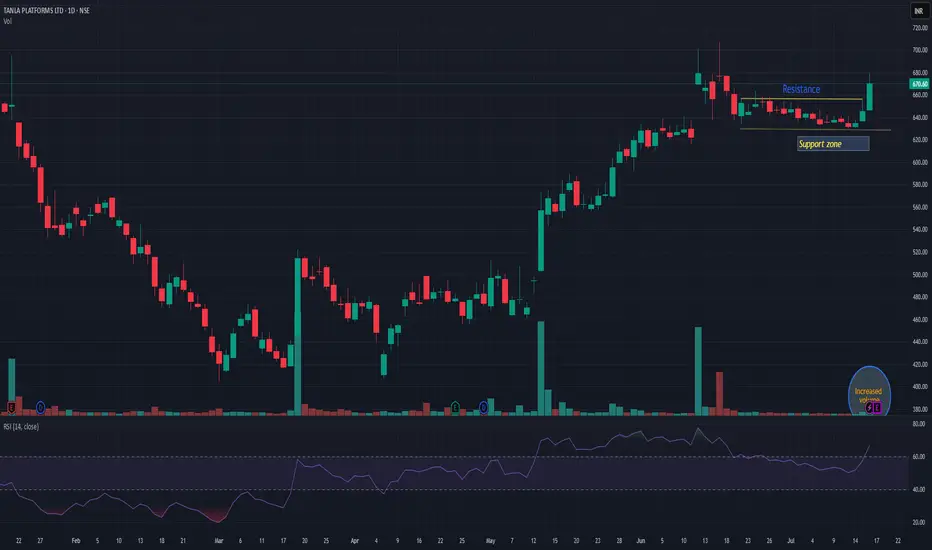
TANLATANLA giving resistance breakout with decent volume. Seems it may start momentum from here. 625-30 is strong support zone. below this my view may be changed. Risk-reward is quite in favor.
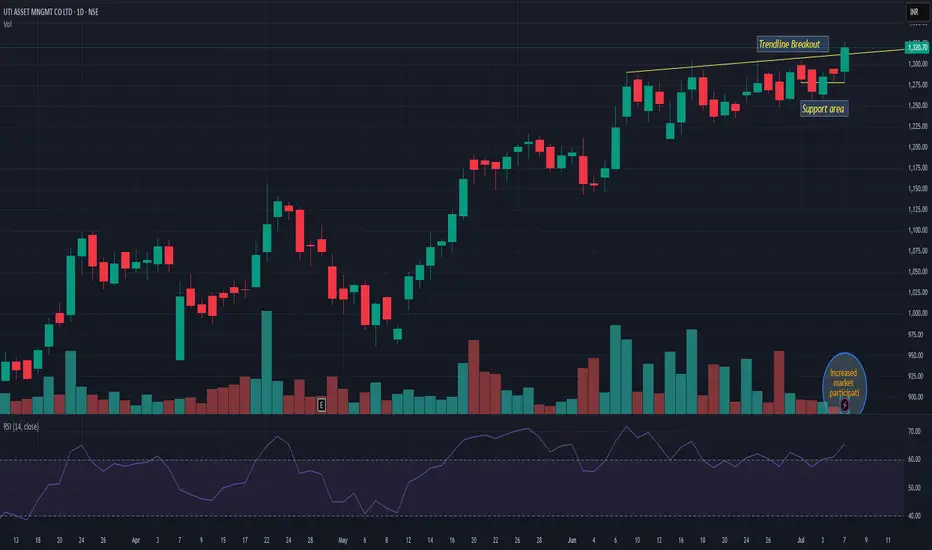
UTIAMCUTIAMC giving trend-line breakout with increased volume. It is trending just 5=7% away from ATH. 1250 seems strong support and on upper side it may trade above 12-15%. Keep it on radar
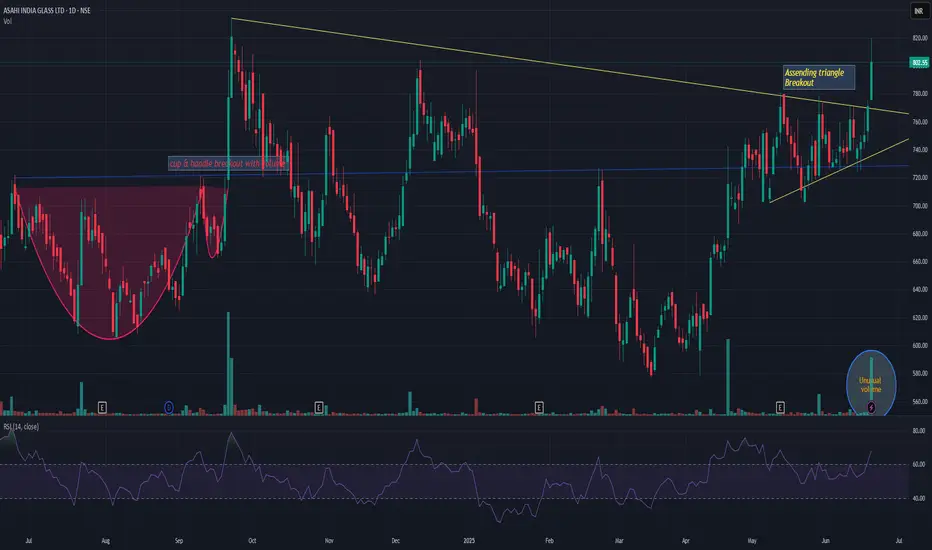
ASAHIINDIAASAHIINDIA has given symmetrical triangle breakout with unusual volume. Already took a momentum. Now as long as it is above upper channel line, i believe the momentum will continue till 980-1000 levels. Keep it on radar.
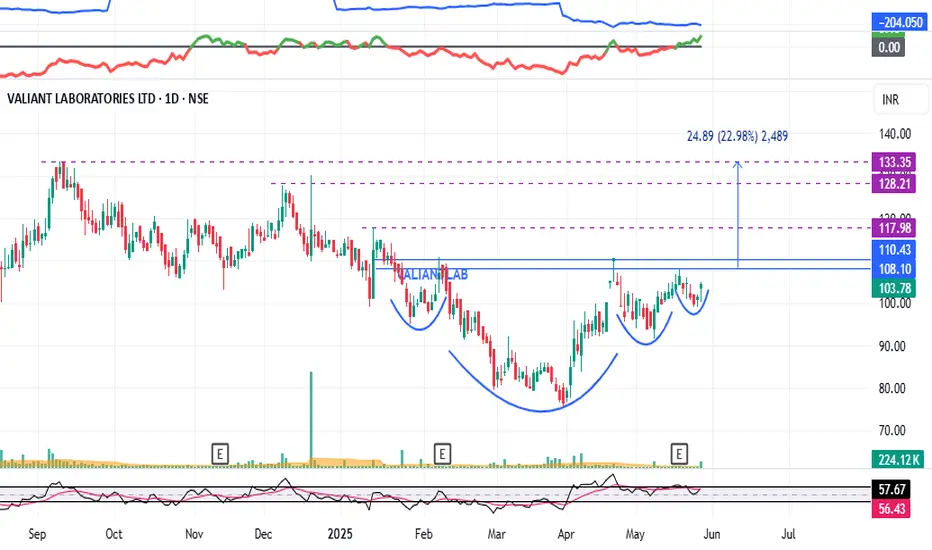
VALIANTLAB : Breakout Candidate (Swing Pick)#VALIANTLAB #swingtrading #breakoutstock #momentumstock
VALIANT LAB : Swing Trade
>> Cup & Handle Formation Visible
>> VCP Structure also Visible
>> Good Strength in stock
>> Volume Contraction seen, Expansion imminent
>> Potential Upside 23%
Swing Traders can lock 10% profit and keep trailing.
Disc : Stock chart shared for Learning Purpose and not a Trade recommendation.
GBP/USD Daily Chart – Explosive Move Building in Wave 3?The GBP/USD daily chart is setting up for what could be one of the most powerful bullish phases in an Elliott Wave sequence: a third wave.
🔥 What This Means:
Elliott Wave theory identifies the 3rd wave as the strongest and fastest part of a trend.
Price action suggests that GBP/USD is just starting this move, which means we could see sharp momentum to the upside in the coming days and weeks.
🎯 Key Target:
The first key level to watch is around 1.5315, which is the 1.618 Fibonacci projection of Wave 1.
This is a common and high-probability target for a Wave 3 rally.
🧠 For Beginners:
In Elliott Wave theory, markets often move in impulses of 5 waves. The 3rd wave is typically the strongest. When that third wave itself breaks down into another 5-wave structure, the middle wave of that sequence (the "3 of 3") tends to produce the most aggressive movement.
📌 Summary:
GBP/USD appears to be starting the 3rd wave, a powerful bullish signal.
Near-term resistance to watch is at 1.4200, with potential for further upside if momentum continues.
This could be the early stages of a high-probability swing trade setup. Keep an eye on the smaller timeframes for intraday confirmation!

Momentum Trade in Dam Capital1. Resistance breakout
2. Positive Divergence on RSI
3. Volume pop up
4. MACD signal turning green
5. RSI near 70

Weekly Market Wrap: Nifty Surges Past 25,000 – What's Next? The Nifty 50 index closed the week at 25,019, posting an impressive 1,000-point rally from the previous week’s close. The index made a high of 25,116 and a low of 24,378. The rally was driven by short covering and a surprise truce between India and Pakistan, which injected a wave of optimism into the market.
More importantly, Nifty broke out of the consolidation range of 23,200–24,600, closing strong above the psychologically significant 25,000 mark – a clear sign of bullish sentiment.
What to Expect Next Week (Outlook May 20–24)
Expected Range: 24,450 – 25,600
A breakout above 25,600 could open the doors for a retest of the all-time high (ATH) at 26,277.
As long as Nifty trades above 23,800, the broader trend remains intact.
Monthly Chart Patterns to Watch
A bullish "W" pattern could be forming, which ideally would require a pullback from current levels before resuming upward.
On the flip side, a bearish "M" pattern may emerge if the index tests ATH and faces rejection, which could trigger a sharp correction of 2,500–2,600 points.
For now, I remain cautious until the monthly time frame confirms a clear bullish breakout.
Global Markets Check: S&P 500 Eyes Key Resistance
The S&P 500 closed at 5,958, gaining 300 points week-on-week. As anticipated, a breakout above 5,770 propelled the index to meet all short-term targets of 5,821 / 5,850 / 5,900.
Key Level to Watch: 6,013
This is a major Fibonacci resistance — the same level where the market started correcting back on March 3, 2025.
A weekly close above 6,013 would be bullish, potentially triggering rallies toward 6,091 / 6,142 / 6,225.
However, a breakdown below this week’s low of 5,786 would confirm a failed breakout, with downside targets at 5,637 / 5,551 / 5,458.
Momentum traders, get ready – sharp moves are coming either way!

XRP/USDT — Structure-Driven Strategy (1H Chart)Just price, structure, and volume — tracked in real time.
🧠 Chart Breakdown:
✅ Reversal Buy — Price flushed, then snapped back into the range with follow-through. That became the base structure for everything that followed.
⛔ Top Exhaustion / Rejection — Clean reversal after a strong rally. Volume dropped off, candles showed hesitation, and sellers stepped in.
⚠️ Small Rejection Mid-Range — Structure failed to push higher. This area marked a trap — no volume confirmation, no continuation.
🚨 Major Breakdown & Recovery Setup — Price dropped hard but reclaimed key levels quickly. The recovery candle and volume spike were the first clues buyers were stepping in again.
👀 Current Watch Point — Price is now pressing back into that same resistance zone. The structure here is everything — a clean reclaim could mean trend continuation. But hesitation again? Fade it.
Always happy to be helpful.
