Macro Liquidity Model + Altcoin True Market Cap: CorrelationMacro Liquidity Model vs Altcoin Real Market Cap — CCI & MACD Confirmation
This model uses the formula:
FRED:M2SL / (CRYPTOCAP:TOTAL3 – CRYPTOCAP:USDT – CRYPTOCAP:USDC – CRYPTOCAP:DAI) × TVC:VIX
It shows the relationship between global liquidity (M2) market fear (VIX) and the true altcoin market capitalization (TOTAL3 excluding stablecoins).
This helps us understand which phase of the market we are currently in.
At the moment we are somewhere right near the bottom — if not already at the bottom. You can safely start accumulating any asset you prefer.
The CCI shows “overbought” conditions for M2, which actually means altcoins are oversold.
MACD hasn’t touched zero yet, which suggests there might still be a small dip left — which is also visible on the TOTAL3 – USDT – USDC – DAI chart.
If the next weekly candle closes bullish, there is a chance the market will continue rising until May, especially if the 2020 fractal repeats.
In general, May looks like the optimal time to start taking profits — and then we will see how the macro develops from there.
For additional clarity:
the upper chart represents global money (M2)
the lower chart represents altcoins
the higher the upper chart goes → the more money is OUT of the market
the lower it drops → the more money is FLOWING into the market
Moneyflows

GOLD Bullish Analysis (SMC)🟦 PROFESSIONAL BREAKDOWN
🔎 1. Market Context
Price creates a strong bearish displacement, leaving a clean FVG unmitigated.
Then a significant ChoCH forms at a demand zone, signaling the first shift in market intention.
🧱 2. Institutional Accumulation Zone
Between the OB-5M and the support zone, we see:
• Consecutive rejections
• Order absorption
• Indecision candles
All of this reveals institutional buyers defending the level.
📉 3. Liquidity Sweep & Manipulation (Fake Out)
Price temporarily breaks below support, generating:
• Sell-side liquidity
• Immediate buy-side absorption
• Clean return into the range
This follows the classic SMC blueprint:
Liquidity → Mitigation → Expansion.
📈 4. Bullish Confirmation
A clean BOS confirms internal bullish structure.
The sequence becomes:
1. ChoCH
2. Liquidity sweep
3. OB mitigation
4. Bullish BOS
5. Expansion towards targets
Perfect institutional flow.
🎯 5. Entry Zone
📍 BUY 4,015
Confluences:
• 5M Order Block
• Strong support zone
• Fake out with absorption
• FVG mitigation
• Structural confirmation (BOS)
🛡️ 6. Stop Loss
📍 SL 3,990
Placed below the liquidity sweep — beyond this level, the idea is invalid.
🎯 7. Take Profits
• TP1: 4,045 → first distribution target.
• TP2: 4,067 → major buy-side liquidity target where institutions offload positions.
🧠 Professional Conclusion
This setup is built on:
✔ Liquidity engineering
✔ Clear structure
✔ Mitigation principles
✔ Institutional rejection
✔ Organic expansion
A high-probability bullish setup, fully aligned with institutional price behavior.
💬 Motivational Message…
“Great traders don’t chase the market — they anticipate it. Trust your process, respect your levels, and execute with confidence. Consistency is built candle by candle.”

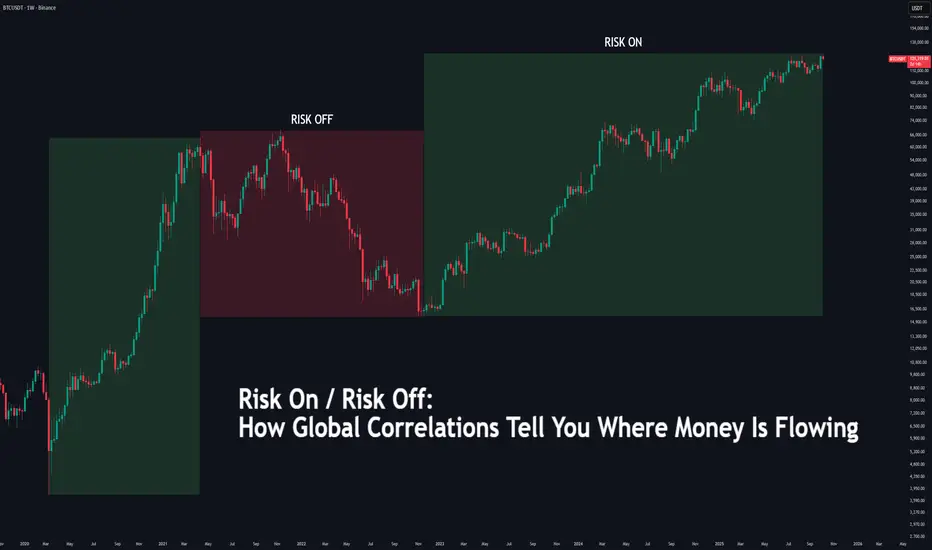
Risk On/Off: How Global Correlations Tell You Money Flow🔵 Risk On / Risk Off: How Global Correlations Tell You Where Money Is Flowing
Difficulty: 🐳🐳🐳🐋🐋 (Intermediate+)
This article is for traders who want to understand how global capital flow affects market behavior — from equities and crypto to gold and bonds. Learning to read “Risk On” and “Risk Off” regimes helps you anticipate big shifts before they hit your chart.
🔵 INTRODUCTION
Markets are not independent islands — they are connected by one universal force: liquidity flow .
When investors feel confident, they move capital into riskier assets like stocks and crypto — this is called Risk On .
When fear dominates, capital flows back into safety — bonds, gold, and the U.S. dollar — known as Risk Off .
Recognizing this rotation allows traders to align their bias with the flow of global capital rather than fighting it.
🔵 WHAT IS “RISK ON”
Risk On is a market environment where investors seek higher returns, volatility is subdued, and capital flows into assets with greater reward potential.
Typical Risk-On behavior:
S&P 500, Nasdaq, and other equities trend higher
Bitcoin and crypto assets outperform traditional markets
U.S. Dollar Index (DXY) weakens as money moves abroad
Bond yields rise moderately as investors leave safe assets
Gold often consolidates or declines
In simple terms: Money chases opportunity.
🔵 WHAT IS “RISK OFF”
Risk Off describes defensive conditions — fear rises, volatility expands, and liquidity seeks safety.
Typical Risk-Off behavior:
S&P 500 and risk assets decline
Bitcoin and altcoins drop sharply
DXY strengthens as investors move into USD
Bond yields fall as money enters treasuries
Gold rallies as a safe-haven hedge
In simple terms: Money runs to safety.
🔵 HOW TO DETECT RISK SHIFTS
Market regimes don’t flip instantly — they rotate through correlated behavior.
To identify the shift between Risk On and Risk Off, monitor key macro instruments together:
DXY (Dollar Index): Rising DXY = Risk Off sentiment, Falling DXY = Risk On.
SPX / NASDAQ: Strong uptrends = Risk On, persistent weakness = Risk Off.
BTC vs DXY: Inverse correlation; BTC strength with DXY weakness = liquidity expansion.
Bond Yields (US10Y): Rising = optimism, Falling = risk aversion.
VIX Index: Below 15 = complacent Risk On, Above 25 = fearful Risk Off.
🔵 THE GLOBAL LIQUIDITY CYCLE
Liquidity always moves in phases — expansion, acceleration, contraction, and reset.
Phase 1 – Liquidity Expansion: Central banks inject liquidity → Risk On begins.
Phase 2 – Overextension: Assets rally strongly, leverage increases, volatility stays low.
Phase 3 – Liquidity Contraction: Monetary tightening or policy shocks trigger Risk Off.
Phase 4 – Repricing & Reset: Markets bottom as new liquidity returns.
Understanding this rhythm helps traders avoid confusion when markets seem “irrational” — because they’re not, they’re simply rotating through the liquidity cycle.
🔵 USING RISK ON/OFF IN TRADING
Even technical traders benefit from recognizing global risk regimes.
By aligning with the dominant liquidity direction, setups gain higher probability.
Crypto traders: Use SPX, DXY, and VIX correlations to confirm momentum.
Stock traders: Track gold and yields to gauge investor confidence.
Forex traders: Trade USD pairs according to global sentiment.
Swing traders: Filter trade bias by checking the current global regime.
Tip: When correlations align (e.g., DXY up, SPX down, BTC down), expect trend continuation.
When they diverge, volatility or reversals are likely.
🔵 ADVANCED TOOLS TO WATCH
Global Liquidity Index: Track combined balance sheets of the Fed, ECB, BOJ, and PBC.
Stablecoin Supply (Crypto): Expanding supply = liquidity entering market.
Yield Curve (10Y–2Y spread): Falling = caution, Rising = recovery.
Funding Rates: Confirm risk sentiment via leverage buildup.
🔵 CONCLUSION
All markets are connected through liquidity.
Risk On and Risk Off regimes describe how that liquidity rotates between return and safety. By tracking global correlations — equities, bonds, gold, DXY, and crypto — traders gain a powerful macro filter to stay on the right side of momentum.
Liquidity creates direction. Correlation confirms conviction.
If you learn to read the global flow, your technical analysis will finally make sense in the bigger picture.
Do you track global correlations in your analysis? What’s your favorite Risk-On or Risk-Off indicator?
Europe Vs US Break Out!This chart suggests huge long-term implications after breaking for the 2nd time this 16-year downtrend. EU since Trump took office has outperformed the US by 23%!
More than half of that has occurred since the ambush on Zeleneskyy in the Oval Office.
While no new high has been made yet to confirm, it is noteworthy that money may be flowing toward the EU more than the US for a decade or more.
EU has a much lower debt to GDO at 80% than the US at 125%. Stock valuations are much more attractive than in the US. So much so that I labeled the EU as a value trap. Not anymore!
The biggest obstacle right now is how much would a US recession impact the EU. Even if it does, I expect the EU to perform much better than the US. As such this chart should continue to outperform.
I have another post up you may want to follow.

Alt Season is Right Around the CornerBitcoin dominance has been growing in the past few days as it outperforms the rest of the cryptocurrency market after the sharp drop last week. Many things are pointing towards Bitcoin continuing to outperform in the short term as we gear up for the next parabolic bull market.
However, alt season is very close and, once BTC confirms it's breakout towards 100k, a lot of the large caps like Ethereum and Solana will begin to go up very quickly. This is based on my cyclical analysis of alt seasons. To get a better idea of the cyclicality of cryptocurrency, Bitcoin, and alt seasons, check out my previous post which predicts the next parabolic rise in November:
An important thing to note when referring to alt seasons is that they don't last long (only a few months). So understand your timeframe when investing over the coming weeks. Another important idea is how money tends to flow during this period. It historically starts with Bitcoin breaking its all time high and beginning to rise. During this time, altcoins tend to underperform. But once BTC consolidates and begins to go sideways, that's when the rest of the market has time to catch up. In the chart I show 4 key points:
Bitcoin
This is when BTC makes a significant breakout whether that's from a significant resistance level or its ATH. This is where BTC is outperforming 99% of the market.
Ethereum & Large Caps
BTC will begin to slow down and a lot of the major altcoins will see a big increase. This is where you can find great trade setups on the BTC pairs like ETHBTC, SOLBTC, etc.
BTC Consolidates
BTC will start to go sideways, cooling off and preparing for its next rise. From here you might see some pumps in mid-low caps. These tend to be volatile and hard to predict.
Small caps - Quick and fast
As BTC continues to go sideways, some small caps might experience quick pumps in price. Similarly, these tend to be even more volatile and hard to predict.
After this, the pattern repeats back up to Bitcoin until we reach a peak and begin a new bear market.
The cryptocurrency bull market is brewing up and alt season can offer some incredibly profitable opportunities. Plan ahead, and don't overtrade.

What If Smart Money Shifts from Traditional Companies to Crypto?This idea explores the potential scenario where smart money moves from traditional top 100 Nasdaq companies to the crypto space. As Nasdaq reaches its peak and becomes less attractive, blockchain companies offer more reasonable valuations, and the crypto market continues to open up, providing new opportunities. This shift could drive substantial growth in the blockchain and crypto sectors as traditional finance investors look for higher returns in emerging technologies.

What Is Money Flow In & Out of a Stock? And Why Should You Care?Professionals often speak of money flowing in or out of a stock, but how can that be if there is an equal number of buyers and sellers? It is because “Money Flow” comes from the balance of the lot sizes.
There are four possible positions in any one stock:
Buy
Buy to Cover
Sell
Sell Short
Each investor and trader in the stock has their own separate agenda. Each may come from a different Market Participant Group. There are now 9 Stock Market Participant Groups, starting from those who buy first, at the bottom of a new upward cycle:
The giant Buy Side Institutions who invest Mutual and Pension Funds and/or create ETFs and other kinds of stock market derivatives.
The Sell Side Institutions, aka the big banks and major market makers
Wealthy Individual Investors
Corporations
Institutional/ Pro Traders
High Frequency Traders (HFTs)
Small Funds
Individual Small-Lot Investors, Investment Groups and Individual Retail Traders
Odd-Lot Investors
Buyers are anticipating that the stock is going to move up. Their stock order types span the spectrum, for example: Market Orders, Limit Orders, Stop Orders. Buy to Cover Orders are placed by traders who sold short and are now taking profits.
Those who are selling the stock are anticipating that the stock is going to move down. In an uptrending stock, this is profit-taking near the top of the run. It can also be similar in a downtrending stock because the seller is afraid that the stock is going to move down more, and they have been holding through what they thought was a short retracement. Most of these stock order types will be “Sell at Market” (SAM). Sell Short Traders are anticipating that the stock is going to move down, and they can place a variety of orders just like the buyers.
Both Buyers and Sell Shorters are entering the trade, while Buy to Covers and Sellers are exiting the trade.
It is the mix of these different types of buying and selling coupled with the kind of investor or trader and the size of their share lots that causes money to flow in or out of a stock.
If the buyers are mostly large lots and the sellers are mostly small lots, who is in control? The buyers purchasing large lots . This is because, at some point, there will not be enough small-lot sellers, and those who are Selling Short will turn and start Buying to Cover, creating more of a shortage of sellers. Consequently, this will put more pressure on the buy side.
There are always latecomers to a stock run, and they are usually small-lot buyers. As the stock moves up in price, more of the small-lot buyers will step in, pushing the price up even further. Most small-lot buyers typically use a “Buy at Market” Order, which is the worst kind to use to control the entry price.
As the stock moves up further in price, the last of the Short Sellers will panic and Buy to Cover, causing the stock to gap up or jump even higher. This then triggers the large-lot buyers to start selling for profit. As profit-taking begins, the stock dips in price. This causes the odd-lot buyer, who is the last in the market participant cycle to buy, to rush into the stock and buy because they have been told to “Buy the Dip.” By now, the news media has been talking about this stock and its great run. Consequently, the odd-lot uninformed investor finds the dip irresistible and buys on pure emotion without any analysis of the stock. This causes the final gap up and exhaustion pattern.
Now, while all of those odd-lot latecomers are buying, who is selling to balance the equation? Market Makers are Selling Short and the Smart Money, who were the first to enter, are selling to take profits. Suddenly, the large lots are now shifting to the downside, and what happens? The control switches to the sellers who are moving larger lots. Now, money is flowing out of the stock, yet the price may go up briefly before a downtrend develops.
Large lots are usually wiser investors and traders who know more than the other investors and traders. So the giant Buy Side Institutions investing Mutual and Pension Funds, who have access to information often not yet available to Individual Investors and Retail Traders, are called the Smart Money.
It can be assumed that the smaller the lot size, the less the investor or trader knows and understands about the market. As smaller lots move in, a shift of power occurs due to the large lots moving to the sell side, and thus money shifts to flowing out of the stock.
As the stock collapses and reaches a price or equilibrium near a base or bottom, those smaller lots who held through the collapse reach an emotional point of extreme pain of loss and begin to sell in panic. In response, the Smart Money and Market Makers switch roles again, Buying to Cover their profitable shorts and buying to hold as the stock moves up again.
Summary:
Every time you take a position in a stock, there are also three other positions in that same stock. You need to be aware of each of these and make sure that you are with the right group. Most of the time, traders who are having problems with their trades are simply trading with the wrong group. It is important, then, to learn about today's stock market structure and what I call the "Cycle of Market Participants." When traders can trade with the flow of the Smart Money, they have a decided advantage.

USD/JPYOANDA:USDJPY
Awesome moves on the USD/JPY on the heels of CP today.
Just follow the money flow, and watch your higher timeframe levels.
Wait for your set-up, don't try to outsmart it and front run it.
Let it come to you.
Trade smart, trade well

ThrillThe USDOLLAR is continuing its road to zero and ignorant bitcoin "investors" and "experts" have no clue what the real reason for their magic beans going up is.
Bitcoin is behaving pretty predictably. In the details can't tell if the price stays around 20k for long, or keeps going up, going to depend on how fast the USD falls. Depends how excited the crypto community gets.
But for sure BTC is "following" the general global monetary & geopolitic situation.
Bitcoin permabulls are starting to get thrilled. Excited bagholders looking to FOMO in (after exiting a few months ago) are not able to log in and buy (lol)!
The CME also just announced they would launch Ethereum futures.
Out of all the instruments available, smart money can look for the best trade, best pullback best RR:
Euro, Krona, Indonesian bonds, or even Bitcoin, whatever it may be.
🤔
China currency is likely just going to strengthen, the west will continue to collapse, and in 3 years the Vietnamese middle class will come spend their strong currencies on holiday in the US, UK, France & Germany.
If BTC competes with China east asian regional currency (that competes with the USD) they might have to ban BTC.
Crypto CFDS are gone in Europe, if I want to bet on BTC I can go through Kraken, I think I'll just pass.
Might as well just short USDCNY & USDSEK that keep winning, there is literally no difference with buying BTC, it is the same trade.
Long term investments for me - this is a side activity - will be Asian fixed income tools as well as maybe a few UK, Australia, Scandinavian, and Asian stocks, certainly not some coinflip crypto lottery ticket; and I will not take much risk personally, my goal is very slow and steady, safe bonds mostly, even with very small returns, just want certainty and as little risk as possible.
Crypto is random and it has a high risk of getting banned.
The west and the US can continue to collapse for a while so everything including Bitcoin can continue to go up.
With asians making their own money and China "conquering" Hong Kong (for its financial center what else?), they will invest their surplus in their own economies rather than continue to finance the US growth & comfort social programs.
France is even worse, social programs ALONE are a bigger % of GDP than the ENTIRE China public spending in % of GDP.
I think they plan on robbing people savings directly, to survive a bit longer. Better flee to the UK or anywhere else before this happens.
The UK might survive. They have demographic issues though, and have a hard time securing their borders, and already have 1000 tribes fighting each other, and they still have not started taking pro-natality measures (will they ever?).
For delusional BTC "true believers" that think BTC is going up on its own:
Asian money just going to keep on keeping
Recently I had a very good buy on Bitcoin, with Europe guaranteeing losses, comfy.
But it all got banned, too many noobs getting their faces ripped off.
I do not think it is worth the trouble to go out of our way to get some BTC. I won't. Just cannot be bothered.
In PPS:
- China 16% of world GDP
- USA 16% of world GDP
- EU (-UK) 16% of world GDP
Apart from banning crypto CFD I don't see what the EU has in mind? Maybe they ban Bitcoin because it transmits covid? (according to them)
I'd keep my eyes on the USA currency and on what China will do.
I see no reason for the price of Bitcoin not to keep going up.
