Risk Management: The Art of Long-Term Survival
Risk Management
Imagine a hero standing at a crossroads with three paths.
If he takes the road to the right, he will face a serious challenge with a difficulty level of 100. At the end of this path, however, he will be rewarded with five gold bars.
The middle road leads to ten gold bars, but the hero will encounter not one, but three challenges along the way. Each of them is no less difficult than the one on the right-hand road. Taken together, their total difficulty amounts to 300.
The left road involves a less demanding challenge with a difficulty of 60, but the reward is modest — only one gold bar.
Which path would you choose if you were in the hero’s place?
Now suppose the hero chose a balanced level of risk, but along the way he was bitten by a snake and never even reached the challenge.
This is exactly what risk-taking in financial markets looks like.
In the real world, risk is first and foremost the probability of loss.
Risk is an inevitable consequence of the fact that the future is unknown. At any given moment, there are far more possible outcomes than those that ultimately materialize. It is precisely this gap — between the range of potential outcomes and the single realized result — that gives rise to risk. The future cannot be viewed as a predetermined or predictable script; it is a spectrum of possibilities that includes both favorable and unfavorable outcomes.
An investor may estimate the range of the most likely scenarios and base their expectations of the future on them. However, even the most probable event offers no guarantee that it will actually occur.
Risk comes in many forms, and the probability of loss is only one of them. Another important type is the risk of missed opportunities — the risk of taking too little risk. Staying on the sidelines can cause an investor to miss a recovery or a growth phase and ultimately drop out of the investment process altogether.
Particularly destructive is the risk of selling at the bottom. In this case, the investor not only locks in losses but also forfeits the chance to participate in the subsequent recovery, which often leads to a permanent exit from the market.
There are also risks associated with rare but catastrophic events. These risks may remain hidden for a long time, creating the illusion that a strategy is safe — until they suddenly materialize with severe consequences, as in the example of the hero and the snake.
Risk has a contradictory and deceptive nature. It depends not only on the asset or the market itself, but also on the behavior of market participants. When people feel safe and confident, they tend to act less cautiously, and actual risk increases.
Conversely, when risk is recognized and perceived as high, behavior becomes more restrained, and risk may decrease.
Paradoxically, rising prices often increase risk, while falling prices can make an asset safer — even though most people intuitively perceive the opposite.
Risk management is not a one-time action or a reaction to a crisis; it is a continuous process.
Since it is impossible to know in advance when adverse events will occur, risk control must be present at all times, not only during periods of obvious threat.
The essence of a sound approach is not the complete avoidance of risk, but its conscious acceptance, analysis, and limitation. An investor takes on risks they understand, can diversify, and are adequately compensated for.
Ultimately, the investor’s task is to build an asymmetric outcome profile: to participate in upside when events unfold favorably, and to lose less when negative scenarios materialize.
Such asymmetry is a hallmark of true skill and reflects a deep understanding of probability distributions, hidden risks, and acceptable loss limits.
How to Form Your Own Risk Assessment in a Specific Situation
To address this question, it is useful to turn to the work of Ed Seykota. One of his core ideas can be summarized as follows:
Risk is not the size of a potential loss in itself, but the probability of that loss occurring given the current market structure.
An important implication follows from this:
The profit-to-loss ratio (risk/reward) is not an independent criterion of trade quality.
The risk of a specific trade is determined by two key factors:
the market environment,
the distribution of profits and losses.
However, the decisive element is not the absolute size of the potential profit, but the probability of achieving it, as defined by the market context
Consider a situation where the potential profit is relatively small compared to the possible loss. From a formal risk/reward perspective, such a trade appears unattractive. But if the market conditions suggest that the probability of a positive outcome is high — for example, around 90% — the risk no longer appears unreasonable. In this case, the trade is justified not by the magnitude of the payoff, but by the stability of the probabilistic edge.
An individual trade, taken in isolation, is meaningless. What matters is how similar situations play out over a large sample size.
Even with a very high probability of success, risk becomes unjustified if:
a negative scenario is capable of destroying a significant portion of the capital;
or a single rare loss outweighs the cumulative result of many successful trades.
This is why, within any robust system, probability and loss control must always go hand in hand. High probability without loss limitation is not trading — it is gambling.
Unjustified Risk
Suppose a trader manages to earn 5% on their account over the course of a month , while the benchmark — for example, the Nasdaq — delivers a return of 8% over the same period. What does this imply?
To answer this, we turn to the concept of alpha .
Alpha is a metric that measures how much a strategy’s or trader’s performance deviates from the benchmark return, after accounting for the level of market risk taken.
If a trader engages in active intraday trading — assuming operational, market, behavioral, and tail risks — yet achieves a return lower than that of the benchmark, this indicates that risk was taken without adequate compensation . The critical issue is not the mere presence of risk, but the relationship between risk and outcome.
By its nature, intraday trading involves high engagement, frequent decision-making, exposure to market noise, commissions, slippage, and psychological pressure. All of these factors increase the strategy’s total risk profile. If, despite this, the final result underperforms a passive benchmark, alpha becomes negative. This means that each unit of risk taken was not only unrewarded, but actually worsened the overall financial outcome.
In such a case, alpha does more than simply indicate “underperformance relative to the market.” It highlights the inefficiency of the risk taken . The trader is effectively performing a more complex and uncertain task while achieving a result that could have been matched — or exceeded — through passive exposure, without active trading and its associated risks.
This is precisely what constitutes unjustified risk: risk that does not increase expected returns and does not improve the distribution of outcomes.
Thus, intraday trading with returns below the benchmark is an example of risk-taking without economic rationale. Alpha here serves not as a goal, but as a diagnostic tool. If alpha is negative, it indicates that the trading risk is not merely unjustified — it is value-destructive relative to a passive alternative.
Integration into Trading
1. Market Context Comes Before the Trade
In real trading, the first object of analysis is not the entry, not the stop, and not the take-profit — it is the state of the market itself.
The key question you must answer is:
Is there a recurring market situation here that historically shifts the probability in my favor?
If the situation is not repeatable and lacks a clear internal logic, the trade is not considered at all — regardless of how attractive the risk/reward ratio may look.
2. Probability Matters More Than Potential Profit
Once the situation has been identified, the focus shifts not to profit, but to the probability of the scenario playing out.
In practical terms, this means:
You must understand why the market is more likely to continue the move rather than reverse.
The reason for entry should explain why continuation is more probable, based on the logic of market participants’ behavior — not merely be the result of a formal signal.
Even if the potential profit is relatively small, a trade may still be justified if:
The probability of success is consistently above random;
The situation is reproducible over a large sample size.
3. Loss Is Defined in Advance — and Rigidly
A loss is not something to “figure out along the way.”
It is defined before entering the trade and is not revised in the hope that the market will “come back.”
The core integration rule is simple:
No single loss should be capable of damaging the integrity of the system
This implies:
Strictly limited risk per trade;
No scenarios in which one unfavorable outcome wipes out the results of many successful trades.
4. Serial Thinking Instead of Evaluating Individual Trades
True integration happens at the mental level. You stop evaluating trades in terms of “profit or loss.”
Each trade is viewed as:
One element within a series;
One roll of the dice with a known probability bias.
In practice, this leads to:
No emotional reaction to a single loss;
No euphoria from a single winning trade.
5. Trade Selection Instead of Increased Activity
Integrating this approach almost always reduces the number of trades.
You enter the market only when:
The market provides a readable context;
The scenario has a statistical edge;
The risk is clearly defined in advance.
If the market does not offer these conditions, you do not “look for trades” — you wait.
6. Evaluating Results by Process, Not by Money
In real trading, success is not measured by daily PnL, but by:
Adherence to the logic of situation selection;
Discipline in loss limitation;
Consistency of execution.
A losing day can be a perfect day if all decisions were made within the framework of the system.
Risk Management Framework in Investing
Risk should be distributed not only across trading instruments, but also across sources of returns.
A portfolio composed of assets dependent on a single growth scenario creates an illusion of diversification while remaining structurally fragile. True diversification implies exposure to different sectors, asset classes, and underlying economic processes.
An important element of risk management is time diversification. Entering positions in stages reduces the risk of poor timing and mitigates the impact of short-term market fluctuations. Investing the full amount at a single price point turns an investment into a timing bet rather than a conviction in the underlying idea.
Liquidity risk must also be taken into account. An asset that cannot be sold without a significant discount carries hidden danger. Liquidity matters not during calm periods, but during times of stress, when exiting a position may become critically important.
Diversification also means being willing to keep part of the capital out of the market. Holding free liquidity reduces decision-making pressure and allows the investor to respond to opportunities that arise during periods of panic. Full capital deployment increases the risk of forced actions.
Risk reduction becomes necessary when uncertainty rises. Increasing correlations between assets, changes in macroeconomic conditions, growing leverage, or excessive market optimism are signals to reassess portfolio structure. In such periods, capital preservation takes precedence over returns.
An increase in investment risk is acceptable only when there is a sufficient margin of safety. Expanding exposure to higher-risk assets is justified when capital is growing, the investment horizon is long, and acceptable losses are clearly defined. An investor does not increase risk in an attempt to “catch up with the market.”
Portfolio structure should reflect not only the investor’s expectations, but also their ability to withstand unfavorable periods. There is no universal allocation; however, practical guidelines help keep risk within manageable limits.
Portfolio Structure Guidelines
Low-risk allocation serves as the foundation and stabilizer of the portfolio.
Typically, it represents 50–70% of total capital . This segment includes highly liquid assets with relatively predictable behavior. Its purpose is not to maximize returns, but to preserve capital and reduce overall portfolio volatility.
Moderate-risk allocation usually accounts for 20–40% of the portfolio. These are assets with growth potential but without critical dependence on a single scenario. They generate the core long-term returns and absorb part of the market’s fluctuations.
High-risk allocation is limited to 5–15% of capital. This segment includes assets with high volatility, asymmetric payoff potential, and an elevated probability of deep drawdowns. Losses in this zone must never threaten the integrity of the entire portfolio. If an asset can go to zero, its position size must be small enough for that outcome to be non-critical.
Rebalancing and Capital Discipline
Rebalancing is a mandatory component of risk management. As high-risk assets appreciate, their weight increases automatically, and part of the gains should be reallocated toward more stable segments. During market declines, the portfolio structure is reviewed based on changing conditions rather than emotional reactions.
Increasing exposure to high-risk assets is appropriate only when capital is growing, the investment horizon is long, and potential losses are clearly understood. Reducing exposure becomes necessary during periods of heightened uncertainty, macroeconomic shifts, or declining personal risk tolerance.
A portion of the portfolio should be held in cash. Cash is not inactivity or a missed opportunity — it is an asset that serves both defensive and strategic functions.
Typically, cash represents 10–30% of the portfolio , depending on market conditions and uncertainty. During stable growth phases, it may sit near the lower end of this range. In periods of elevated volatility, uncertainty, or after prolonged market rallies, increasing the cash allocation becomes prudent.
A cash position reduces overall portfolio risk and alleviates psychological pressure.
Free liquidity allows decisions to be made calmly, without the need to sell assets under unfavorable conditions.
The key principle lies not in finding the perfect percentage, but in maintaining the chosen structure . Discipline in risk allocation is more important than precision in initial calculations.
A Risk Management Framework in Trading
Risk management in trading does not begin with entering a trade; it begins with accepting the fact that any trade can end in a loss. A trader who is not internally aligned with this reality will inevitably violate their own rules. Accepting losses as a legitimate outcome is a fundamental condition for survival in the market.
Position sizing is more important than the entry point. Even a strong idea loses its value if its size is disproportionate to potential adverse scenarios. A trader is not required to predict direction perfectly, but they are obligated to control the consequences of being wrong.
Every trade must be “paid for” in advance. The potential loss must be known and psychologically accepted before entry. For one trader, an acceptable risk may be one percent of capital; for another, five percent. These figures are not universal truths — they reflect individual tolerance for uncertainty, trading style, and time horizon. What matters is not the number itself, but strict adherence to it.
For a beginner trader, an acceptable risk per trade is typically a loss of no more than one to two percent of the account. This level of risk allows the trader to endure a series of losing trades without causing critical damage to capital and, just as importantly, to psychological stability. Under these conditions, the risk-to-reward ratio should be no less than 1:2 and, in more favorable setups, should approach 1:3. This means that the potential profit of a trade should be at least twice, and preferably three times, greater than the potential loss. With such an approach, a trader maintains a positive mathematical expectancy even when a portion of trades ends in losses.
No single trade is decisive. The market is a sequence of attempts, not a single trial. Focusing on the outcome of an individual trade undermines discipline and distorts risk perception.
Refusing to exit is also a decision — and it carries risk. Holding a losing position in the hope of a reversal is not a neutral action; it is an active choice to increase uncertainty.
Periods of growth require no less caution than periods of decline. Confidence reinforced by a streak of successful trades often becomes the source of the largest losses. Growth in capital is a reason to reduce risk, not to increase it.
The best kind of risk is one that allows for error. A strategy that leaves no room for mistakes is doomed in the long run. Resilience matters more than precision.
The goal of risk management is not to eliminate losses, but to preserve the ability to continue trading. A trader wins not when losses are avoided, but when losses do not deprive them of the ability to take the next step.
This post is based on our own experiences and research we've gathered from books and various platforms.
Enjoy!
Moneymanagement

G O L D B U Y Gold looking to give some nice clear opportunities to the upside by looking at it’s structure , can capitalise on a nice scalp trade , remember to 50/50 the trades and trial

EURJPY BUYEurjpy small scalp within the trend and will now allow it to trigger us into a trade and scalp to the upside

BUY LIMIT EURJPYLooking to be buying Eurjpy to it’s recent highs and also will use a buy limit to enter the trade

“BTC Liquidity Sweep → Bounce”BTC Trendline Break Setup
⸻
🔍 Quick Summary
I’m seeing BTC react strongly from the 0.618 retracement + demand zone, and the bearish trendline is losing power with every touch. The next interaction with this trendline looks primed for a clean breakout, and I’m positioning myself for a move toward the liquidity sitting above the weak high 🔥.
⸻
📊 Deep Analysis
Price has tapped into a major area of demand just above 94k–90k, which lines up perfectly with the 0.618 FIB from the larger swing. This zone has previously acted as a strong base for impulsive moves, and I’m seeing that same type of absorption now — long wicks, slowing bearish momentum, and a clear BOS structure forming.
The descending trendline has produced multiple rejections, but each reaction is getting smaller. That usually signals seller exhaustion. The BOS at the bottom of the structure confirms a short-term shift, and I expect price to make its way back up to retest the trendline one more time.
Above current price sits a Weak High at ±135k, which is almost always a magnet for liquidity. The chart even shows a projected long setup targeting this level with a ~41% move. Given BTC’s market context, this is a realistic target if the trendline breaks.
Volume confirms compression, and the recent BOS + CHoCH sequence suggests buyers are slowly regaining control. As long as 87k holds, this bullish structure remains intact.
⸻
🎯 Trade Idea Scenario
Bullish Scenario
• Entry: In the 94k–90k demand area (already reacting).
• Confirmation: Break + retest of the descending trendline.
• TP1: 106k (FIB 0.382 / prior structure).
• TP2: 135k (weak high liquidity target).
• SL / Invalidation: Below 87k — that would break the demand structure and shift the narrative bearish.
Bearish Scenario
• Only valid if BTC rejects the trendline hard and closes below 87k.
• That would open the path to 80k and possibly to the strong low around 72k.
• At the moment, this seems less likely based on the reaction inside demand.
⸻
📌 What I’m Watching Next
I’m watching how BTC behaves when it reaches the trendline again. A strong close above it with volume will confirm the bullish continuation. If price stalls or produces heavy wicks, I’ll wait for clearer structure before adding to the position.
⸻
⚠️ Disclaimer
This is just my personal analysis and not financial advice. Always do your own research and manage risk carefully 📉📚.

COPPER — 5.064 Long, Confluence and stacked oddsCMCMARKETS:COPPERZ2025
Fundamental: Bullish (5 Stacks) — supply disruptions and China demand.
Technical: Bullish (6 Stacks) — above EMAs, ADX 20.6, RSI 60.8.
Summary: Strong alignment; industrial momentum intact. Actionable Bullish Trade above 5.05.
Stop Loss: 4.96 Take Profit: 5.19 (~0.07 ATR × 1.52 / 2.6 R reward).

$BNB SURPRISED $1,111 INCREDIBLE PRICE DONE ($999-$1,111)CRYPTOCAP:BNB SURPRISED $1,111 INCREDIBLE PRICE DONE ($999-$1,111)
Previous Incredible Price 2025
$777 $888 $999 $1,111
Future Incredible Price 2028
$2,222 $3,333 $4,444
#Write2Earn #BinanceSquareFamily #Binance #BNB #SUBROOFFICIAL
Disclaimer: This article is for informational purposes only and does not constitute financial advice. Always conduct your own research before making any investment decisions. Digital asset prices are subject to high market risk and price volatility. The value of your investment may go down or up, and you may not get back the amount invested. You are solely responsible for your investment decisions and Binance is not available for any losses you may incur. Past performance is not a reliable predictor of future performance. You should only invest in products you are familiar with and where you understand the risks. You should carefully consider your investment experience, financial situation, investment objectives and risk tolerance and consult an independent financial adviser prior to making any investment.

$BTC BULL RUN RALLY & Showing a WOLF PATTERN 2025Road to Bull Run 2025, price Growing upward movement starting at $108K — $115K — $122K — 128K — $136K Who Entry at $111K and using $100K stoploss.
Bitcoin trades near $116,200, rebounding from $109,000. A close above $117,500 may boost buying, while rejection could trigger profit-taking. Key support is at $113,000. Traders are anticipating a 99% chance of a 25 basis points rate cut at the next Federal Open Market Committee meeting, which is viewed as favorable for Bitcoin. Bitcoin surged past $116,000, rising nearly 3% in a single day, following the U.S. government shutdown.
Key facts: Bitcoin trades near $116,200, rebounding from $109,000. A close above $117,500 may boost buying, while rejection could trigger profit-taking. Key support is at $113,000.
#Write2Earn #BinanceSquareFamily #Binance #BTC☀ #SUBROOFFICIAL
Disclaimer: This article is for informational purposes only and does not constitute financial advice. Always conduct your own research before making any investment decisions. Digital asset prices are subject to high market risk and price volatility. The value of your investment may go down or up, and you may not get back the amount invested. You are solely responsible for your investment decisions and Binance is not available for any losses you may incur. Past performance is not a reliable predictor of future performance. You should only invest in products you are familiar with and where you understand the risks. You should carefully consider your investment experience, financial situation, investment objectives and risk tolerance and consult an independent financial adviser prior to making any investment.

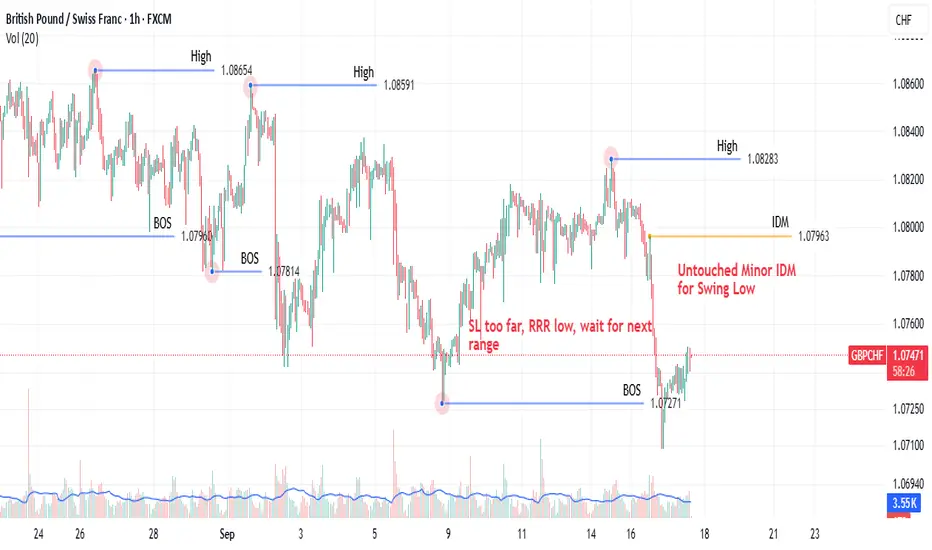
GBPCHF: A Lesson in Money Management Over Perfect SetupsCame across a textbook short setup on GBPCHF on the 1H recently. The price action was within a defined range, structure was bearish, and it was signaling a potential entry.
However, the trade was a pass. Why? The stop loss was simply too wide for my account size, creating a sub-optimal risk-to-reward ratio that fell below my personal 1:2 minimum rule.
This is a reminder that a good technical setup is only one part of the equation. The real discipline is in the money management—calculating the position size and risk before ever entering a trade. Sometimes, the best trade is the one you don't take.
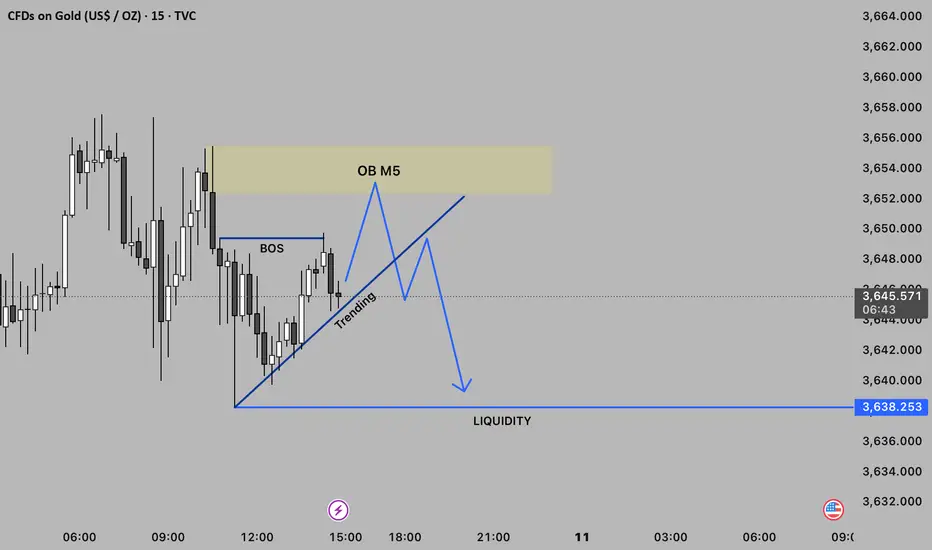
GOLD 5-Minute Smart Money Analysis (Bearish Setup)🔸 OB M5 (Order Block) – A supply zone around 3,652–3,654. This is where institutional sellers may re-enter. Price is expected to retrace here before dropping again.
💧 Liquidity Level marked at 3,638.253 – below recent lows. This is where many stop-loss orders are likely placed. Smart money often targets these zones to fuel bigger moves.
⚙️ Trade Setup Idea
🔄 Wait for price to retrace into OB M5 (yellow zone)
🔻 Look for bearish confirmation (e.g., bearish engulfing or market structure shift)
🎯 Target: Liquidity level at 3,638.253
🛑 Stop Loss: Just above the OB (low-risk entry)
✅ Current Bias: Bearish
As long as price stays below the OB zone, we favor shorts. Break above OB invalidates this setup
My Personal Forex Money Management System-The 4 Rules I Live ByLet's talk about something more important than any indicator: money management.
I don't care how good my strategy is; without a solid system to manage risk, I am just gambling. I've been documenting my own trading journey and wanted to share the exact four-pillar framework I use to protect my capital. This isn't theory—it's what I actually follow on every single trade.
The 4 Components of My System:
Risk Per Trade: The fixed % of my account I'm willing to lose on one idea is, for now, between 0.5% and 1%.
Total Open Risk: My cap on total exposure from all running trades, I prefer a max of 3% but giving myself the space to a maximum of 6%.
Risk-to-Reward Ratio: My non-negotiable minimum filter for every setup is the golden 1:2. To tell you the truth, now when I see a trade that forces me to 1:2, I get annoyed. The trading plan that I am working on now gives me greater opportunities. Therefore, 1:2 is really my bare minimum.
Dynamic Position Sizing: How I calculate my lot size based on my stop loss.
My goal is to stay in the game as much as possible and work on the accumulation effect. This system is so simple and practical that it keeps me disciplined and stops me from blowing up an account on one bad trade or a volatile news event.
I'm curious—what's the #1 rule in your money management system? Drop a comment below. Let's learn from each other.
Fartcoin / Usdt GATEIO:FARTCOINUSDT
"This chart’s heating up — price gonna cook soon 🚀🔥"
Be careful market is heating zone.
Disclaimer : Not Financial Advice.

$BTC Finally Historical Profit Done at $123K Price of ATH CRYPTOCAP:BTC tying to push price upward movement and if it's Breakout the $120K-$122K Price Level area than it could be reached $128K - $136K price level area.
I'm guess it will be happened. Always Pattern indicate and say price movement of Bitcoin. I was many Prediction of popular coin and i will succeed in 2025. I'm long term analyst of long term investment of Traders.
🚦From News: Bitcoin Holds Firm Above $115K Support as Charts Point Toward $150K Target
Bitcoin holds above $115K support with charts pointing to a potential $150K Elliott Wave target.
Hashrate hits all-time high as energy value model places BTC valuation 45% above current price.
U.S. policy shift enables 401(k) crypto access, opening a $9 trillion market for Bitcoin adoption.
Bitcoin has held firm above the $115,000 support and is now showing signs of a large move on the charts. Price patterns and rising adoption trends are aligning as BTC prepares for a possible rally. At the time of writing, BTC was trading at $116,620, showing steady upward momentum.
Technical Structure Points Toward Upside Continuation
According to an analysis prepared by Lau, Bitcoin has taken the $115,000 support and may be preparing to break its all-time high. On Binance, the BTC/USDT daily chart displays a breakout from resistance near $116,438.79. The price reached a new high before retracing to $111,917.37, where it found support.
BTC’s price structure continues to show higher lows, aligning with the Elliott Wave pattern that targets $150,000. Key support levels remain at $98,385.45 and $89,326.51, confirming a strong technical base. According to Daan Crypto Trades, Bitcoin is steadily rising toward the $120,000 zone, where a cluster of stop losses and liquidation points may fuel further upside.
The current bullish flag formation is still intact, supported by the 50-day SMA at $113,154. The RSI has moved to 54, indicating recovering momentum without being overbought. Analysts view a break above $117,350 as a key signal for another upward push.
On-Chain Metrics and Market Drivers Support Growth
Bitcoin’s energy value stands at $167,800, which is around 45% above the current market price. According to Charles Edwards, founder of Capriole Investments, “Hash rates are flying and Bitcoin Energy Value just hit $145K.”
This model links BTC’s value to miner energy inputs and network security. Bitcoin’s hashrate reached an all-time high of 1.031 ZH/s on August 4, based on data from Glassnode. Alongside this, adoption is growing in the U.S. market.
President Trump’s policy allowing 401(k) crypto inclusion has opened a $9 trillion market. Crypto-linked equities and ETFs have also seen strong inflows, supporting long-term price action.
#highlights #everyone #premium #BinanceSquareFamily #Binance #BTC☀ #SUBROOFFICIAL
Disclaimer: This article is for informational purposes only and does not constitute financial advice. Always conduct your own research before making any investment decisions. Digital asset prices are subject to high market risk and price volatility. The value of your investment may go down or up, and you may not get back the amount invested. You are solely responsible for your investment decisions and Binance is not available for any losses you may incur. Past performance is not a reliable predictor of future performance. You should only invest in products you are familiar with and where you understand the risks. You should carefully consider your investment experience, financial situation, investment objectives and risk tolerance and consult an independent financial adviser prior to making any investment.

B3/USDT BREAKOUT ALERTB3 is showing strong bullish momentum with a confirmed breakout above resistance, signaling a potential trend shift.
📈 Breakout Level:
$0.00388 – Key resistance flipped into support on high volume ✅
🔑 Key Levels to Watch:
Immediate Support: $0.00388(former resistance)
Next Resistance: $0.0050 – psychological & technical barrier
📊 Volume Surge:
+150% volume increase = strong buyer interest
RSI approaching overbought – watch for consolidation or retest
🔁 Retest Zone:
If price pulls back, look for a bounce around $0.003187 to confirm continuation
🚀 Bias: Bullish above $0.0033
Keep an eye on market sentiment and BTC correlation
BINANCE:B3USDT.P

Protect Capital First, Trade SecondIn the world of trading, mastering technical analysis or finding winning strategies is only part of the equation. One of the most overlooked but essential skills is money management. Even the best trading strategy can fail without a solid risk management plan.
Here’s a simple but powerful money management framework that helps you stay disciplined, protect your capital, and survive long enough to grow.
✅1. Risk Only 2% Per Trade
The 2% rule means you risk no more than 2% of your total capital on a single trade.
-Example: If your trading account has $10,000, your maximum loss per trade should not exceed $200.
-This protects you from large losses and gives you enough room to survive a losing streak without major damage.
A disciplined approach to risk keeps your emotions under control and prevents you from blowing your account.
✅2. Limit to 5 Trades at a Time
Keeping your number of open trades under control is essential to avoid overexposure and panic management.
-A maximum of 5 open trades allows you to monitor each position carefully.
-It also keeps your total account risk within acceptable limits (2% × 5 trades = 10% total exposure).
-This rule encourages you to be selective, focusing only on the highest quality setups.
Less is more. Focus on better trades, not more trades.
✅3. Use Minimum 1:2 or 1:3 Risk-Reward Ratio
Every trade must be worth the risk. The Risk-Reward Ratio (RRR) defines how much you stand to gain compared to how much you’re willing to lose.
-Minimum RRR: 1:2 or 1:3
Risk $100 to make $200 or $300
-This allows you to be profitable even with a win rate below 50%.
Example:
If you take 10 trades risking $100 per trade:
4 wins at $300 = $1,200
6 losses at $100 = $600
→ Net profit = $600, even with only 40% accuracy.
A poor RRR forces you to win frequently just to break even. A strong RRR gives you room for error and long-term consistency.
✅4. Stop and Review After 30% Drawdown
Drawdowns are a part of trading, but a 30% drawdown from your account's peak is a red alert.
When you hit this level:
-Stop trading immediately.
-Conduct a full review of your past trades:
-Were your losses due to poor strategy or poor execution?
-Did you follow your stop-loss and risk rules?
-Were there changes in the market that invalidated your setups?
You must identify the problem before you continue trading. Without review, you risk repeating the same mistakes and losing more.
This is not failure; it’s a checkpoint to reset and rebuild your edge.
Final Thoughts: Survive First, Thrive Later
In trading, capital protection is the first priority. Profits come after you've mastered control over risk. No trader wins all the time, but the ones who respect risk management survive the longest.
Here’s your survival framework:
📉 Risk max 2% per trade
🧠 Limit to 5 trades
⚖️ Maintain minimum 1:2 or 1:3 RRR
🛑 Pause and review after 30% drawdown
🧘 Avoid revenge trading and burnout
Follow these principles and you won't just trade, you'll trade with discipline, confidence, and longevity.
Cheers
Hexa
$BNB Chart Showing Bullish Flag Pattern and Price Will Hit +$750CRYPTOCAP:BNB Previously Chart showing Bullish Inverse Head and Shoulder Pattern and Gain Profit of Range. It's a Reversal Pattern .
Now Chart Showing a Bullish Flag Pattern and it's Continuation Pattern. Time to Bullish for BNB Coin for FOMC 10th July Thursday 2025.
The upsloping 20-day EMA and the RSI just above the midpoint indicate a slight edge to the bulls. If the $665 resistance falls, the BNBUSD pair could rise to $675 and then to $698.
Sellers are likely to pose a solid challenge at $698 because a break above it could propel the pair to $732. I'm guess BNB Price Breakout of ATH and $888 Mystery will Happen.
This optimistic view will be negated in the near term if the price turns down and breaks below the moving averages. The pair may then drop to $636.
NEWSBTC: BNB Price Gears Up for Upside Break — Will Bulls Deliver?
BNB price is gaining pace above the $650 support zone. The price is now showing positive signs and might aim for more gains in the near term.
BNB price is attempting to recover from the $620 support zone.
The price is now trading above $655 and the 100-hourly simple moving average.
There is a key contracting triangle forming with resistance at $662 on the hourly chart of the BNB/USD pair (data source from Binance).
The pair must stay above the $655 level to start another increase in the near term.
BNB Price Eyes More Gains
After forming a base above the $620 level, BNB price started a fresh increase. There was a move above the $645 and $650 resistance levels, like Ethereum and Bitcoin.
The price even surged above the $660 level. A high was formed at $666 before there was a downside correction. The price dipped below the 50% Fib retracement level of the upward move from the $650 swing low to the $666 swing high.
The price is now trading above $655 and the 100-hourly simple moving average. On the upside, the price could face resistance near the $662 level. There is also a key contracting triangle forming with resistance at $662 on the hourly chart of the BNB/USD pair.
The next resistance sits near the $665 level. A clear move above the $665 zone could send the price higher. In the stated case, BNB price could test $672. A close above the $672 resistance might set the pace for a larger move toward the $680 resistance. Any more gains might call for a test of the $700 level in the near term.
Another Decline? If BNB fails to clear the $662 resistance, it could start another decline.
Initial support on the downside is near the $655 level and the 61.8% Fib retracement level of the upward move from the $650 swing low to the $666 swing high. The next major support is near the $650 level.
The main support sits at $644. If there is a downside break below the $644 support, the price could drop toward the $632 support. Any more losses could initiate a larger decline toward the $620 level.
Technical Indicators
Hourly MACD – The MACD for BNB/USD is gaining pace in the bullish zone.
Hourly RSI (Relative Strength Index) – The RSI for BNB/USD is currently above the 50 level.
Major Support Levels – $655 and $650.
Major Resistance Levels – $662 and $665.
#Write2Earn #BinanceSquareFamily #BinanceTurns8 #BNB #SUBROOFFICIAL
Disclaimer: This article is for informational purposes only and does not constitute financial advice. Always conduct your own research before making any investment decisions. Digital asset prices are subject to high market risk and price volatility. The value of your investment may go down or up, and you may not get back the amount invested. You are solely responsible for your investment decisions and Binance is not available for any losses you may incur. Past performance is not a reliable predictor of future performance. You should only invest in products you are familiar with and where you understand the risks. You should carefully consider your investment experience, financial situation, investment objectives and risk tolerance and consult an independent financial adviser prior to making any investment.

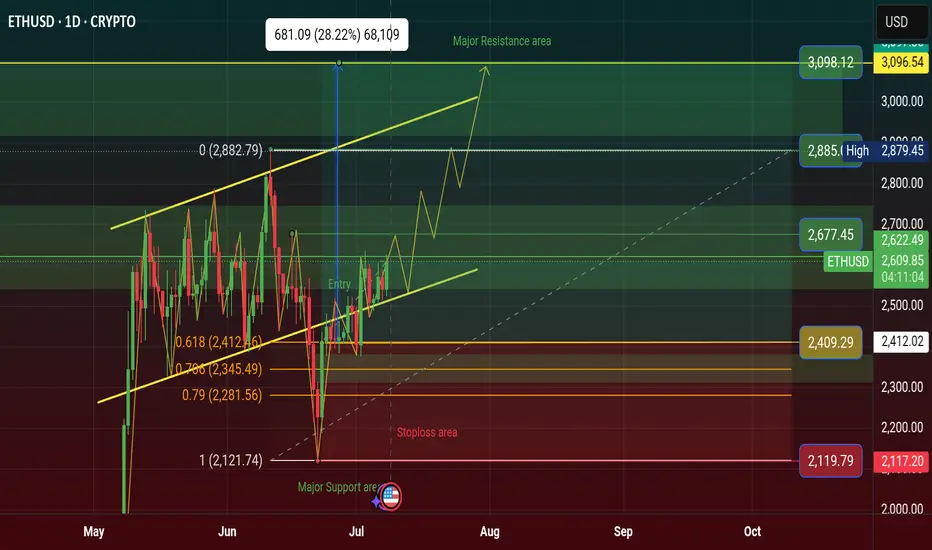
$ETH Price Will Rising $3098 in Q3, Bullish Flag Inverse AngleCRYPTOCAP:ETH price will Rising $3098 in Q3 in 2025, Price Showing a Bullish Flag Inverse Angle. it's a Reversal Pattern and Manipulation Price. See more on Chart.
Crypto News: An Ethereum address holding 900 ETH started moving coins Monday after spending nearly 10 years dormant.
The holder received these genesis coins in 2015 when ETH traded below 50 cents.
These pre-mined tokens were distributed to early Ethereum contributors before mining began.
Their current value reaches 2.2 million with ETH trading around 2,529 per coin.
This represents potential gains exceeding 5,000% from the original sub-dollar entry price.
The move follows similar whale activity, including a 27.6 million Ethereum sale in April.
Last week saw a Bitcoin whale move 8 billion after 14 years of hodling.
ETH remains 48% below its 2021 all-time high of 4,878 despite recent stability.
The holder technically isn't a whale, which requires a minimum of 10,000 ETH at current prices.
#Write2Earn #BinanceSquareFamily #ETH #SUBROOFFICIAL
Disclaimer: This article is for informational purposes only and does not constitute financial advice. Always conduct your own research before making any investment decisions. Digital asset prices are subject to high market risk and price volatility. The value of your investment may go down or up, and you may not get back the amount invested.
$SOL Price Will Hit $228 Q3, Inverse Head and Shoulder Pattern✨ CRYPTOCAP:SOL Price Will Hit $228 in Q3 of 2025 | Solana Chart Showing Inverse Head and Shoulder Pattern. It's a Bullish Reversal Pattern.
‣ Solana price is hovering below key resistance; a breakout above $159 and it's going to $228.
ETF Buzz Grows, but Price Action Still Caught in Limbo Here is why this could be the catalyst that sends price to all time highs Do THIS before that happens.
‣ Solana ETF Buzz Grows, but Price Action Still Caught in Limbo
🔸BlockNews The SEC has asked SOL ETF applicants to revise and refile submissions by end of July, fueling speculation of an ETF approval before October. Solana’s daily active addresses just hit a record 15.39 million, pointing to rising demand and user engagement on the network.
#Write2Earn #NFPWatch #BinanceSquareFamily #TrumpTariffs #SUBROOFFICIAL
Disclaimer: This article is for informational purposes only and does not constitute financial advice. Always conduct your own research before making any investment decisions. Digital asset prices are subject to high market risk and price volatility.

$LOT Price Showing Symmetrical Triangle Pattern & Breakout aboveASX:LOT is a League of Traders Trading Competition Platform. LOT is an Native token of this platform.
Every Trading Player Have LOT point and they convert to LOT token and get on there wallet. Who Join LOT Trading League for LOT point? The main competition is top level and get free price.
💡 TOKEN OVERVIEW ( ASX:LOT )
Market capitalization: 3.89 M USD
Fully diluted market cap : 25.90 M USD
Trading volume 24h: 2.89 M USD
All time high: 0.044869 USD
Circulating supply: 150.00 M
Max supply: 1.00 B
Total supply: 1.00 B
A new Native token Release on Binance Alpha and when it's release on Binance Coin than we will see more pumping this Native Token Price.
ASX:LOT price now at $0.026186 and this year 2025 I'm Prediction the price will be happened $0.45-$0.75 hit. If Biggest Tournament will start this year on this Platform. Than Possible to worldwide Tournament make more Pumping price. Because of the Big investor will become investment on this LOT native Token.
We have to decisions long-term investment this coin. The main thing is that some Coin will be scammed. But League of Traders Platform is the Legit of Cross Chain Trading Competition.
The Crypto Scammer will not Permission listed there token on the Top Exchange of Binance Market. #SUBROOFFICIAL
Disclaimer: This article is for informational purposes only and does not constitute financial advice. Always conduct your own research before making any investment decisions. Digital asset prices are subject to high market risk and price volatility. The value of your investment may go down or up, and you may not get back the amount invested. You are solely responsible for your investment decisions and Binance is not available for any losses you may incur. Past performance is not a reliable predictor of future performance. You should only invest in products you are familiar with and where you understand the risks. You should carefully consider your investment experience, financial situation, investment objectives and risk tolerance and consult an independent financial adviser prior to making any investment.

$BTC Price Showing a Bullish Flag Pattern & Breakout see chart..CRYPTOCAP:BTC Price Breakout of Bullish Flag Pattern. I'm guess it's going to the next Price Zone $115K and if Breakout thank going $122K price zone.
I was telling some coins that was saying Multiple Profit and now coins are driving on the way. There are coin is ETH, BNB, XRP, SOL, TRX, TON, SUI, ADA, ICP, ARB, XLM.
Ric Edelman Urges Up to 40% Crypto Allocation, Predicts Bitcoin Surge to $500K
Top advisor Ric Edelman recommends investors allocate up to 40% to crypto, forecasting Bitcoin could reach $500K with rising institutional demand.
Ric Edelman advises investors to allocate 10% to 40% of their portfolios to crypto, based on their risk tolerance.
Edelman predicts Bitcoin could reach $500,000 if just 1% of global assets shift into the cryptocurrency sector. His endorsement is viewed as a major TradFi signal, given his $300 billion asset management influence in the advisory industry.
Ric Edelman, the founder of Edelman Financial Engines and DACFP, has recommended investors shift a significant portion of their portfolio to cryptocurrency. In a recent whitepaper, Edelman advised allocating between 10% and 40% to crypto, depending on individual risk tolerance.
This guidance marks a break from the conventional 60/40 stock-to-bond portfolio model, which he believes is no longer practical in a rapidly advancing economic environment.
According to Edelman, conservative investors should hold 10% in crypto, moderate investors 25%, and aggressive investors 40%. He cited technological advancements and increased life expectancy as reasons to move away from traditional investment formulas. He emphasized that ignoring crypto means betting against an asset class that has outperformed all others over the past 15 years.
Bitcoin Price Could Hit $500,000 with Minimal Asset Shift
Edelman also presented a bullish projection for Bitcoin, suggesting it could reach $500,000. He explained that a 1% allocation of the $750 trillion in global assets toward Bitcoin would inject $7.5 trillion into the market. Based on current valuations, this inflow could significantly drive the asset’s price. He underlined this estimate as simple arithmetic based on supply and demand trends.
Edelman pointed to growing institutional interest and policy changes as key drivers for crypto’s rise. He highlighted that Tether, a major stablecoin, reported $13 billion in profits last year, surpassing companies like McDonald’s and Ford. He also noted that a pro-crypto political climate, especially following Donald Trump’s reelection, is setting favorable conditions for digital assets.
Disclaimer: This article is for informational purposes only and does not constitute financial advice. Always conduct your own research before making any investment decisions. Digital asset prices are subject to high market risk and price volatility. The value of your investment may go down or up, and you may not get back the amount invested. You are solely responsible for your investment decisions and Binance is not available for any losses you may incur. Past performance is not a reliable predictor of future performance. You should only invest in products you are familiar with and where you understand the risks. You should carefully consider your investment experience, financial situation, investment objectives and risk tolerance and consult an independent financial adviser prior to making any investment.

BTCUSD – Major Decision Point at The Edge📍 By: MJTrading |||
Bitcoin has rallied sharply from ~$98K and is now testing a critical confluence zone — the top of the descending channel and a strong supply area, known as "The Edge."
EMAs are turning up, supporting bullish momentum
⏳ What’s Next?
At this stage, two scenarios emerge:
⚠️ This is a make-or-break zone:
🟩 Breakout above the channel signals trend reversal → next resistance: $111K
🟨 Rejection leads to a move back to the $103K or $100K levels
This setup offers a high-RR opportunity for both breakout traders and mean reversion players.
🧠 Trade the reaction at the edge, not the prediction.
Thanks for your attention...
Share your thoughts...
—
#BTCUSD #Bitcoin #CryptoTrading #TheEdge #BreakoutOrBounce #CryptoSetup #DescendingChannel #SmartMoney #TechnicalAnalysis #PriceAction #SwingTrade #EMA #RiskReward #MJTrading #4hChart #TrendDecision #SupplyZone

Leg Based Continuation Possible Play📈 USD/JPY – 15M Chart (Scalping to Intraday Play)
🕒 June 17, 2025 – Lower Time Frame Setup
Bias: Short-term Bullish Continuation
Structure: Leg-Based Impulse-Pullback-Impulse Model
🔹 Market Structure Insight:
Price recently completed a strong impulsive move (LEG 1) on increasing volume.
After a shallow correction into dynamic support (EMA 60), price is attempting a LEG 2 continuation.
EMAs (15 & 60) have bullish alignment and acted as dynamic support.
✅ Buy #1 – Market Execution
Entry: 144.91 (current or recent execution)
SL: 144.38
TP: 145.25
R:R ≈ 1
🧠 Entry based on continuation after bullish flag breakout
✅ Price held higher low structure + EMA confluence
✅ Buy Limit #2 – Pullback Opportunity
Entry: 144.59 (highlighted zone between EMAs)
SL: 144.37
TP: 145.25
R:R ≈ 3.0
🧠 Designed to catch a retest into the mid-range and volume base
➕ Risk minimized, reward optimized
➕ Matches possible HL (higher low) setup if price dips before pushing
⚠️ Risk Management Notes:
Overlap with prior resistance zone just above TP (145.20–145.40): partial TP or trail advised.
Invalidated if price closes below 144.30 on strong volume (breaks structure).
If LEG 2 matches or exceeds LEG 1 in strength, extended targets above 145.50 possible.

Let the market pull back toward the marked FVG.🚨 EUR/USD Traders – Eyes on This Setup! 💹
The market has been respecting a trendline over the past few days, bouncing off support and climbing steadily. 🧗♂️ While doing so, it’s also been tapping into Fair Value Gaps (FVGs)—a clear sign of smart money interest. 📊
🔥 And guess what? We’ve just seen a breakout above the trendline resistance! This could be the beginning of a strong bullish move. BUT… patience is key! 🕰️
📉 Let the market pull back toward the marked FVG zone. If it does, that could give us a golden buy opportunity with high potential upside! 🚀
🧠 Always remember: Do Your Own Research (DYOR)
📛 Not Financial Advice – Trade Smart!
