BTC’s OCD means EMA by NYEWe all know the market has a little OCD. Certain levels it just has to touch before it’ll allow the next move.
On the monthly BTC chart, that level looks like the 9 EMA — and it’s lining up as a likely “must-tag” into month’s end.
Here’s the key observation:
• The monthly 9 EMA has been sliding down ~$2k–$3k per month.
• It’s already dropped from just over $100k last month to a little over ~$98k this month.
• Meanwhile, this month’s high / top wick area is ~94,500.
So right now there’s a gap: 9 EMA above, price wick below.
For the 9 EMA to “touch” the top of this month’s candle (~94,500), one of two things has to happen:
1. EMA drops to price (hard), or
2. Price rises to EMA (much easier).
To get the EMA to drop several thousand more this month, BTC would need a major dump (think the kind of move that drags the average down hard — i.e., ugly). That’s possible, but it’s the less probable path compared to a tag from price.
I built a simple little calculator/tool on my chart that estimates what price would need to do for an EMA tag — and based on that, the cleaner path is BTC pushing higher into month-end to meet the 9 EMA, then potentially setting up the next move (including a possible January fade).
We’re already in the final week of the month, and the tape is starting to look like that “EMA magnet” move could be underway.
Bias: Looking for a long into the 9 EMA tag into year-end — with eyes open for a potential January reversal setup after the touch.
Merry Christmas — consider it my gift to the chart watchers 🎁
Monthlychart

Massive Upside Ahead: Top 5 Stocks With Big 2026 Potential📌 Top 5 Stocks for 2026 (Monthly Chart Setups)
I just published a new breakdown focused on multi-month / multi-year moves — not short-term noise. Using the monthly timeframe, I walk through structure + momentum to find the next potential 2x–10x runners.
Names covered:
• NYSE:ZETA – cup & handle developing, holding key MAs + volume shelf, momentum turning
• NYSE:ONTO – monthly reversal structure + bullish momentum setup building
• NYSE:UNH – “left for dead” reset → reclaim + room back to key MAs
• NASDAQ:ONDS – rounded bottom breakout structure, momentum box intact, multi-target roadmap
• NASDAQ:ADBE – extreme oversold reset, bullish reversal potential from long-term support
Question for you:
Which one has the cleanest monthly setup right now — and what ticker should I chart next?

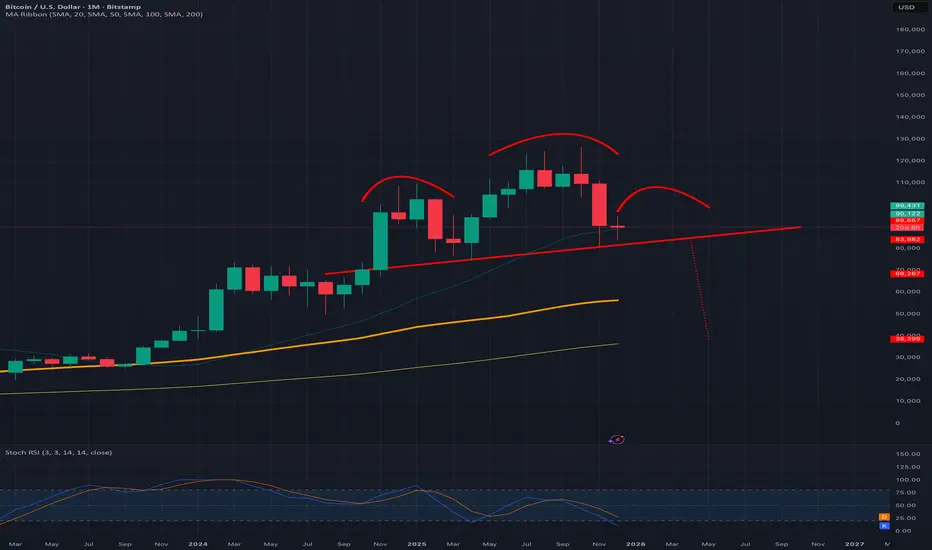
Absolute worst case scenario for bitcoin if top is actually in Very few reasons in my opinion to believe the top is currently in but there are a couple worth considering, the fact that it has run the normal 4 year cycle, and that a candle has gotten rejected after a retest of the the top trendline of the channels idea i have been posting since 2023. So even though there still far more reasons currently why the top of the bull market isnt in, I think it is always wise to try to look at all possibilities and angles of the chessboard here so on this chart idea, I am approaching it from the perspective of if the top of the bull market is actually already in even though for now I think that is a lower probability. If indeed the top is in though, then that would allow this head and shoulders pattern I have shown here to have a good liklihood of playing out. If it were to actually validate this head and shoulders pattern its breakdown target would be 38k which lines up perfectly with the monthly 100ma. So although, I personally feel like the bullmarket top being in is currently a low probability, if somehow it is then i think 38k would likely be the next bear market bottom with the monthly 100ma once again being the bear market bottom support. I still think the top isn’t in and we have better odds of entering a supercycle but I must also keep my mind open to a bearish possibility like this one to make sure I am properly prepared for whatever outcome may end up unfolding and am ready to take advantage no matter which way the market heads. *not financial advice*
GULSHAN POLYOLS LTD - Monthly Chart📊 GULSHAN POLYOLS LTD – Monthly Falling Channel After a Strong Vertical Rally 📉➡️🚀
📅 Updated: Dec 05, 2025 | ⏱️ Timeframe: 1M
CMP: ₹139.76 (+0.70%)
Ticker: NSE:GULPOLY
🔍 Technical Overview
Gulshan Polyols is currently trading inside a multi-year falling channel after a massive vertical rally seen between 2020–2021.
The stock has been consolidating in a controlled corrective structure — a descending channel / bullish flag pattern — which often forms as a continuation pattern in strong momentum stocks.
Current price action suggests:
Price is near the lower channel support
A potential reversal zone if buyers step in
Selling pressure weakening compared to earlier legs
Monthly candles forming long wicks near support, indicating demand absorption
If the lower channel holds, the structure sets up for a medium- to long-term breakout opportunity.
🎯 Chart Summary
GULPOLY remains in a controlled correction after a parabolic rally.
The monthly falling channel suggests a potential flag pattern, which is bullish in nature if the breakout occurs above the upper boundary.
A decisive close above ₹185–₹200 could trigger:
🎯 Targets:
₹245 (channel breakout target)
₹300+ (measured move of previous rally continuation)
If support fails:
Watch ₹120 and ₹105 as deeper demand zones.
⚠️ Disclaimer
This analysis is for educational and chart-study purposes only. Not investment advice.

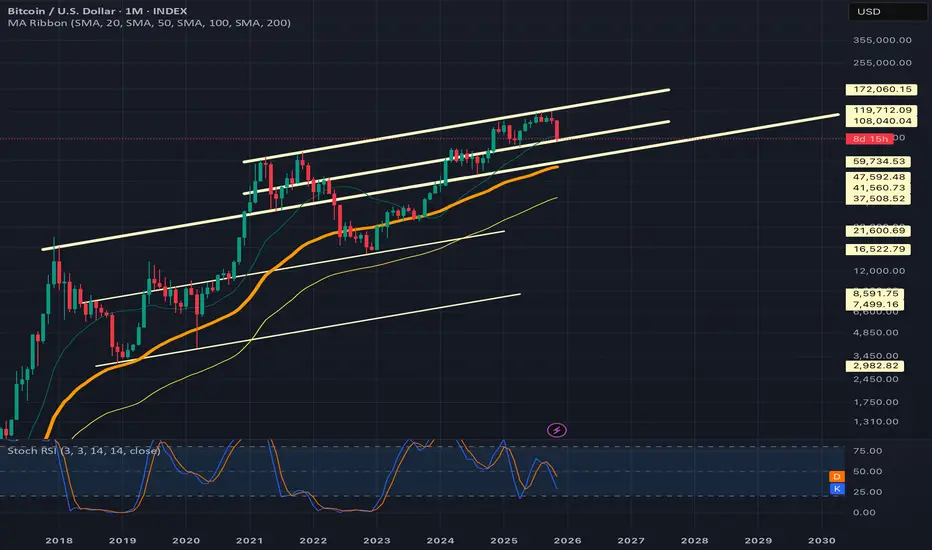
A new look at previous logarithmic channelWith the trendlines of this channel slightly shifted we can see that it is possible that priceaction has already tested the top trendline of the channel. However in my previous version of this idea which I will try to post below it hasn’t connected with the top trendline yet. Would make more sense for it to be having the rejection it is having if it has already retested this top trendline though so I decided to post this version of the chart too so I can keep an eye on both. Even if somehow this does signal some sort of top it looks like we have very strong support on the next trendline just below the current one which should have the monthly 50ma double reinforcing its support in the very near future. SOo in that case that 50k zone there should hold strong support,but hopefully this is So another correction and not the top in which case the current trendline we have just retested will hold support. *not financial advice*
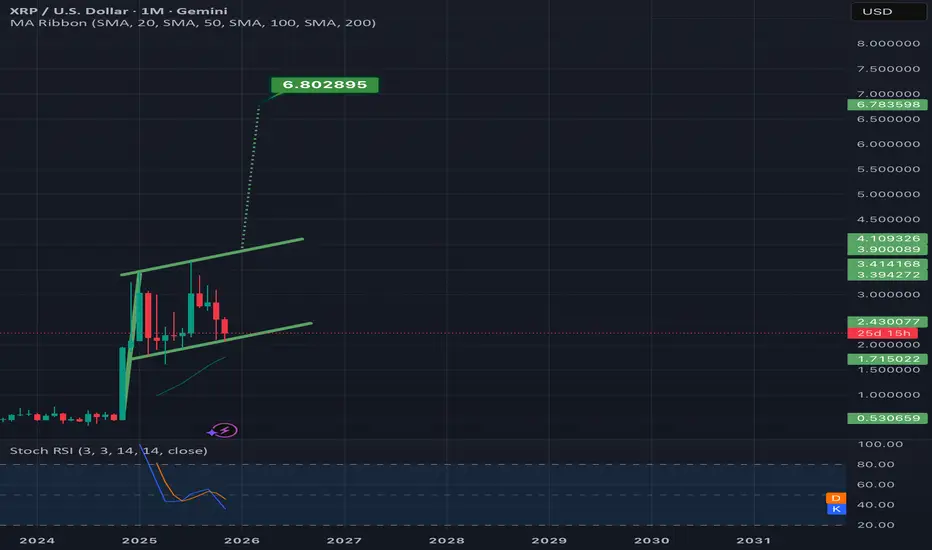
Bullflag on xrp has a target of $6.80 if it validates n DecemberWill be a very good sign if it finds a way to hold this bottom trendline as support.Even if it does hold support a wick below it is still very possible. *not financial advice*
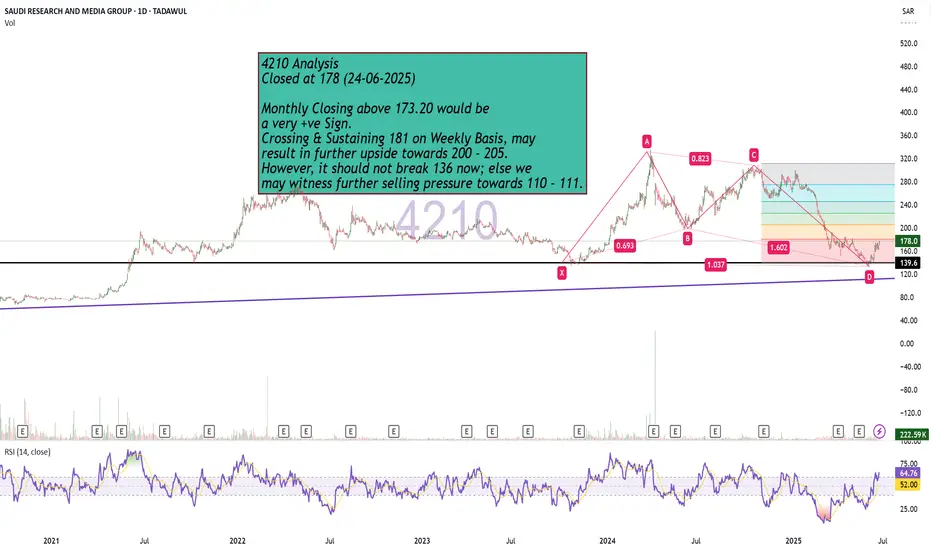
Bullish Monthly Candle Expected?4210 Analysis
Closed at 178 (24-06-2025)
Monthly Closing above 173.20 would be
a very +ve Sign.
Crossing & Sustaining 181 on Weekly Basis, may
result in further upside towards 200 - 205.
However, it should not break 136 now; else we
may witness further selling pressure towards 110 - 111.
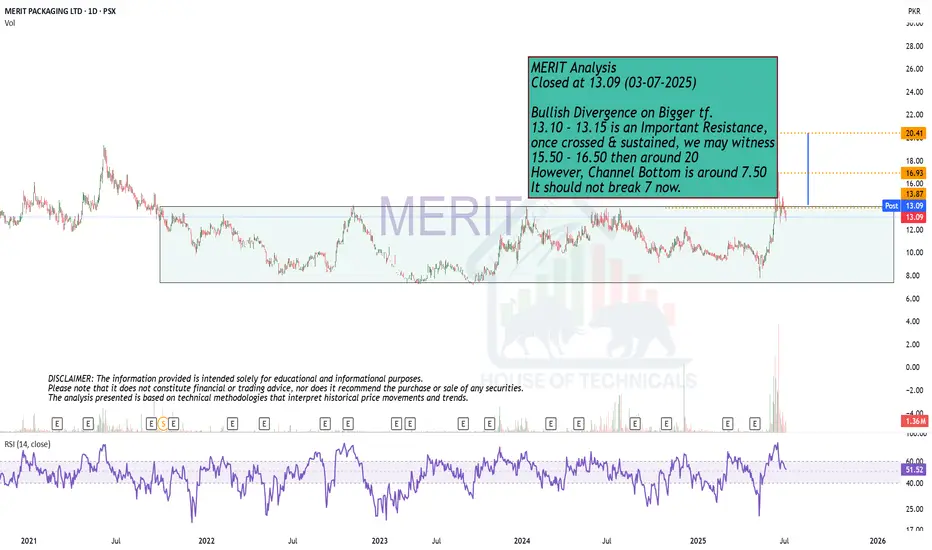
Bullish Divergence on Bigger tf.MERIT Analysis
Closed at 13.09 (03-07-2025)
Bullish Divergence on Bigger tf.
13.10 - 13.15 is an Important Resistance,
once crossed & sustained, we may witness
15.50 - 16.50 then around 20
However, Channel Bottom is around 7.50
It should not break 7 now.
XAUUSD Monthly Technical OutlookMarket Structure Overview:
• The chart reveals consistent Breaks of Structure (BOS) to the upside, confirming a strong bullish market trend.
• Price has successfully reclaimed and retested the strong resistance zone (~3390–3400), which now acts as new support.
• A series of higher highs and higher lows show clear bullish intent, supported by sustained bullish momentum after each correction.
⸻
📈 Volume & Price Action:
• The Volume Profile (VRVP) on the left shows strong historical accumulation near the current breakout zone.
• After the breakout from resistance, the price retested this zone—validating it as support—and is expected to continue its bullish leg toward $3,500, the next psychological and technical target.
⸻
📍 Key Levels:
• Support Zone: $3,375 – $3,390 (previous resistance turned support)
• Immediate Resistance: $3,425
• Target Level: $3,500 (Monthly High Projection)
⸻
📘 Educational Note:
• This setup aligns with classic market structure theory: BOS + Retest + Continuation.
• The pullback into the breakout zone is a textbook bullish continuation signal often used in institutional trading strategies.
• Traders watching this pattern should combine it with confirmation entries such as bullish engulfing candles, FVGs, or order block rejections for safer entries.
⸻
🎯 Projection:
• As long as the price holds above $3,375, the bullish scenario toward $3,500 remains valid.
• Expect possible consolidation or minor pullbacks before continuation.
⸻
📌 Disclaimer:
This analysis is for educational purposes only and does not constitute financial advice. Always do your own research before entering the market.

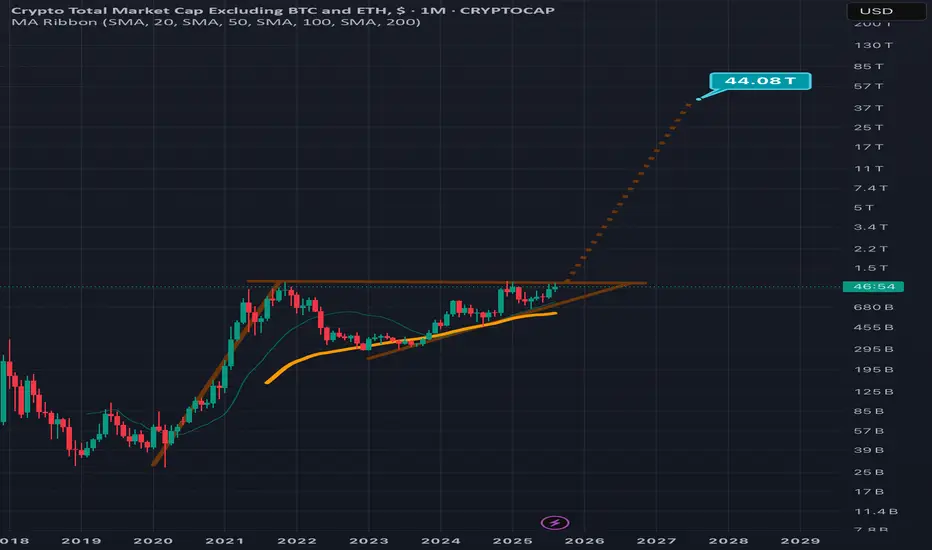
Monthly logarithmic chart on total3 suggests it could 44x!On the total3 chart we can see the majority of altcoins (excluding ethereum) have been consolidating for quite a long time in this ascending triangle which s also a bullish pennant. These patterns break to the upside far more than they break to the downside and this current one is nearing its apex. If we clued the pole of the pennant to calculate the Bullish breakout target/measured move, we can see that the target is 44 x higher than the current price. Of course this beng a logarithmic scale pattern, it may not ht its full 100% breakout target for multiple years even, but the angle of the measured move line does suggest we could see it reach such heights by 2028 and possibly even before it. *not financial advice*
Monthly chart bullflag has a breakout target around 115kIhave arbitrarily placed the measured move line for the bullflag breakout in the month of October but there’s always a chance it stays in the flag longer than that, in which case the measured move line would get moved over to the right and slightly lower each time it does. If it breaks up by october and validates that breakout the measured move target will be around 115k. *not financial advice*

Apple Is Climbing the Fibonacci Channel Ladder – Step 5 Ahead?On the monthly chart, Apple (AAPL) is steadily moving within a well-defined ascending Fibonacci channel, like climbing a ladder — step by step.
The price is currently testing Step 4 , a zone that has acted as a strong resistance barrier.
Despite the pressure here, the structure still appears bullish, and even a minor pullback might simply be a pause before the next move.
If momentum picks up, we could soon see a breakout toward the next step — targeting 234 at Step 5.
The trend remains technically intact unless the channel is broken, and the overall formation still leans toward continuation.

August 2025 Monthly ScenariosChartingMyLosses | Monthly Analysis | 1M TF
Speculative structure meets macro zones
🔵 Scenario 1: Direct continuation to the highs (Blue Path)
Price holds above PH June and pushes toward the 0.78 retracement of July, targeting 121,399 USD. This would be a classic bullish continuation fueled by residual momentum and liquidity above recent highs.
🟢 Scenario 2: Support retest before continuation (Green Path)
A sweep of the 109,893–103,009 USD zone (June’s fib cluster and previous breakout range) leads to a rebound. This would validate the zone as a new macro support and could signal institutional reaccumulation before an end-of-month push to the highs.
🔴 Scenario 3: Deep retracement into OB + FVG (Red Path)
Bears attack, dragging price down to the 98,459–96,000 USD range, tapping into a Daily Order Block + FVG inefficiency. A full liquidity sweep in this zone could set up a powerful reversal toward the new max, but would require market-wide risk-on behavior to confirm.
🧠 Speculative Note
In just one month, BTC can traverse thousands of dollars. The real question isn’t "will it drop or pump?" but rather "where is price most efficient to move next?". Keep an eye on volume, reactions at fib levels, and especially how the market behaves near the prior June low (PL).

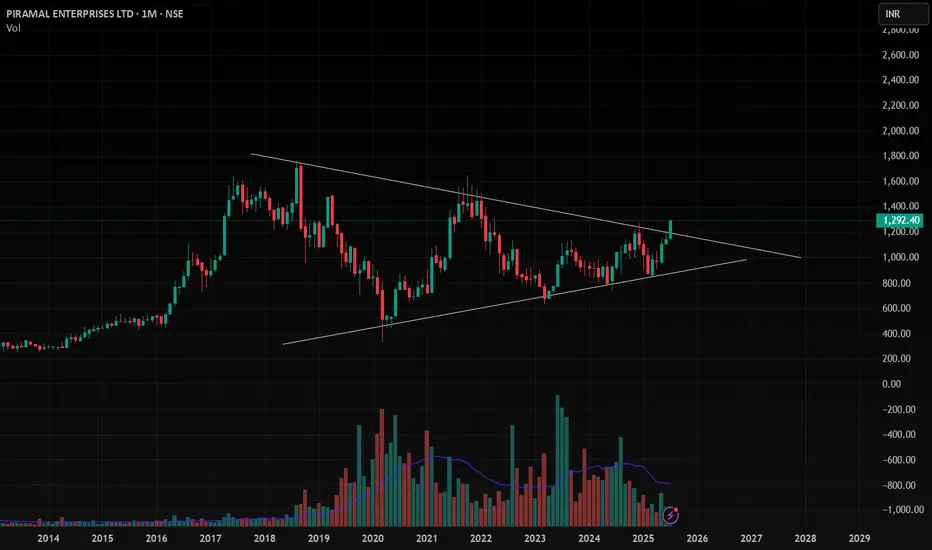
PEL , 1M , BullishThe Triangle Pattern is Breaking Out in Monthly Time Wait for Strong and Perfect close in Weekly Time and Enter after Confirmation .
Take Risk According to your capital
Follow for more ideas like this

Monthly Closing above 63.50 ..?IBLHL Analysis
Closed at 63.49 (26-06-2025)
Monthly Closing above 63.50 is important
to move price further up.
Upside targets can be 79 - 80 initially.
On the flip side, it should not break 49 - 50,
otherwise we may witness further down side.

#FORTIS Today this stock brooked ATH level with strong volume. Through It can be predicted here that this will be a good investment option for the short term and long term.
CMP - 790
Key level:-
1) triangle pattern breakout
2) high volume
3) stock sustaining previous high
4) retest like formation

Macro Analysis (GBP/USD)Likely aiming for 1.42491 and 1.43886 as potential targets.
There's also a possibility of a bounce near 1.17610 in the future.
The yearly timeframe failed at 1.05200 back in 2022, suggesting we're sitting at the bottom of the range.
Quick analysis — Despite all the social and political controversy in the UK, the macro chart clearly shows a long-term downtrend. Until price closes strongly above 1.43886, that's when this pair might have a chance vs the US dollar. (1.72062 for some stronger confidence lol)
That said, the past five monthly candles have all been green, showing some momentum and short to mid-term strength. Could easily just be a pullback before continuing lower, breaking below 1.05200, which honestly, wouldn’t surprise me.
But hey, let’s keep it to the charts. WOMEN lie, men lie, but numbers don’t. And this is all just numbers printed in a chart.

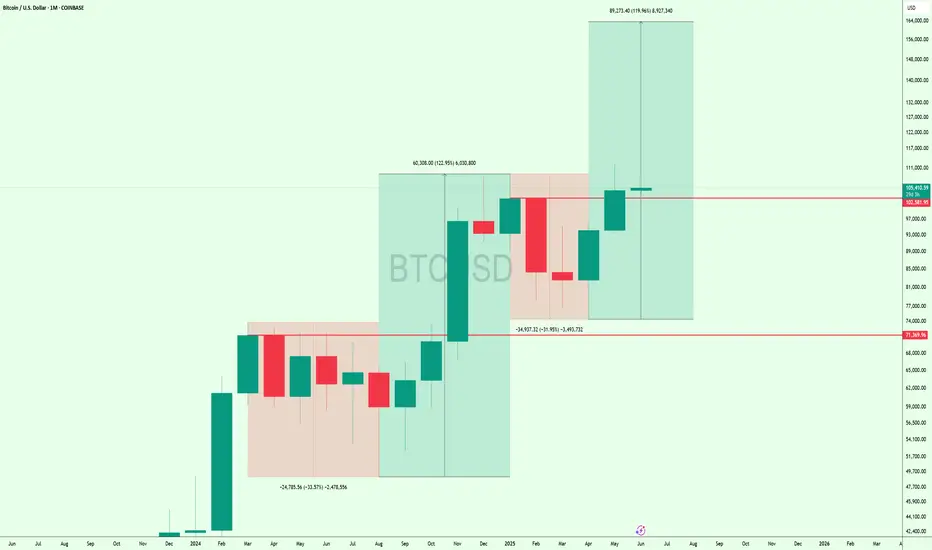
This Is Not a Top – It’s the Beginning of the Mega Bull RunThis is the monthly #Bitcoin chart, and honestly, how can anyone be bearish here?
CRYPTOCAP:BTC just bounced after a -31.95% correction and is now holding strong above the $101K breakout zone.
Last time, a similar setup led to a 122% pump... and this time, we could be looking at a move toward $160K that's 120% upside from here.
We’re likely entering the biggest bull market ever.
Get ready. 🚀
Beautiful Monthly Closing.
Closed at 122 (29-05-2025)
Beautiful Monthly Closing.
However, 125 - 126 is an Important
Resistance that needs to Sustain for
further upside.
Entry can be taken with a Stoploss below
117; targeting 125 - 126 initially.

SPX week & month review 5/30/25Intrigued by today as we closed the month and week. The charts appear bullish until something changes that. Key points I noticed...
*Monthly morning star pattern
*RSI above 50 on month and week chart
*MACD over zero line and signal up on month and week chart
*Key levels holding up (21 ema, FVGs)
We are still in volatile times and narratives are being thrown all over the place. Do you see what I see? Enjoy your weekend.

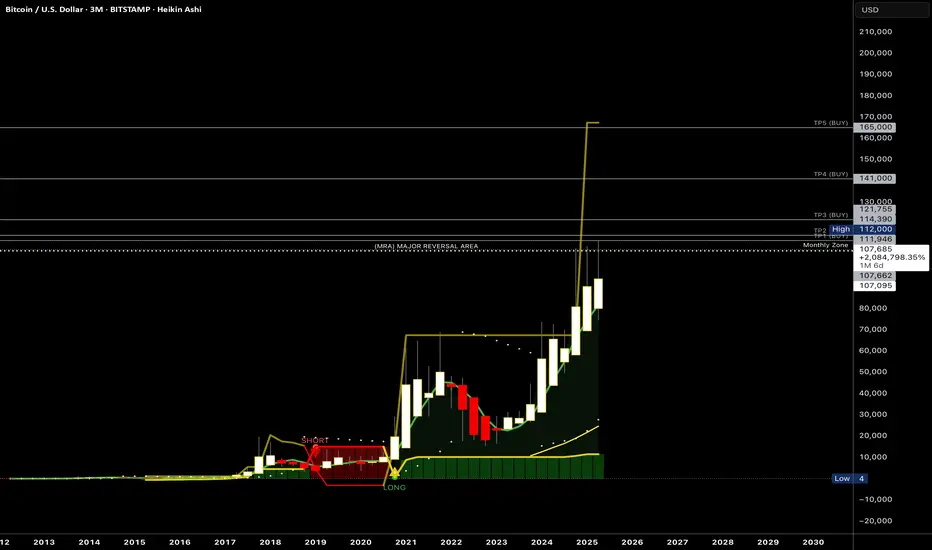
BTC Market Analysis for Q2BTC Market Analysis for Q2 - As we end the month the market tends to rescind. Pay close attention to the monthly and weekly zones. Price needs to break above the monthly zone. Let’s see if the month of June opens up above $107,700 that would indicate a continuation to the upside - possibly to $120-125K…
Monthly closing is Important!Monthly closing above 91-92 would
be OK.
Otherwise as mentioned earlier, next support
would be around 81 - 83 but then 88 - 90 would
become the Resistance.
