Backing Up The TruckIt seems silver is heating up. Better shine up your bullion and get ready for some crypto-like swings. From a macro perspective it looks very similar to the bullish cupping pattern on many other charts. Starting with the Fibonacci extensions measured out from the past major bull run it looks like once again, price clings to the levels like a magnet.
During the 2003-2011 bull market the most notable swings range from 65 to over 100%. The pullbacks sometimes just as violent. The 50 week EMA looks like it was a relatively solid support level and will likely remain so in the future.
Silver has already made it's first 75% move from off the 50 week EMA and has pulled back to the 0.236 fib. It looks like that could be the floor for now. Another 75ish% move would put it up between the 0.5 and 0.618 level around $40.
It will likely take some time to get there with a lot of chop. There is still a risk of the DXY having a technical relief rally especially if new starts rolling out of 'stimulus' disappointments. This is how I've been playing it considering these risks...
After it broke $20 - accumulating bits and pieces on dips, building a core long term position. Trimming and booking some profits into the larger swings.
Fib targets to watch for now:
0.382 --- 31.50
0.5 --- 37.45
0.618 --- 43ish
Trading is risky, don't do it.
Long (6% of portfolio)
Silver bullion and coins
SLV, PSLV, CEF
Moon

Options Blueprint Series [Intermediate]: Lunar Timing and ThetaIntroduction
This edition of the Options Blueprint Series focuses on gold futures and micro gold futures, using an iron condor options structure to explore how time decay (theta) can be positioned in an environment where signals conflict rather than agree.
Gold has been trading at elevated levels, attracting strong participation from momentum-driven traders while simultaneously showing signs of short-term exhaustion. This creates a valuable learning environment for options traders, particularly those interested in non-directional strategies that rely more on time and range behavior than outright price direction.
This article is presented as a case study. All tools, indicators, and trade structures discussed are used for educational purposes only. Lunar timing, in particular, is included as a belief-based analytical lens used by some market participants, not as a predictive mechanism.
Market Context: Gold at Elevated Levels
Gold futures have experienced a powerful rally since the reopening of U.S. Sunday evening trading hours, extending an already strong longer-term uptrend. Price is now operating at new all-time highs, a condition that often amplifies emotional behavior among trend followers.
In such environments, markets frequently display two competing forces:
Continued upside pressure driven by momentum and fear of missing out
Short-term vulnerability driven by overextension, crowding, and mean-reversion dynamics
Rather than attempting to resolve which force will dominate, this Options Blueprint explores how options structures can be used to frame uncertainty itself.
Analytical Inputs Used in This Case Study
This framework combines multiple analytical perspectives. None are presented as definitive signals; instead, they are used to illustrate how diverse inputs can shape options structure selection.
Lunar Timing (Moon Phases Indicator)
The chart highlights waxing and waning moon phases:
Waxing moons are displayed in blue
Waning moons are displayed in gray
The current market condition coincides with a waxing moon phase, which some traders interpret as a potentially bearish timing window. It is important to stress that lunar analysis is belief-based, not empirically causal. Its inclusion here is intentional for educational diversity and contextual layering, not validation.
Bollinger Bands® on Multiple Timeframes
Two Bollinger Bands® sets are applied:
One based on the daily timeframe
One based on the weekly timeframe
Price is approaching, and in some instances penetrating, the upper bands on both timeframes simultaneously. This alignment often signals volatility expansion and late-stage trend behavior, increasing the probability of range stabilization or consolidation, even if the broader trend remains intact.
RSI and Divergence
The Relative Strength Index is set to standard parameters: Length = 14
A bearish divergence is visible, where momentum fails to confirm new price highs. Notably, the
RSI length coincides numerically with half of a lunar cycle. This coincidence is observational only and does not imply a functional relationship.
Structural Support Below Price: UFO Context
Below current price, the chart highlights UFOs (UnFilled Orders) clustered near 4,527. These represent areas where prior price discovery was incomplete, often acting as zones of liquidity and structural interest.
This region introduces an important counterbalance:
While short-term indicators lean bearish
Structural market mechanics suggest potential downside cushioning
This combination reinforces the idea of a bounded market environment, rather than a clean directional thesis.
Why an Iron Condor Fits This Environment
When markets present conflicting directional evidence, strategies that benefit from price containment and time decay become particularly relevant.
An iron condor:
Does not require a bullish or bearish forecast
Defines risk in advance
Benefits from theta as time passes
Allows strike placement around known volatility and structure zones
In this context, the iron condor serves as a framework for uncertainty, not a directional expression.
Iron Condor Structure (Illustrative Example)
This case study uses a January 27 expiration within the GCG contract cycle.
Call Side
Short 4,850 call
Long 4,900 call
Put Side
Short 4,500 put
Long 4,450 put
The strikes are positioned at approximately equal distance from current price, with the downside aligned near known UFO structural support.
Key Characteristics
Net theoretical credit: approximately 10.3 points
Theoretical maximum risk: approximately 39.7 points
Lower break-even: near 4,490
Upper break-even: near 4,860
As long as price remains within this range through expiration, the structure benefits from time decay. If price exits the range, losses are predefined and limited.
Theta: Time as the Primary Variable
In short-option structures, theta becomes the dominant driver of performance when price remains stable.
Key educational takeaways:
Theta accelerates as expiration approaches
Time decay is not linear
Volatility changes can amplify or offset theta
Direction matters less than location and pace
This structure highlights how patience and risk definition often matter more than directional conviction.
Managing an Iron Condor
There are many ways traders manage iron condors as conditions evolve. Without going into procedural detail, common approaches include:
Rolling positions forward in time
Adjusting strikes to rebalance risk
Reducing exposure on one side of the structure
Management decisions depend on price behavior, remaining time, volatility, and individual risk tolerance.
Contract Specifications: GC vs MGC
Gold Futures (GC)
Contract size: 100 troy ounces
Tick size: 0.1
Tick value: $10
Outright margin: $22,900
Micro Gold Futures (MGC)
Contract size: 10 troy ounces
Tick size: 0.1
Tick value: $1
Outright margin: $2,290
Both contracts follow the same structural logic, allowing traders to scale exposure while maintaining identical analytical frameworks.
Margin requirements for futures and futures options are dynamic rather than fixed, meaning they may vary over time in response to changes in market volatility, price levels, and risk conditions as determined by exchanges and clearing firms.
Depending on the broker and clearing arrangements, the specific margin requirement for an iron condor is frequently set near the position’s maximum theoretical risk; in this illustrative case study, that risk is approximately 39.7 points ($397), though margin treatment can vary.
Risk Management Considerations
Even defined-risk strategies carry meaningful risk. Key principles include:
Position sizing relative to account equity
Awareness of gap and volatility risk
Understanding assignment and expiration mechanics
Options limit risk by design, but do not eliminate uncertainty.
Final Thoughts
This Options Blueprint demonstrates how lunar timing, volatility structure, RSI behavior, and UFO context can coexist within a single framework, without requiring directional certainty.
The iron condor is not presented as a solution, but as a lens through which uncertainty can be structured, with time decay acting as the central variable.
Markets rarely offer clarity. Options allow traders to respond to that reality with structure, discipline, and predefined risk.
Data Consideration
When charting futures, the data provided could be delayed. Traders working with the ticker symbols discussed in this idea may prefer to use CME Group real-time data plan on TradingView: www.tradingview.com - This consideration is particularly important for shorter-term traders, whereas it may be less critical for those focused on longer-term trading strategies.
General Disclaimer
The trade ideas presented herein are solely for illustrative purposes forming a part of a case study intended to demonstrate key principles in risk management within the context of the specific market scenarios discussed. These ideas are not to be interpreted as investment recommendations or financial advice. They do not endorse or promote any specific trading strategies, financial products, or services. The information provided is based on data believed to be reliable; however, its accuracy or completeness cannot be guaranteed. Trading in financial markets involves risks, including the potential loss of principal. Each individual should conduct their own research and consult with professional financial advisors before making any investment decisions. The author or publisher of this content bears no responsibility for any actions taken based on the information provided or for any resultant financial or other losses.

Get Ready for a Strong Recovery on Theta in the Near Future! I believe Theta will see a strong recovery very soon based on this ABC correction, the same pattern BCH experienced. This will lead to a sharp recovery and a strong bullish move in the near future. It could be very profitable and mark the beginning of a massive run for this coin in the bigger picture. Theta is heavily undervalued and ready for big things.
As always, stay profitable.
– Dalin Anderson

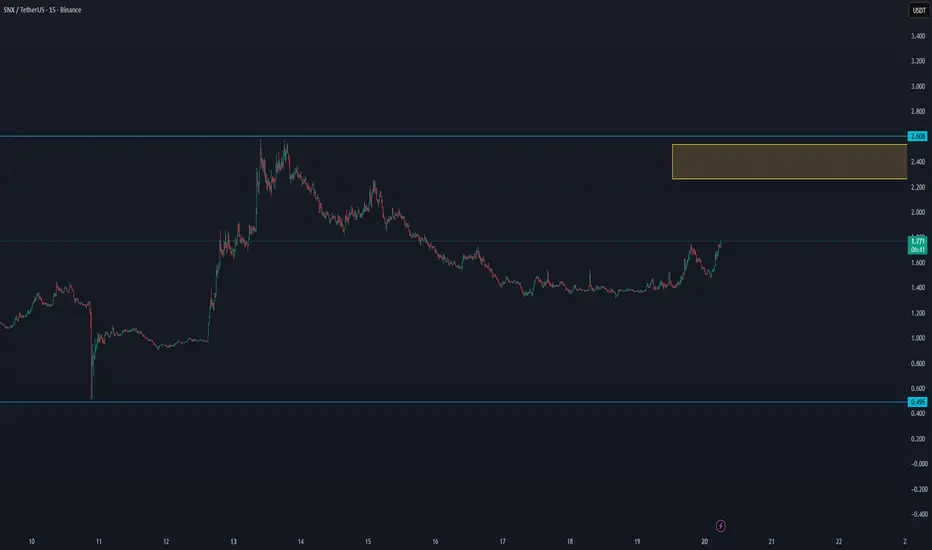
SNX/USDT INCREASE VOLUME On the lower time frames, SNX is showing signs of increasing volume, which could build up over time. For this reason, it’s worth watching SNX closely to see if the trend can break.
Bitcoin is looking good here. Don't mind the FUDI believe Bitcoin is heading to another new all-time high soon. This correction is just another step on our way to victory. Don't mind all the FUD.
As always, stay profitable.
– Dalin Anderson

$LINK – PREPARING FOR A BIG DUMP – SQUEEZE TRAIN LOADING Traders,
I BELIEVE THE CRYPTO MARKET IS SETTING UP FOR A BIG, BIG, BIG DUMP!, NOT JUST LINK!
Last time, we nailed the BIST:LINK short from $24.55 — it hit Target 1 and Target 2 (the two boxes below) pixel perfect.
From $20.00 we expected a retrace back up toward the $23.00 region, before a potential dump to $17.00.
That scenario may now be unfolding.
Let’s break it down:
CVD & Market Participation – Bearish Divergence Building
Aggregated CVD Spot → still relatively flat → tells us there’s no real spot demand or accumulation. Spot buyers are not fueling this push.
Aggregated CVD Futures (Stablecoin-margined) → moving aggressively higher → lots of leveraged traders chasing the move up.
Aggregated CVD Futures (Coin-margined) → also moving aggressively higher → even riskier longs, since collateral is crypto itself (double downside risk if LINK sells off).
👉 Why this is a bearish divergence:
Price is being pushed higher only by aggressive leveraged longs, while spot (the foundation of demand) is not confirming. This creates a fragile rally that can easily unwind into a long squeeze.
Order Flow – Signs of Absorption
On Binance & Bybit perps, we see aggressive buyers stepping in (CVD making higher highs).
But price is not moving higher accordingly.
This is a classic absorption signal: passive limit sellers are absorbing the buying pressure, preparing for reversal.
Market Context – Entering the PRZ ($23–24)
HTF VAL (Value Area Low) at this region.
LTF VAL aligns perfectly here too.
Single Prints (TPO profile) → thinly traded zones where price moved quickly in the past, often acting as magnets and reversal points.
Imbalances stacking at these levels, showing inefficiency that can flip.
AVWAP Confluence → multiple anchored VWAPs cluster in this zone, creating strong resistance.
All of this builds a confluence-heavy Potential Reversal Zone (PRZ) at $23–24.
My Take
We are entering a Reversal Zone packed with:
No real spot demand,
Leveraged longs chasing,
Absorption in order flow,
Strong technical confluence (VALs, TPO singles, Imbalances, AVWAP).
⚠️ This is the perfect fuel for a long squeeze dump back toward $17.00.
Trade safe, manage risk. Adios 🚀🔪

THE LAST ALV CHART: Binance + Burning the Key — 2025 Will Be ...ALV/USDT Final Chart — The Golden Setup for 2025
After consistent daily updates, this could be the final and most powerful ALV chart leading into 2025.
There’s a strong probability that ALV will target $0.50 on its way toward a $1.70 high in 2025.
As long as the price remains well above the secure zone around $0.11, ALV stays technically bullish and positioned for another breakout — whether early or late in the next cycle. The setup is now confirmed for a solid swing trade into 2025.
There’s also growing speculation that Binance may list ALV, especially following the surge in Binance Alpha volume. Combined with the potential for the team to burn more token supply, the technicals and fundamentals align perfectly — making ALV one of the most promising breakout candidates for 2025.
🔥 ALV could truly be the golden chart of the year.

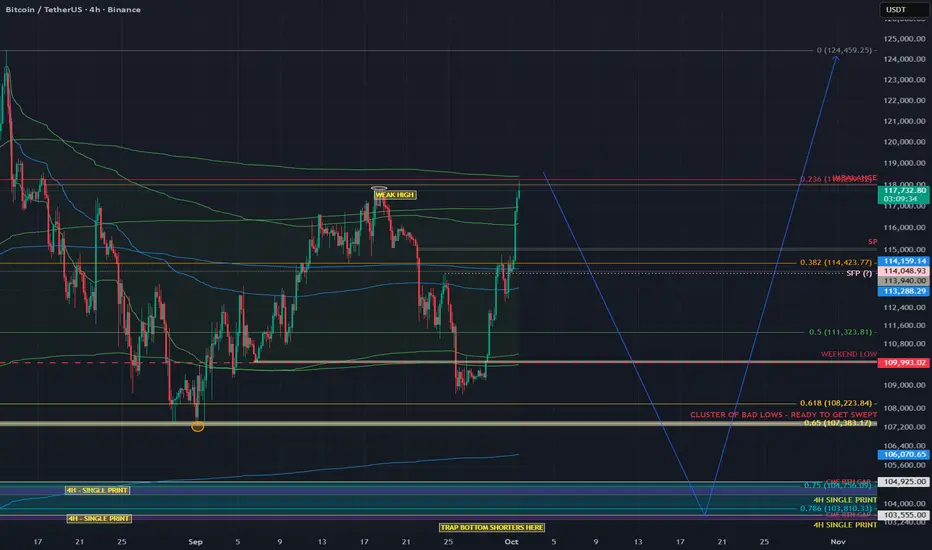
BITCOIN’S PUMP BEFORE THE DUMP — CRYPTO ABOUT TO CRASHTRADERS, WE ARE STARING RIGHT INTO THE EYE OF THE STORM. BITCOIN’S “TOO GOOD TO BE TRUE” RALLY IS BEING PROPPED UP BY LEVERAGED PERPS, NOT REAL SPOT BUYING. THE CHART IS SCREAMING EXHAUSTION: AVWAP BANDS COLLIDING, ORDER FLOW MAXED OUT WITH AGGRESSIVE LONGS, AND A DANGEROUS IMBALANCE AROUND 118K. THIS IS THE PERFECT BREEDING GROUND FOR A MEGA LONG SQUEEZE THAT WILL NOT ONLY RIP THROUGH BITCOIN BUT DRAG THE ENTIRE CRYPTO MARKET DOWN WITH IT. THE PUMP IS THE TRAP. THE DUMP IS LOADING
TLDR;
This leg looks futures-driven, not spot-backed. We’re pushing into AVWAP outer-band confluence with imbalances near 118k while leveraged longs pile in. Base case: sweep the mid-Sept Weak High, fail, rotate down toward 104k (and maybe 98.5k). I’ll flip only if spot CVD takes the lead and price accepts above the AVWAP band cluster.
Why I think the “mega long squeeze” is loading
1) Who’s actually buying? (Spot CVD vs Futures CVD)
Spot CVD: still negative/underwhelming across the push → real buyers (spot) aren’t lifting.
Futures CVD (stablecoin-margined): rising with Open Interest → perps are doing the heavy lifting.
Translation: Leverage is pushing price, not genuine spot accumulation. These moves are fragile and unwind hard when OI compresses.
2) AVWAP confluence (the auction math)
I’m tagging anchored VWAPs from opposing pivots (swing low→high and swing high→low).
The outer bands from these anchors are overlapping in the same zone → both bottom-anchored longs see it as expensive (profit-taking), and top-anchored shorts defend their break-even.
That overlap = double-sided supply. Historically, these reject unless fresh spot demand blows through (which we don’t have… yet).
Still have bad September lows that are likely to be swept at 107k~
3) 118k imbalance
There’s an inefficient push / imbalance around 118k. Thin structure often gets tapped/swept, then mean-reverts if the follow-through is purely leveraged.
4) Order flow is too aggressive (late longs)
OI up + positive delta into resistance = new longs chasing.
On footprint, you can see buy-side aggression meeting absorption near the top of the move. That’s classic trap fuel if we print an SFP.
Trade idea (conceptual, not financial advice)
Base case path (bearish):
✅ Sweep the Weak High (mid-Sept) into 117.8–118.8k (imbalance + AVWAP band confluence).
✅ Print a Swing-Fail Pattern (SFP) / rejection wick on 5–15m with:
Spot CVD NOT confirming (stays flat/negative),
OI spikes while delta stalls (late longs absorbed).
Short after the reclaim/failure back below the swept high; stop above the SFP high.
Targets / magnets:
113.2–114.1k (0.382 zone / local AVWAP midlines)
111.3k (0.5 retrace / prior balance edge)
109.9–109.3k (weekend low / prior node)
106.0–104.9k (SP + LVN cluster, high-prob test area)
Stretch: 103.5k (4H single print) → 98.5k if liquidation cascade extends.
validation / flip criteria:
Acceptance above the AVWAP outer-band cluster and 118.8k with:
Spot CVD turning positive and making higher highs,
OI stable or down on further upside (less leverage dependence).
If that happens, I stand down on the short idea and reassess for continuation
DGB CAN ENTER 40% TREND INCREASE - Update 29-09-2025DGB/USDT Trading Update
🔹 Main trend support: DGB is currently holding around its main trend level, showing early signs of stability after a strong correction.
We have seen before similar trend
🔄 New cycle forming: A recovery setup is visible, with the market potentially entering a new cycle if momentum continues upward.
🎯 First target: The next significant target lies at $0.0106, aligning with resistance from the previous cycle.
📈 Upside potential: If this cycle gains confirmation, there is a 40% increase potential from current levels, making this a key area to watch.
📌 Summary:
DGB is stabilizing at the main trend, showing promising signs of a new cycle activation. If the upward push holds, the first target of $0.0106 could mark a potential 40% increase in price.
The previous increase from the start to now until the target took 14 days.

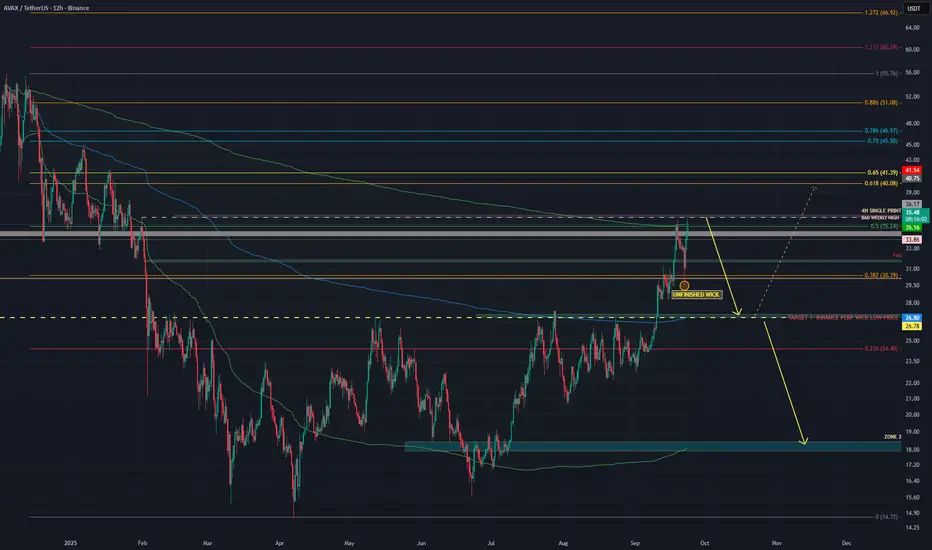
$AVAX – ARBITRAGE DUMP DETECTED – READY TO BALANCE?Traders,
Last time we nailed CRYPTOCAP:AVAX from 22.80 → 30 → 35 almost pixel perfect.
Now the setup may be flipping. Let’s break it down with the THETA method:
🔹 Imbalances
Perps vs Spot: Binance Perps wicked down to $26.83, Spot hasn’t filled it yet → liquidity gap below.
Market Profile: Price swept the 31 Jan weekly high, a “bad high” (too much excess, unstable).
Oscillators: RSI shows bearish divergences on multiple timeframes → momentum fading.
Context: Market is repairing imbalance above to build liquidity, which can later be used to fix the unfinished business below.
🔹 Order Flow & AVWAP
Aggressive buyers stepping in at $34–36 (since CME open).
Price is now trading at the upper band of the HTF AVWAP, a zone that often signals overextension vs volume-weighted positioning.
The unfilled wick imbalance at $26.83 is also the price of the HTF AVWAP itself (blue line) → strong confluence for a revisit.
If downside continues, those aggressive buyers will be trapped, fueling the move lower.
Next key check: At $26.90, we need to watch data + price action to define if AVAX stabilizes there or breaks further.
✅ Conclusion
Price is showing signs of distribution at the HTF AVWAP upper band. Liquidity is being absorbed above, and the confluence of the wick imbalance + HTF AVWAP at $26.83 strengthens the case for a downside move.
👉 Key takeaway: Longs chasing into AVWAP extremes = potentially trapped buyers, with the market likely rotating back to $26.90–26.83 before the next decision point.
Dogecoin is about to blast off! Study internet bubble stocks.I believe Dogecoin will see a strong run all the way to a new all-time high. When you study other market cycles, like Apple during the internet bubble, you see the same story told over and over again with subtle differences. Watch for a big bull market ahead.
As always, stay profitable.
– Dalin Anderson

BTCUSDT- 250905 - LONG - Binance - Algo Target - 1WTake Profit: $134,000 - $137,000
Likely Market Cycle Top

SOLUSDT- 250905 - LONG - Binance - Algo Target - 1WSOLUSDT- 250905 - LONG - Binance - Algo Target - 1W

XAUUSD GOLD TO THE MOON !!Gold to the moon !!1
sell of we currently see is only the 4th wave correction .
5th wave will soon kick in , generally the 5th wave up is a parabolic move to the moon where
we will place a gold flag on .
tp 3600 and above .

THIS CAN BE THE CANDLE THAT WILL BRING BTC BACK TO 117KTHIS CAN BE THE CANDLE THAT CAN BRING BTC BACK TO 117K
Following it with 100% focus.
High chance BTC is going to 117K after confirmation 113K

Cronos Mega pump incoming! Based on this fractal comparison of Ethereum's cycle to CRO, I expect a mega run on this coin. It’s ready for a vertical move, just like we saw with Ethereum in 2020–2021. Watch for a big-picture breakout and a super moon.
As always, stay profitable,
– Dalin Anderson

$PWEASE will go to the moon$ PWEASE go to the moon.
The daily RSI retested the 50 line, indicating the start of an uptrend after a long period of accumulation with well-defined support. BTC dominance is falling, which is essential for the rise of altcoins.
The political scenario also helps, with JD Vance increasingly in the media spotlight (even appearing on South Park).
At least 100 million is expected.
If Trump slips and falls, we will expect at least 10 billion.
$ PWEASE market cap today: only 4.5 million
Easy Money!

Potential reversal in sight - x100 Potential MEME CoinAs a price action trader im still waiting for confirmation and/or liquidity sweep however overall
chart looks great with a tons of confluence for a POTENTIAL reversal 😉
We are still bullish on a daily. Yesterday printed a doji candle in high confluence area - daily and 4-hours order block responsible for the last breakout .
We are playing around 200 SMA on 4H and strong volume support area and we are definitely in discount area considering the last leg up.
I would like to see a change of character on 30 min - 1 H and /or a liquidity sweep before calling a trade entry cause we are still in a downtrend until proved otherwise.
ON fundamental side of things - the team is very active and doing everything to bring this coin to BONK market cap.
Keep an eye on this x100 gem is all i am saying 🤑🥸

vitalik rocket coming at u in a few monthsVitalik’s been struggling to get his rocket off the launchpad since 2021-22.
He’s practically begging for liftoff now, and it’s only a matter of time before his engine’s roaring again and his rocket blasts all over your face.

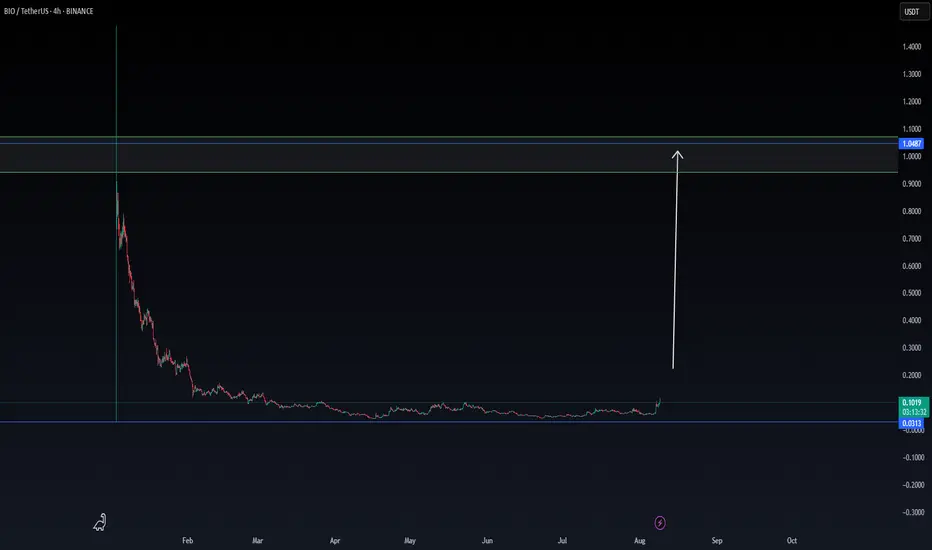
BIO THE next hype coin that can return up $1There is a high chance BIO is going to return up $1
We will follow to see if this is going, depending Data
The coin is now moving between $0,09 and $0,10
Data shows that this coin has the volume power to break back to $1 , next targets could be $0,25 and $0,43
BTC Moon Phase, Dominance % and BBWP resolutionBTC, D. Moon Phase. I see bearish scenario for the next days, until 4-5th of August. After reviewing Moon Phase chart for last year+, I see same scenario is happening most of the times. During the First Quarter ( Aug. 1) of the phase, price is dropping and start to recover about 4-5 days prior Full Moon. This is exactly when energy of the Full Moon starting to amplify. Current BBWP is contracted for 8 days, making the next move very rapid, I would not set any long/short trades, untill the volume start to expand. Its the mid summer - always slow and August is the month it start to accelerate towards the Fall, with all financial/political tricks happening in September and later in Q4. We already had one bear trap fakeout, but price didnt anticipate to go higher and got rejected by falling wedge upper like ( or bull flag, in this case).I would expect that high volume green candle will be either fully recovered to $110-111K , or 75% recovery, where the CME gap is $113500 - 1-2% lower, making it $113,000. The cascade liquidation will happen very fast, I expect the whole move down and up will take around 24 hours, with the bottom time 5-15 minutes. Need to be ready, that all alts will crash as well, Im expecting BTC %dominance to bounce here , after 8.4% drop to weekly 50EMA. I would like to see BTC, D% at 70% by Christmas and new ATH, what ever it is 160K or 200K what ever it is, for bitcoin to make ATH, it must grab dominance.

SUPER = BACK WITH SUPER EFFECT - MOON SHOTSuper can show in the coming time frames an interesting view.
When there is confirmations, will add below this update.

GME TRENDS AND PRICE TARGETSGME has a neat trend setup where it is sitting around support, with huge downside, but also huge upside. We just saw price gap down and the return sets us up to climb potentially as high as $66.
Good luck GME people.
Contact me for custom charts.
Overall bullish but be careful on this trend break, it is a risky buy.
