RSI Overbought & Oversold Strategy
What Is the Relative Strength Index (RSI)?
1. The relative strength index (RSI) is a popular momentum oscillator introduced in 1978.
2. The RSI is displayed as an oscillator (a line graph) on a scale of zero to 100.
3. An asset is usually considered overbought when the RSI is above 70 and oversold when it is below 30.
4. The RSI line crossing below the overbought line or above the oversold line is often seen by traders as a signal to buy or sell.
5. The RSI works best in trading ranges rather than trending markets.
Moving_average

50 Day Moving Average Strategy
TRADE ENTRY
1. To enter a 50-day moving average trade, you should wait for a breakout.
2. Whenever the price breaks the 50-day SMA, you should open a trade in the direction of the breakout.
3. In most cases, the price action will continue in the direction of the breakout.
STOP LOSS
1. If the price breaks the 50 SMA upwards, we need to go long, placing a stop below a bottom prior to the breakout. The opposite is true for bearish trades.
2. If the price breaks the 50 SMA downwards, we need to short the stock placing a stop below the bottom prior to the breakout.
PROFIT TARGETS
1. Hold your trades until the price action breaks your 50-day moving average in the direction opposite to your trade.
2. If you are long, you close the trade when the price breaks the 50-day SMA downwards.
3. If you are short, you close the trade when the price breaks the 50-day SMA upwards.
CONCLUSION
1. Stock price above the 50-day moving average is usually considered bullish.
2. Stock price below the 50-day moving average is usually considered bearish.
3. If the price meets the 50 day SMA as support and bounces upwards, consider a long entry.
4. Stock price meets the 50-day SMA as resistance and bounces downwards, consider a short entry.
5. If the price breaks the 50-day SMA downwards, you should switch your opinion to bearish.
6. If the price breaks the 50-day SMA upward, you should switch your opinion to bullish.

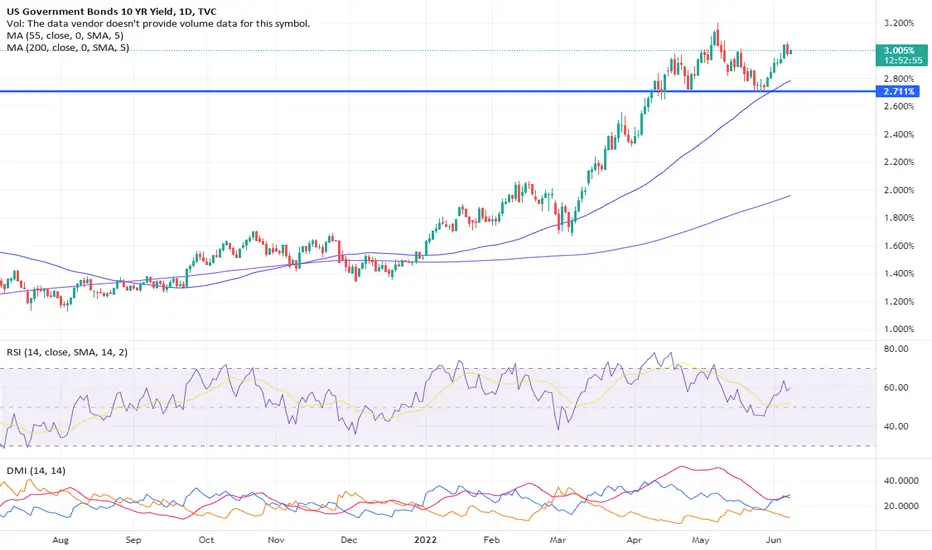
How I use moving averagesThe US 10Y yield continues to plough higher. We had been watching the support at 2.73 (end of April low) for a possible break but in the end, this held several attempts, and the market has recovered well. This support was reinforced by the 55-day ma, which lies at 2.78 currently and this has left the market well-placed to tackle the 3.20 May high.
In the past I used to regularly have discussions regarding the optimisation of moving averages, crossovers, whether to use simple, exponential or weighted moving averages and all I can say is that I have remained firmly married to the 20, 55 and 200 simple period moving averages for a very long time.
Firstly, I should state how I use them, and it is as a straightforward support and resistance tool. I have noted over time that markets tend to mean revert to their long-term moving averages and price action around particularly the 55 and 200-week moving averages can be critical for the long-term trend. Crossovers can also add weight to a view, but as these are lagging indicators, I normally have a view in place already. All I would say is try them out and see which one suits you.
John Murphy has this to say about moving averages:’ Even though there are clear differences between simple moving averages and exponential moving averages, one is not necessarily better than the other. Exponential moving averages have less lag and are therefore more sensitive to recent prices - and recent price changes. Exponential moving averages will turn before simple moving averages. Simple moving averages, on the other hand, represent a true average of prices for the entire time period. As such, simple moving averages may be better suited to identify support or resistance levels.
Moving average preference depends on objectives, analytical style, and time horizon. Chartists should experiment with both types of moving averages as well as different timeframes to find the best fit.’
There is plenty more commentary and analysis available if you join the STA. Become a member and get 10% off your first year’s subscription by quoting this code number STALINKEDIN
Disclaimer:
The information posted on Trading View is for informative purposes and is not intended to constitute advice in any form, including but not limited to investment, accounting, tax, legal or regulatory advice. The information therefore has no regard to the specific investment objectives, financial situation or particular needs of any specific recipient. Opinions expressed are our current opinions as of the date appearing on Trading View only. All illustrations, forecasts or hypothetical data are for illustrative purposes only. The Society of Technical Analysts Ltd does not make representation that the information provided is appropriate for use in all jurisdictions or by all Investors or other potential Investors. Parties are therefore responsible for compliance with applicable local laws and regulations. The Society of Technical Analysts will not be held liable for any loss or damage resulting directly or indirectly from the use of any information on this site.