The Swing Strategy, I been usingZone‑to‑Zone Trading
1.1 Drawing the Zones
What is a zone?
A price area (not a single line) where the market repeatedly reacts: flips from support→resistance (S/R) or resistance→support (R/S), stalls, or coils.
Priority by timeframe:
Monthly ≥ Weekly ≥ Daily ≥ Hourly. Higher‑timeframe zones carry more weight.
How to mark zones
Start on monthly, and highlight obvious S/R bands.
Drill down to weekly, refine, or add.
Drill down to daily, refine, or add.
Drill down to hourly for tactical entries.
Clues for a quality zone
Prior breakout level that later flips to S/R on retest and consolidates before resolution.
Clear historical reaction clusters (wicks, bodies, or gaps).
Visible “sensitivity” (multiple rejections/holds in the same area).
1.2 Trading the Zones
Entry: Wait for local consolidation near a zone, then take the breakout.
Stops:
Conservative: Below the box low (consolidation floor).
Tight: Mid‑box (accept higher stop‑out rate, better R).
Filter:
Longs only above 50 SMA, shorts only below 50 SMA (trend filter).
1.3 Range vs. Exact Level
Treat zones as bands, not one price tick. I would take the pivot close to the opening of the first red candle if it's a bullish pivot.
At times a single line is acceptable (e.g., clean, repeated close‑basis pivot), but default to ranges.
2) Box System
2.1 Market Phases
Sideways (consolidation) → build energy (boxes form between zones).
Trending → series of HH/HL (up) or LH/LL (down).
2.2 Trend Structure
Trends breathe via consolidation → expansion → consolidation.
Breakouts can:
Go with no retest
Retest the boundary and go
Brief incursion back into box, then full resolve
The first inner zone inside the box is critical: if a new uptrend is valid, the price shouldn’t revisit below it.
Stops: below that first inner zone.
Note: Zone‑to‑Zone shines in non‑trendy markets (FX, many dividend names).
2.3 Types of Boxes
MA roles (fractal):
9 SMA → short‑term momentum
50 SMA → intermediate momentum
21 SMA → the inflection between 9 and 50; often reacts first
2.3.1 Base Box
Both the 9 & 50 SMA flatten for an extended period.
Highest stored energy; breakouts can start major trends.
2.3.2 50 SMA Box
Sideways price, 9 SMA flat, 50 SMA rising/falling into price as dynamic S/R.
Breakout after the 50 SMA reaches the box.
2.3.3 9 SMA Box
Shorter coil (≈ 3–4 candles).
9 SMA catches up; breakout follows.
Shortest consolidation; quicker moves.
2.3.4 9 vs 50 Comparison
9 SMA trend: 2× HH/HL supported by 9. Parabolic (≈20% of cases): each candle’s low should not undercut the prior candle’s low.
9 SMA box: brief sideways until 9 SMA “tags” price → quick reaction.
50 SMA boxes: longer coil; 50 “arrives,” 9 often flat.
Base box: 50 is inside & flat; price crossed above/below multiple times.
2.4 System Objectives Checklist
Trend-following or mean-reversion?
Entry conditions?
Exit logic?
System expectancy?
Risk model?
Entries
Box breakout (bullish): Prefer consolidation at the top‑right of the box before break → higher probability.
Zone‑to‑Zone: Look for a lower‑TF coil at a higher‑TF zone → break of coil for entry.
Profit & Exits
Next zone target; or
Exit when an uptrend fails to make an HL (i.e., breaks prior swing low).
Stops
Box breakout: Below the first inner zone or box low.
Zone‑to‑Zone: Based on the lower‑TF coil used for entry.
Position Size = 4% per trade or less.
2.5 Trading the Boxes
Four box archetypes: 9 SMA, 21 SMA, 50 SMA, and Base.
Base Box
More false starts; longest runs when it goes.
Prefer equity or bull‑put spreads; ride while price > 50 SMA.
50 SMA Box
The first 50‑box after a base is the most reliable.
Daily 50‑box usually follows 3–4 weeks of coil; expect ≈1.5–2 weeks of trend leg.
Tactics: Stock and swing options (expiry ≈ coil length or slightly more).
9 SMA Boxes
Breakout leg ≈2–3 days, then another coil.
Tactics: Scalps with 1–1.5 weeks to expiry; 1–2 OTM strikes.
Quick Summary
Base: most power, least timing precision.
50: first after base = best reliability; second is weaker.
9: short, sharp, tactical.
2.6 Overall Market Environment
If indices trend up above the latest daily zone, 8/10 breakouts can succeed.
If indices chop under the latest daily zone, expect ≈5/10 to work.
Compare QQQ vs. SPY strength to gauge risk‑on/off.
Rules of thumb
Upside bias: Index above the latest daily zone (or proxy 9 SMA if approximating).
Scalping bias: Above the latest hourly zone.
2.7 Box System & Long‑Term Investing (LTI)
Markets are fractal; weekly = daily = hourly in pattern, not speed.
Trend rule: in an uptrend, price should not break prior swing low (mirror for downtrend).
Trailing stop logic
Uptrend: trail to recent swing low once confirmed.
Downtrend: trail to recent swing high.
MA benchmarks:
Hard breaks of 9 SMA → likely consolidation.
50 SMA for longer bias.
Caveat: large‑cap growth rarely trends cleanly down (index dependency & fund flows).
2.8 Watchlist Creation
Three steps
Scan sectors for consolidations (boxes).
Check relative strength vs. SPY (e.g., XLK/SPY).
Review the top 10–20 holdings.
Tiers
A‑List: Box about to break + high options liquidity.
B‑List: Box about to break but low options liquidity.
C‑List: Boxes are still developing.
2.9 Role of the 21 SMA
Acts as the inflection between 9 and 50.
The highest failed‑break probability occurs at 21 boxes.
After a 9‑trend ends, watch 21 for the reaction:
Back to recent highs and breaks, or
Failed break; or
Reject at 9 after 21 reactions.
2.10 SPX Intraday Scalp Pattern
Don’t chase the open; wait 1–2 hours for the market to form an intraday box (2–3 h coil).
Enter as the range breaks: you benefit from direction and rising IV (“double whammy”).
2.11 SQUEEZE Pro Indicator (SQZPRO)
Concept: A squeeze occurs when Bollinger Bands compress inside the Keltner Channels (BB inside KC) → energy building.
Dot codes (suggested):
Green: No squeeze
Black: Mild squeeze (BB within 2 ATR KC)
Red: Tight squeeze (BB within 1.5 ATR KC)
Yellow: Very tight (best odds for expansion)
Heuristic: The tighter the compression, the stronger the potential release.
2.12 Backtesting & Strategy Creation
Use TradingView Replay. Segment by regime (bull, bear, or chop).
Test entries, exits, and risk variants.
Purpose: build statistical confidence to keep your “monkey brain” from hijacking.
2.13 QQQ vs SPY for Intraday
SPY: S&P 500 (market‑cap weighted, broader economy).
QQQ: NASDAQ‑100 ex‑financials (tech‑heavy, risk‑on).
Scenarios
Bullish clean: QQQ > SPY, and both above hourly 9.
Bearish clean: QQQ < SPY, and both below hourly 9.
Chop, green day: Market up but QQQ < SPY → grindy.
Chop, red day: Market down and SPY < QQQ → grindy.
Read strength: Compare % change vs prior close.
2.14 Gaps: What & Why
Markets aren’t 24/7; exogenous events (earnings, geopolitics) reset expectations → open ≠ prior close.
How to trade gaps
Treat the gap range as support (gap‑up) or resistance (gap‑down); draw a gap box.
Unfilled gaps are potent S/R. Above, a bullish gap favors continuation until filled.
If the gap is huge, rely on historic zones to seed new levels within.
2.15 Scalps vs Swings
Scalps: minutes–hours; TF ≤ 1h.
Swings: days–weeks; TF ≥ 1h (prefer daily baseline).
Drill down one TF for refined entries; manage to the anchor TF.
Expiration (rules of thumb)
Stocks (scalps): Mon/Tue → same‑week; Wed/Thu/Fri → next‑week.
Indices (scalps): 1–2 DTE, 1–2 OTM.
Swings: Expiry ≥ consolidation length (often 1–1.5× coil duration).
2.16 Which Timeframe Should You Trade?
Real Trading Hours, 1-2 HR → Day trading & scalps (≤1h TF).
After Hours, 1–2 hr → Swings (≥1 hr, ideally daily).
Less than 1 HR → Multi‑week swings or LTI (weekly charts).
Moving Averages
Silver shortPlayed with Elliott tools. I think we get another wave down towards 20 week SMA.
AI commentary follows:
“Operation Silver Slide” 🛝
The plan is simple: wait for silver to puff its chest at $48, then gently remind it that gravity still exists. We’ll ride the wave down like surfers on a metallic tsunami — aiming for $42, where value investors wait with open arms and empty wallets. It’s not personal, just physics (and Elliott Wave theory). Remember: in markets, what goes up five waves must come down three. 🪙📉

Philip Morris (PM) — Strong Support or the Calm Before the Drop?
Short-Term Outlook (1–3 months)
Current Situation:
Philip Morris stock is trading around $153.39, sitting right on a key support zone. The price recently bounced after a sharp correction but now faces resistance near the 50-day moving average (around $158.30). This makes the coming days critical for direction confirmation.
Resistance & Support Levels:
Immediate Support: $153.39
Resistance: $158.30
Trend Analysis:
If PM can hold above $153.39 and break through $158.30, a short-term bullish move could develop. However, a breakdown below $153 would likely trigger renewed selling pressure.
Price Targets & Stop Loss:
Target: $158.30
Stop Loss: $140.27
Long-Term Outlook (6–12 months)
Current Situation:
From a longer-term perspective, PM remains below its 50-day moving average (around $177.73), suggesting the broader trend is still under pressure. However, if the stock can sustain above the $153–$158 zone and regain momentum, a recovery toward previous highs is possible.
Resistance & Support Levels:
Long-Term Support: $153.39
Long-Term Resistance: $177.73
Trend Analysis:
A sustained move above $158 would shift momentum bullishly, targeting the $170–$177 range. On the other hand, if the $153 support fails, the price could drop toward $140 or even lower.
Price Targets & Stop Loss:
Target: $170–$177
Stop Loss: $140.27
Summary
Short-Term: Watch for a bounce to $158 if support holds.
Long-Term: A breakout above $158 could open a path to $177; failure below $153 risks a drop to $140.

Tesla at a Breakout Crossroad
The Tesla (TSLA) daily chart shows a classic Cup & Handle pattern nearing a critical resistance zone. The key level sits around $450, aligning with a long-term descending trendline (in blue).
Technical Overview:
General Trend:
Since early 2025, TSLA has been in a steady uptrend.
The 50-day moving average (SMA 50) near $220 acts as strong dynamic support and is still trending upward.
The structure indicates Tesla is finishing the “handle” phase of the pattern — a decisive moment is approaching.
Bullish Scenario:
If the price breaks and holds above $450 with strong volume, it would confirm the Cup & Handle breakout.
Potential upside targets:
Short-term target: $503
Mid to long-term target: $565 (based on cup depth projection)
Stop loss: Below $410
A breakout above $450 could trigger a strong continuation rally as investors re-enter on technical confirmation.
Bearish Scenario:
Failure to break above $450 and a drop below $410 could invalidate the bullish setup, leading to a deeper correction.
Potential downside targets:
Short-term target: $375
Long-term target: $320
Stop loss: A confirmed close back above $445
This would suggest that the handle failed, and selling pressure could accelerate toward lower supports.
Timeframe Summary:
Short-term (1–3 weeks):
Expect consolidation between $410–$450, with bias toward a breakout if the tech sector remains strong.
Long-term (3–6 months):
A confirmed breakout above $450 opens the path toward $565.
If rejected, expect a correction toward $375, possibly forming a new accumulation base.

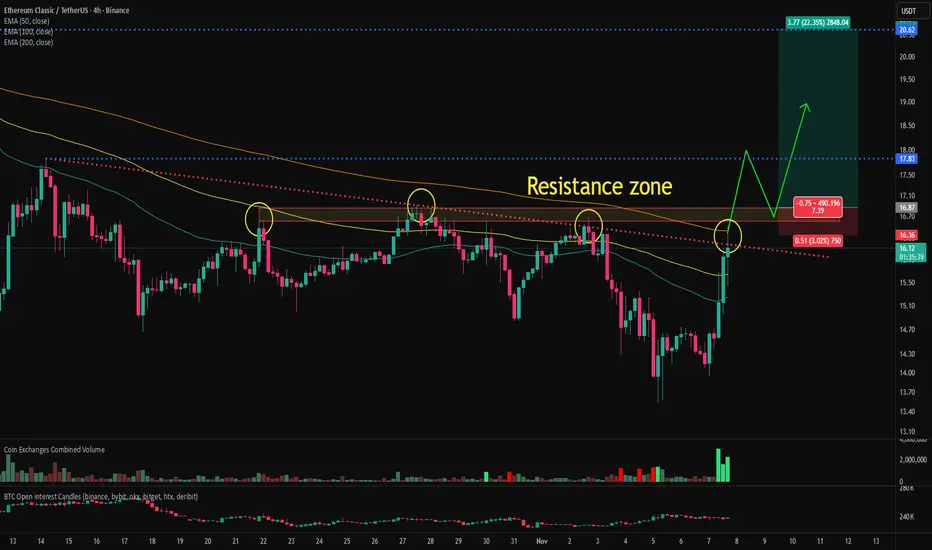
ETC(ehereum classic) chart analysis and bullish signalEthereum Classic is currently attempting to break above the 200-period moving average, a key resistance level, and a major supply zone on the 4-hour chart. Although it’s facing resistance at the moment, a decisive breakout through these overlapping resistance zones could provide an attractive long-entry opportunity with a favorable risk-to-reward ratio.
Given that this resistance area has rejected multiple breakout attempts in the past, the probability of a successful breakout this time appears relatively high.
The ETC/BTC chart has also cleared several major resistance levels, suggesting that ETC could follow a similar pattern to recent strong performers such as ZEC, DASH, and 1INCH.
The bullish alignment on the ETC/BTC chart also indicates that Ethereum Classic is outperforming Bitcoin.
If Ethereum Classic confirms a breakout above the resistance zone, I will share an updated analysis on the subsequent price outlook.
DSR ObservationBINANCE:DCRUSDT
4H
DCR has reached a key area of interest on the 4-hour timeframe, where multiple technical confluences suggest a potential reaction is imminent—whether minor or significant.
🔍 **Key Signals:**
1. **Resistance Zone**
2. **Fibonacci Retracement**
3. **Key EMA**
4. **MACD 0-Line**

FLT LongVolatus Aerospace – Momentum + Structure Play
Entry: Took position on 15m CCI cross as price reclaimed short-term structure and broke above key moving averages.
Stop: Trailing stop managed manually behind weekly HK candles, trailing by two weeks to let trend breathe.
Profit Plan:
• 1/3 at +10% to book early strength.
• 1/3 at Fib 0.382 (~$1.04).
• Final 1/3 at Fib 0.50 (~$1.33) for the bigger swing.
Re-Entry: Will look to scale back in on clean pullbacks/consolidations if longer-term structure stays intact.
Why I like it:
Volatus has broken a multi-year downtrend base with expanding volume. Integrated drone & aerial solutions give it a moat in a growing niche. Technicals are aligning across multiple timeframes — this is my style of “early confirmation with room to run.”

#EDUUSDT #1D (ByBit) Descending trendline breakout and retestOpen Campus is pulling back to 100EMA regained support where it seems likely to bounce and recover midterm.
⚡️⚡️ #EDU/USDT ⚡️⚡️
Exchanges: ByBit USDT
Signal Type: Regular (Long)
Leverage: Isolated (1.0X)
Amount: 5.1%
Current Price:
0.1598
Entry Targets:
1) 0.1587
Take-Profit Targets:
1) 0.3456
Stop Targets:
1) 0.0963
Published By: @Zblaba
NYSE:EDU BYBIT:EDUUSDT.P #1D #OpenCampus #Education opencampus.xyz
Risk/Reward= 1:3.0
Expected Profit= +117.8%
Possible Loss= -39.3%
Estimated Gaintime= 2-3 months

SPY/SPX Bear Market, liquidity speedbumps, and key levels SP:SPX AMEX:SPY
The current setup mirrors the prior rally from trough to peak, projecting a speculative 20% bear market range.
From here, I’m watching for a push into 6100–6200 that’s where strong resistance should form. If we reject that zone, it likely marks the start of a deeper unwind.
A quick overshoot toward 6000 wouldn’t surprise me and could trigger a dead cat bounce, but unless buyers regain control above 6200, the bounce should fade.
At 20% we'll be around $5550, where we’d likely find structural support. However a market shock around there could allow it to drop to $5200 if something happens while we're in that zone.
I don't think we'll go lower than $5000 moving forward
Bitcoin at a Major Decision Zone!The daily chart shows Bitcoin trading within a well-defined ascending channel for several months and now testing its lower boundary around the $100,000–$105,000 zone — a crucial structural support that also aligns with the 50-day moving average (SMA50).
Bullish Scenario:
If Bitcoin holds above $100,000 and forms a bullish reversal candle, a rebound toward $120,000–$135,000 is likely. A confirmed breakout above $120,000 could trigger a new upward wave toward a fresh all-time high.
Bearish Scenario:
If the $100,000 support fails, the next downside targets are around $90,000 and $80,000. A confirmed breakdown below $80,000 would signal a shift to a medium-term bearish trend.
Summary :
The $100K zone represents the dividing line between trend continuation and a deeper correction. As long as Bitcoin stays above $90,000, the overall market structure remains bullish.

BNB Battles the Golden Support Zone!After a powerful rally to around $1,300, BNB has entered a correction phase and is now consolidating near the key $900–$950 support zone. This area is technically significant as it aligns with the 50-day moving average (SMA50) and the upper boundary of the long-term ascending channel, which now acts as support.
In the bullish scenario, if the price holds above $900 and forms a bullish reversal candle, a rebound toward $1,050–$1,200 is likely. A confirmed breakout above $1,200 could trigger the next leg higher toward $1,350–$1,400.
In the bearish scenario, a confirmed breakdown below $880–$900 would likely open the door for a deeper correction toward $750–$800, aligning with the midline of the ascending channel.
From a medium- to long-term perspective, as long as BNB stays above $750, the overall trend remains bullish.
Summary:
The $900–$950 zone acts as the dividing line between trend continuation and a medium-term correction for Binance Coin.

The 3-Step Rocket Booster Strategy + Evening Star Candlestick The number #1 candlestick pattern is the evening star ✴️.
This is the pattern you are looking at on on this screen.
Its a very strong pattern, now notice how the top of this price action looks?
You see when the "dead cross" happened everyone started short selling.
Then pop bomb 💣 to the top.
After that the price just came falling.
Finding this one was a bit of a challenge but I did my due diligence.
"Its a bear market "
there I said it.
The 🐻 Bear market has arrived.
This means it's more favourable to short sell.
Am not short selling this stock am just giving you an idea via technical analysis.
I maybe right or wrong but I just want to share this idea and hopefully you learn from it.
No matter how good your trading system please plan for volatility.
Its like dating no matter how good your dating system there will be always some bad fruit you may have to get rid of.
It hurts but it's part of the game.Thinking of risk management is the key.
Make sure you master the evening star ✴️ pattern.
This is the Rocket Booster Strategy 🚀 in reverse from the short side:
1- The price is below the 50 EMA
2- The price is below the 200 EMA
3- The price gaps down via the evening star ✴️
That's the 🚀 Rocket Booster Strategy in reverse
Rocket boost this content to learn more.
Disclaimer ⚠️ Trading is risky please learn about risk management and profit taking strategies Also feel free to use a simulation trading account before you use real money

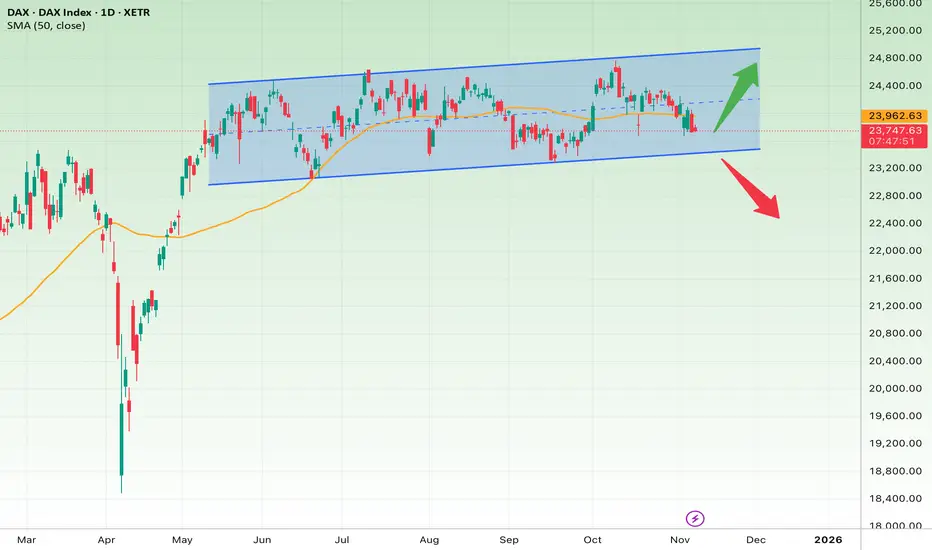
DAX at the Edge – Germany’s Market Faces a Big Decision!The German DAX Index has been trading within a gentle upward channel for several months and is now testing the lower boundary of that channel around the key support zone of 23,600–23,800. This level also aligns with the 50-day moving average (SMA50), which adds extra strength to the support.
In the short term, if the index holds above 23,700 and forms a bullish reversal candle, a rebound toward 24,500–24,800 (the top of the channel) is likely. The stop loss for this bullish setup would be a confirmed breakdown below 23,400.
However, if selling pressure continues and the price closes below 23,400, it could trigger a deeper correction toward 22,800–23,000, signaling a potential trend shift in the medium term.
From a long-term perspective, as long as the DAX remains above 23,000, the broader trend stays bullish, with next major upside targets around 25,000–25,500.
In short, the current area represents the dividing line between a continuation of the uptrend and the beginning of a medium-term correction in the German market.
Nasdaq’s Battle at the Golden Support!On the NASDAQ 100 (NDX) chart, the index has pulled back after a strong rally to around 26,000, now testing a critical support zone near 25,000–25,200. This area is technically significant because it aligns with three key factors:
1. The main ascending trendline (blue line)
2. The 50-day moving average
3. A previous horizontal support level
In the short term, if the index holds above 25,000 and forms a bullish reversal candle, it could rebound toward the next resistance around 26,200–26,500. The stop loss for this bullish scenario would be a confirmed breakdown below 24,800.
However, if the price drops below 24,800 and stays there, a deeper correction toward 23,800–24,000 becomes likely — which aligns with the lower boundary of the medium-term channel.
From a long-term perspective, as long as the index trades above its 50-day moving average (currently around 20,300), the primary trend remains bullish, with potential upside targets between 27,000 and 28,000.
In short, this current zone represents the dividing line between trend continuation and a medium-term correction for the Nasdaq 100.

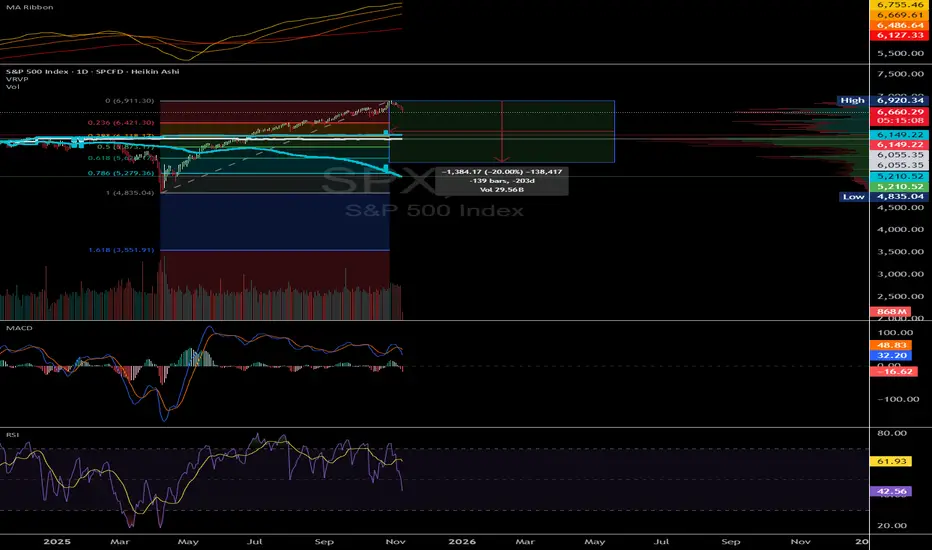
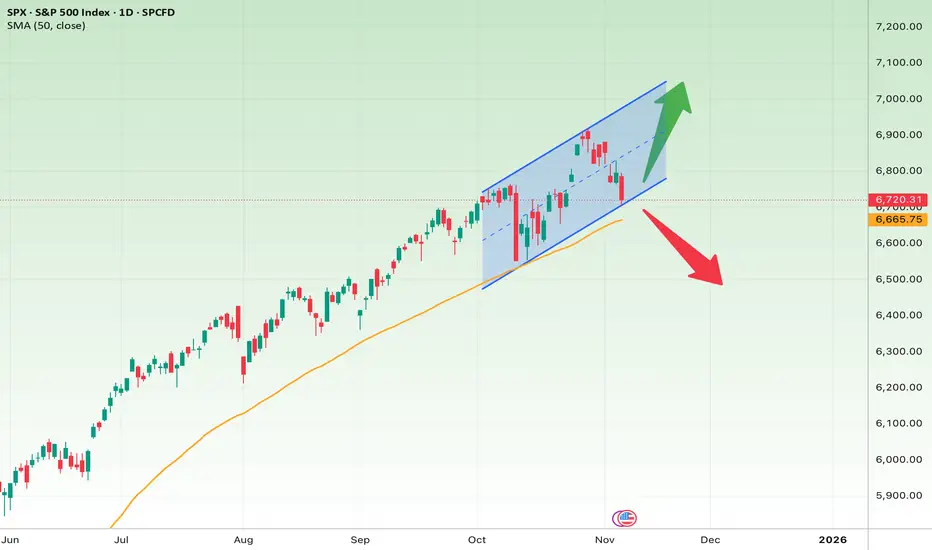
S&P 500 Index (SPX) — Daily Chart AnalysisThe S&P 500 is moving within a well-defined ascending channel on the daily timeframe. After touching the top of the channel, the index entered a short-term correction and is now testing the mid-channel area and the 50-day moving average (around 6,665) — both key support zones.
Short-Term Outlook (next few days to weeks)
If the index holds above 6,660–6,700 and starts to rebound, the next target would likely be the 6,950–7,000 resistance area near the top of the channel.
However, if 6,650 breaks and the price closes below it, a deeper pullback toward 6,450 or even 6,300 could follow.
• Bullish target: 6,950–7,000
• Bullish stop loss: Below 6,650
• Bearish target: 6,450–6,300
• Bearish stop loss: Above 6,800
Mid-Term Outlook (1–3 months)
The broader trend remains bullish, as the 50-day moving average still slopes upward. As long as the price stays above this line, the market structure remains positive.
If the upward channel holds, the next potential targets lie between 7,100 and 7,200.
But a confirmed breakdown below 6,650 could signal a shift in momentum toward a larger correction.
• Bullish mid-term target: 7,100–7,200
• Mid-term stop loss: Below 6,650
Summary :
The 6,660–6,700 range is the key zone to watch:
• Holding above it → continuation of the uptrend toward the channel’s upper boundary
• Breaking below it → possible decline toward the lower channel or deeper correction
In short, this area acts as the line between continuation and correction for the S&P 500.
Bitcoin - Deathcross is coming!Bitcoin has shown a strong move over the past week, reaching the predicted downside target.
The price action is currently hovering around key technical levels that influence market sentiment on both higher and lower timeframes.
Recap of Last Week
Last week, it was noted that BTC had made a liquidity sweep, inversed the bullish daily FVG, and formed a fake-out, all pointing toward further downside movement. The target was set just above $103,000, and this was convincingly reached, with a decline of roughly 7–10%. The prediction played out accurately, and the market clearly demonstrated that the bears remain in control.
Daily Timeframe
On the daily timeframe, it’s notable that the major low around $98,000 has not yet been taken out. At the same time, BTC is trading below a strong resistance zone just above the current price.
This area will be difficult to break and could create downward pressure, making a sweep of the $98,000 level more likely. However, if BTC manages to reclaim these resistance zones, sentiment could shift to a more bullish outlook, but for now, the bears are still in charge.
4h Timeframe
On the 4-hour timeframe, there’s a 4h FVG located just above the current price.
From a technical standpoint, this is a logical area for a potential rejection.
The expectation is that BTC will first move up toward this FVG before facing a rejection and then drop again toward the $98,000 zone.
Death Cross
A death cross may form within the next 1–2 weeks, occurring when the 50-day MA crosses below the 200-day MA. This is a well-known bearish signal, but historically, it often appears toward the end of a downtrend. In this cycle, we’ve already seen three death crosses, all of which either marked or came close to marking a bottom.
However, during 2017 and 2021, death crosses also appeared at the end of bull markets — followed by a sharp decline, and then a relief rally that pushed prices back above the death cross level. Therefore, it’s crucial to stay alert to whether this signals the end of the bull market or rather a final shakeout before a new rally.
Conclusion
BTC has reached the expected downside target and is currently trading below strong resistance. It’s likely that BTC will first test the 4h FVG and then move toward the $98,000 zone.
The upcoming death cross could add pressure, but historically, such signals often mark the end of a downward phase. The coming weeks will be crucial in determining whether this is a deeper correction or the start of a new bullish impulse.
-------------------------
Thanks for your support. If you enjoyed this analysis, make sure to follow me so you don't miss the next one. And if you found it helpful, feel free to drop a like 👍 and leave a comment 💬, I’d love to hear your thoughts!

Short_INDIAN HOTELHi traders,
Currently INDHOTEL trading @ 1Month low with breakdown at 200 EMA.
Pros for short set-up:-
* Bad results.
* Stock below 200 EMA.
* Breakdown after 1month consolidated in 1Day timeframe.
*Index is weak ( nifty Tourism Index ).
Cons:- Options premiums are high to enter buy side in PE.
* Low call premiums for Nov-2025 and December -2025.
* Better to trad in Futures.

Meta Could Be OversoldMeta Platforms plunged after its last quarterly report on October 29, but some traders may think the social-media giant is oversold.
The first pattern on today’s chart is the May 23 weekly close of $627.06. Prices tested and held the level on Tuesday and Wednesday, which could make some traders think support is emerging.
Second, stochastics recently fell to its lowest level since February 2022. Wilder’s Relative Strength Index (RSI) reached its lowest level since November 2022. Those readings may suggest that oversold conditions have occurred.
Third, the stock is below its 200-day simple moving average (SMA) for the first time since May 1.
Finally, META is an active underlier in the options market. That could help traders take positions with calls and puts.
TradeStation has, for decades, advanced the trading industry, providing access to stocks, options and futures. If you're born to trade, we could be for you. See our Overview for more.
Past performance, whether actual or indicated by historical tests of strategies, is no guarantee of future performance or success. There is a possibility that you may sustain a loss equal to or greater than your entire investment regardless of which asset class you trade (equities, options or futures); therefore, you should not invest or risk money that you cannot afford to lose. Online trading is not suitable for all investors. View the document titled Characteristics and Risks of Standardized Options at www.TradeStation.com . Before trading any asset class, customers must read the relevant risk disclosure statements on www.TradeStation.com . System access and trade placement and execution may be delayed or fail due to market volatility and volume, quote delays, system and software errors, Internet traffic, outages and other factors.
Securities and futures trading is offered to self-directed customers by TradeStation Securities, Inc., a broker-dealer registered with the Securities and Exchange Commission and a futures commission merchant licensed with the Commodity Futures Trading Commission). TradeStation Securities is a member of the Financial Industry Regulatory Authority, the National Futures Association, and a number of exchanges.
Options trading is not suitable for all investors. Your TradeStation Securities’ account application to trade options will be considered and approved or disapproved based on all relevant factors, including your trading experience. See www.TradeStation.com . Visit www.TradeStation.com for full details on the costs and fees associated with options.
Margin trading involves risks, and it is important that you fully understand those risks before trading on margin. The Margin Disclosure Statement outlines many of those risks, including that you can lose more funds than you deposit in your margin account; your brokerage firm can force the sale of securities in your account; your brokerage firm can sell your securities without contacting you; and you are not entitled to an extension of time on a margin call. Review the Margin Disclosure Statement at www.TradeStation.com .
TradeStation Securities, Inc. and TradeStation Technologies, Inc. are each wholly owned subsidiaries of TradeStation Group, Inc., both operating, and providing products and services, under the TradeStation brand and trademark. When applying for, or purchasing, accounts, subscriptions, products and services, it is important that you know which company you will be dealing with. Visit www.TradeStation.com for further important information explaining what this means.

IQ is looking bullish with a strong momentumGood momentum and bouncing right off the supporting trnd line. Golden cross recently occured in its most bullish form - 50/200 smas.

Gold at Its Golden SupportThe daily chart of GOLD shows that after a strong rally from around $3,200, the price has now pulled back toward the 50-day moving average (around $3,860) — a level that has repeatedly acted as a key support over the past several months, sparking multiple upward waves each time.
Short-Term Outlook (next few days to weeks):
In the short term, the $3,850–$3,880 zone is a crucial support area. If gold holds this level and closes above $4,050, a new bullish wave toward $4,250–$4,380 could begin.
However, a confirmed break below $3,850 could trigger a deeper correction toward $3,600 or even $3,400.
• Bullish short-term target: $4,250–$4,380
• Bullish stop loss: Below $3,840
• Bearish short-term target: $3,600–$3,400
• Bearish stop loss: Above $4,050
Long-Term Outlook (1–3 months):
The broader trend remains bullish — the 50-day moving average is sloping upward, and every pullback to this level has so far attracted buyers.
If the price manages to reclaim and sustain above $4,100, the next major target lies in the $4,400–$4,500 range, potentially marking new all-time highs.
Conversely, if gold loses support at $3,850 and consolidates below it, the trend could shift from bullish to neutral, with possible downside toward $3,400.
• Bullish long-term target: $4,400–$4,500
• Long-term stop loss: Below $3,850
In summary, $3,850 is the golden support zone — holding above it could ignite the next leg of the rally, while a breakdown below it might open the path for a deeper correction toward $3,600–$3,400.

Apple at Historical ResistanceThe Apple (AAPL) daily chart shows that after a strong rally from around $220, the stock has now reached a major resistance zone near $260, where heavy selling pressure has appeared. How the price reacts to this level will likely determine the next medium-term trend.
Short-Term Outlook (next few days to weeks):
In the short term, the $259–$260 zone is a key support/resistance area. If the price manages to hold and close above it, a continuation toward $280–$290 is likely.
However, if it fails to sustain this level and breaks below $259, a short-term correction toward $250–$245 (around the 50-day SMA) could follow.
• Bullish short-term target: $280–$290
• Bullish stop loss: Below $258
• Bearish short-term target: $250–$245
• Bearish stop loss: Above $265
Long-Term Outlook (1–3 months):
The broader trend remains bullish, supported by an upward-sloping 50-day moving average and consistent higher highs. A confirmed breakout and close above $260 would likely fuel a new leg higher toward $300–$310.
On the downside, if the stock loses support around $245, a deeper pullback toward $230 could occur.
• Bullish long-term target: $300–$310
• Long-term stop loss: Below $245
In summary, Apple is at a critical decision point — sustained strength above $260 could launch a new rally phase, while a breakdown below it might trigger a healthy short-term correction toward the 50-day moving average.

AVAX seems ready to pump, bullish on multiple chartsFrom what I can tell, AVAX seems to have bottomed out or at the very least is unlikely to go much lower. There's a bullish divergence on the monthly RSI vs BTC. Against gold AVAX definitely seems to have reached some sort of bottom.
And recently Trump had a huge pump, and I was curious to see how AVAX looks against trump and saw this on the daily, the price has hit the 200 daily moving average vs Trump so I'm curious how that is gonna play out too

#ARPAUSDT #1D (ByBit) Chuvashov's fork breakoutARPA did a V-shaped recovery with great increase in volume and about to regain 200MA support.
Golden cross seems around the corner, looks very likely to rally mid-term.
⚡️⚡️ #ARPA/USDT ⚡️⚡️
Exchanges: ByBit USDT
Signal Type: Regular (Long)
Leverage: Isolated (2.0X)
Amount: 4.6%
Entry Targets:
1) 0.02233
Take-Profit Targets:
1) 0.03456
Stop Targets:
1) 0.01743
Published By: @Zblaba
$ARPA BYBIT:ARPAUSDT.P #1D #DeFi arpanetwork.io
Risk/Reward= 1:2.5
Expected Profit= +109.5%
Possible Loss= -43.9%
Estimated Gaintime= 1-2 months
