BTCUSDT // Prices are trending upward as long as they remain above the Kaufman indicator on the daily timeframe. On the weekly timeframe, pay attention to the Kaufman resistance level.
Moving Averages

gold end weekHi.
boring week we had.
but :
It's the time to reach Daily Moving average 45.
if we dont see it today, I promise you we will have gold over 4500.
Stay safe

BTC has finally flipped bullish on the daily chart.FG{50/15} histogram has turned green on the daily chart.
Red 21 EMA about to cross above the green 50 SMA.

Ethereum Inside the Decision ChannelShort-Term Technical Analysis (Days to Weeks)
On the daily timeframe, ETH is trading inside a large ascending channel (purple box). After a decline from the channel’s upper boundary, price is now sitting near the mid-channel support and internal dashed trendline, aligned with the moving average (orange). This area represents a critical decision zone.
Bullish Short-Term Scenario:
A sustained move above $3,150–$3,200 and a bullish reclaim of the moving average could trigger a new upward leg toward the upper channel boundary.
Bearish Short-Term Scenario:
Failure to hold above $3,000 and a breakdown of the internal trendline could open the door for a deeper pullback toward the channel low.
Short-Term Target:
$3,800–$4,200
Short-Term Stop-Loss:
Daily close below $2,900
Long-Term Technical Analysis (Months to 1 Year)
From a broader perspective, ETH remains structurally bullish but range-bound. Price action inside the channel suggests controlled accumulation/distribution rather than a strong directional trend.
Bullish Long-Term Scenario:
A confirmed breakout above the ascending channel could launch ETH into a powerful trending phase with new all-time targets.
Bearish Long-Term Scenario:
A breakdown below the channel floor would signal structural weakness and a deeper corrective phase.
Long-Term Target:
$5,200–$5,800
Long-Term Stop-Loss:
Structural break below $2,300
Fundamental Analysis (Brief)
Ethereum remains the backbone of the Web3 ecosystem:
• Growing adoption of DeFi, NFTs, and Layer 2 solutions
• Net supply reduction through fee-burning mechanisms
• Potential institutional inflows via ETH-based ETFs
• Core infrastructure for smart contracts and tokenized economies
Key risks include L1 competition and broader crypto market conditions.
Final Takeaway
ETH is sitting at a major inflection zone:
• Holding mid-channel support favors a move higher
• Breakdown increases downside risk toward channel lows
At this level, waiting for confirmation offers the best risk-to-reward setup.

DAM Capital Base Formation After Correction Risk Reward SetupTechnicals:
Trading in a broader sideways to range-bound structure after a sharp correction earlier in the year following that decline, the stock has spent time absorbing supply and recently found strong support in the ₹205–212 zone. The latest bounce from this area has formed a short-term higher low on the daily chart, indicating improving price stability rather than fresh selling pressure.
Price is currently hovering around ₹219–222, with the EMA flattening and price attempting to hold above it. This suggests a transition from a weak phase into base formation. structurally, the stock is moving toward a descending trend-line zone around ₹255–265, which aligns with a prior supply area. This zone is likely to act as the first major reaction area. From a risk-reward perspective, the setup favors a controlled pullback trade, with upside potential toward ₹275–300, while downside risk remains protected around ₹190, which marks the last strong demand and structure invalidation zone.
Momentum is also improving. RSI has recovered from oversold conditions and is now sustaining above the 50 level, pointing toward a shift from bearish to neutral-to-positive momentum. As long as price holds above the ₹212 support band, the bias remains constructive for a measured upside retracement toward higher resistance.
Fundamentals:
Operates as a financial services and investment banking firm, with revenues closely linked to capital market activity, deal flow, and overall market sentiment. after a strong listing and initial enthusiasm, the stock corrected sharply as market expectations normalized and broader mid-cap financial stocks saw valuation compression.
fundamentally, the business remains sensitive to equity market cycles, IPO activity, and advisory volumes periods of consolidation or lower market participation tend to reflect in muted earnings visibility, which explains the prolonged sideways movement in price however, as market activity stabilizes and risk appetite improves, earnings can recover relatively quickly due to the asset-light nature of the business.
At current levels, the stock appears to be transitioning from expectation reset to valuation discovery. The recent stabilization in price near long-term support suggests that downside risk is being gradually priced in, while the market waits for clearer earnings consistency and deal momentum. Any pickup in capital market activity, stronger quarterly numbers, or improvement in advisory pipeline could act as a catalyst for a re-rating, which would align with a breakout attempt above the descending trend-line on the chart.
Levels to watch
Support zone: ₹205–₹212
Risk protection / invalidation: ₹190
First reaction zone: ₹250–₹255 (trend-line and supply confluence)
Upside extension targets: ₹275–₹300
Like, comment your thoughts, share this post
Explore more stock ideas on the right hand side!
Disclaimer: This post is for educational purposes only and should not be considered a buy/sell recommendation.

SOONUSDT // Inverse head and shoulders formationThe chart shows an inverse head and shoulders pattern, but our first target point is 0.4095, which corresponds to the Fibonacci 1.414 level of the breakout. If we see a close above this level, the main target is 0.4420.

RIFUSDT //Inverse head and shoulders formationThe chart shows an inverse head and shoulders pattern, but the formation condition is to look for closing prices above the yellow line. Our first target point is 0.04034, which corresponds to the Fibonacci 1.414 retracement of the breakout. If we see closing prices above this level, the main target is 0.04471.

Gold/Silver Ratio AnalysisSince 2007, the Gold/Silver ratio has been moving in certain patterns. Although the ratio generally tends to rise, we can see significant volatile deviations from time to time. These deviations present us with good opportunities. We are currently experiencing one of these opportunities.
The overall uptrend in the chart means that gold has generally outperformed silver. The sharp increases in 2008 and 2020 also point to periods when gold significantly outperformed silver.
In 2010, the second half of 2020 and the period we are currently experiencing, silver has significantly outperformed gold, causing the chart to fall.
But there is a common point in both periods. After every period of extreme volatility, the Gold/Silver ratio tends to converge towards the average. This will likely be no different now. So what does this indicate?
As we all know, silver has gained significant momentum, pushing the Gold/Silver ratio up to 60. While there's a possibility the ratio could fall back to 50 in the coming months with continued momentum, a Hodrick Prescott filter shows a significant negative deviation from the normal average. This means that the time for convergence with the average is slowly approaching. So how will this convergence scenario unfold? In two ways:
1. Either silver won't experience a decline, but gold will rise significantly with buying pressure and momentum.
2. Or, while gold remains stable or continues its uptrend slightly, silver will fall significantly.
I particularly think the scenario where silver falls due to profit-taking (and it's pretty overbought) more likely. During this period, gold may continue its gradual rise, which could bring the Gold/Silver ratio back into an overall trend free from volatility.

BIDU // Inverse head and shoulders formationThe chart shows an inverse head and shoulders pattern, but the formation requires closing above the yellow line. If this condition is met, the first target of the pattern is the breakout level at 187.26, which corresponds to the Fibonacci 1.414 level. If the price remains above this level, the main target is 224.73.

Put Sale MSFTI wan to own at the 200SMA. If drops, its a great bouncing are, but if MSFT decides to keep its way up, then I'll keep premium :)


Bread Financial Holdings, Inc. (NYSE) — Swing Trade Idea💰 BFH — Swing Trade Idea
Bread Financial Holdings, Inc. (NYSE)
🏢 Company Snapshot
• Consumer finance and payments company (private-label credit cards, BNPL, loyalty solutions)
• Matters now due to sustained relative strength in Financials and a clean trend resumption after a controlled pullback from highs
📊 Fundamental Context (Trade-Relevant Only)
• Valuation: Discount to broader Financials on P/E, reflecting conservative expectations
• Balance Sheet: Deleveraging trend post-spin, liquidity remains adequate
• Cash Flow: Stable to improving with normalization in credit conditions
• Dividend: Present but secondary to price action
Fundamental Read: Fundamentals are not a catalyst but provide downside support while price leads the thesis.
🪙 Industry & Sector Backdrop
• Short-Term (1–4 weeks): Financials showing rotation strength vs SPX
• Medium-Term (1–6 months): Select consumer finance names outperforming on risk normalization
• Macro Influence: Stable rates supportive for credit spreads
Sector Bias: Bullish
📐 Technical Structure (Primary Driver)
• Trend: Strong uptrend; price above rising 50-SMA and well above 200-SMA
• Momentum: RSI(2) recently reset into oversold and is rebounding — classic mean-reversion within trend
• Pattern: High-tight advance followed by orderly pullback into prior breakout zone
• Volume: No heavy distribution; pullback volume lighter than advance
Key Levels
• Support: 73.50 – 74.00 (prior breakout + 50-SMA confluence)
• Resistance: 78.80 – 79.20 (recent highs / measured continuation)
🎯 Trade Plan (Execution-Focused)
• Entry: 73.80 – 74.30 (reaction buy at trend support)
• Stop: 71.50 (loss of structure and 50-SMA invalidates)
• Target: 79.10 (prior high / continuation objective)
• Risk-to-Reward: ~2.6R
Alternate Scenario:
If price loses 74 on closing basis, stand aside and reassess near 70.50–71.00 (next demand + rising structure).
🧠 Swing Trader’s Bias
Price remains in a controlled uptrend with RSI(2) resetting into support. I’m looking for a clean reaction off the 50-SMA to target prior highs for a ≥2R continuation swing. A decisive close below 71.50 invalidates the setup.

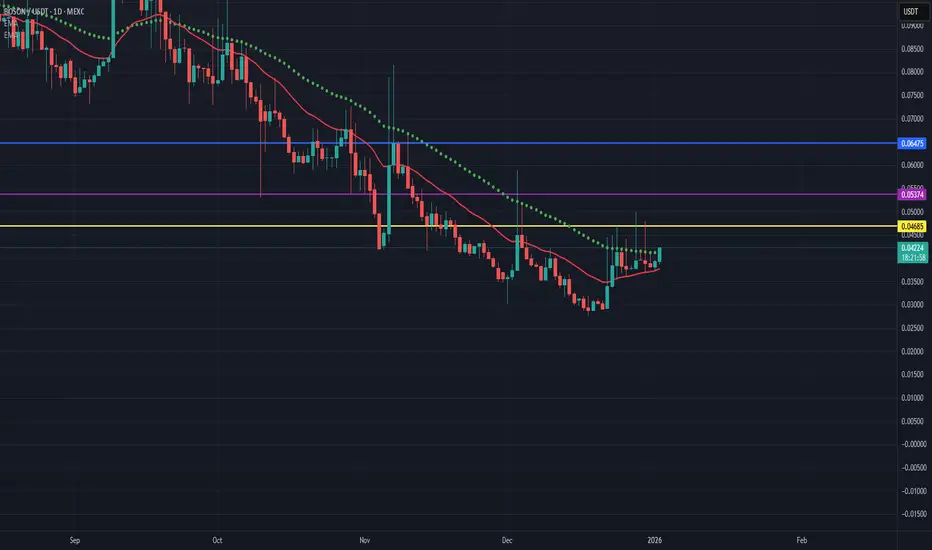
BOSONUSDT // Inverse head and shoulders formationThe chart shows an inverse head and shoulders pattern, but the formation condition is to look for closing prices above the yellow line. If this condition is met, the first target is 0.05374, which corresponds to the Fibonacci 1.414 level of the breakout. If we see closing prices above this level, the main target is 0.06475.
TVTX - Breaks a 10-Year High – A New Chapter BeginsTVTX - CURRENT PRICE : 38.21
TVTX has made a major technical breakout by moving above its 10-year high at $37.04, a level last seen in August 2015. This move places the stock firmly into price discovery, meaning there is no nearby historical resistance overhead. Importantly, the breakout is holding, with the previous resistance now acting as strong support, a key sign of a healthy and sustainable uptrend.
Looking back, the 24 December breakout can be viewed as an ascending triangle breakout, where price consistently made higher lows before finally pushing above resistance. This pattern often signals strong accumulation and continuation rather than a short-term spike. Trend indicators remain supportive, with price trading above the EMA 50 and above the Ichimoku Cloud, both pointing to a well-established bullish trend.
From a price action perspective, the latest candlestick structure has formed a Bullish Harami based on Japanese candlestick analysis , suggesting selling pressure is fading and buyers may be preparing for the next move higher. As long as TVTX continues to hold above the former resistance zone and the EMA 50 on a daily closing basis, pullbacks are considered buy-on-dip opportunities. The next upside targets are $42 followed by $45, while a daily close below the EMA 50 would invalidate the bullish setup and serves as a cut-loss level.
ENTRY PRICE : 38.21
FIRST TARGET : 42.00
SECOND TARGET : 45.00
SUPPORT : EMA 50 (Cutloss if price closed below EMA 50)

Silver on the EdgeShort-Term Technical Analysis (Hours to Days)
On the 1-hour timeframe, XAGUSD has entered a corrective consolidation phase after a strong bullish move. The current structure resembles a descending triangle / corrective wedge, with price holding above a key horizontal support around $70–71.
The moving average (orange line) still acts as dynamic support, though its flattening slope indicates reduced short-term momentum.
Bullish Short-Term Scenario:
A confirmed breakout above $71.80–$72 and a break of the descending trendline could trigger a new bullish leg.
Bearish Short-Term Scenario:
A clean break and close below $70 would turn the consolidation into a bearish breakdown.
Short-Term Target:
$76–$78
Short-Term Stop-Loss:
Close below $69.80
Long-Term Technical Analysis (Weeks to Months)
From a broader perspective, silver remains in a strong bullish trend. The current pullback appears to be a healthy correction after a sharp rally. As long as price holds above the $68–69 support zone, the bullish structure remains intact.
Bullish Long-Term Scenario:
Holding key support and breaking recent highs could accelerate the bullish move.
Bearish Long-Term Scenario:
A breakdown below $68 would signal structural weakness and a deeper correction.
Long-Term Target:
$82–$85
Long-Term Stop-Loss:
Below $66
Fundamental Analysis (Brief)
Silver combines safe-haven characteristics with strong industrial demand:
• High usage in solar energy, electronics, and EV industries
• Positive correlation with inflation and loose monetary policy
• High sensitivity to interest rates and USD strength
Rate cuts or USD weakness often act as strong bullish catalysts for silver.
Final Takeaway
XAGUSD is at a critical inflection point:
• Trendline breakout → bullish continuation
• Support breakdown → deeper correction
Waiting for confirmation is key at this level.

USDCAD short term sell USDCAD broke and now is retesting a good S/R zone in which price bounced like 7+ times in the past 6-7 months.
Im selling here from 4H EMA and from this tight little zone formed from previous 4 touches. TP is the bottom of the leg, which gives plenty of room for the price to move

Is Vishnu Chemicals gearing for a breakout of its 15Y channel?TL;DR: The Double Breakout Alignment
Vishnu Chemicals is currently exhibiting a rare confluence of multiple timeframes. We are seeing
a) Macro : a 3.5Y pre-breakout channel buildup at the boundary of a massive 15-year ascending channel
b) Medium term : within the aforementioned 3.5Y channel, we see a 6-month horizontal pre-breakout buildup occurring inside a 1.5-year horizontal range.
When these "gears" align at a major resistance, the potential for a structural transition is at its peak.
THE ANALYSIS
We use a three-step top-down filter to determine if a stock has the necessary macro tailwinds before zooming into the technical "readiness" of the setup.
Step 1: The "Forest to the Trees" Filter (Are there tailwinds)
The Forest (Nifty 50): The broad market remains structurally robust, coiling near record highs and positioned for a potential Stage 1 (basing/accumulation) to Stage 2 (uptrend) breakout.
The Trees (Chemical Sector): Selective chemicals are showing high relative strength as they transition out of multi-year bases.
Conclusion: Market conditions are ripe to look for strong setups in quality chemical stocks
Step 2: Big Picture Placement (Weinstein Stage Analysis)
We use the Monthly chart to identify the stock's dominant long-term structures.
The 15-Year Super-Channel: VISHNU has been operating within a dominant ascending channel stretching back to 2008. This macro structure acts as our primary roadmap.
The 3.5-Year Coiling: Since 2022, the stock has been coiling in a secondary 3.5-year ascending channel. Crucially, this absorption has been occurring at the boundary of the 15-year macro range. This looks like a "prebreakout buildup" before price decisively leaves the macro channel behind.
In stage analysis terms - it looks like a stock ready to break from a continuation pattern into strong uptrend (Stage 2)
Step 3: Near-Term Structure & Signal (pre-breakout PA analysis)
We zoom in on the price action of the last few years to gauge the "readiness" of the breakout.
The 1.5-Year Range: Price has spent ~546 days in a horizontal range
The 6-Month Pre-Breakout Buildup (PBO): A critical signal is the PA of the last 6 months - we see a tight buildup right at the ceiling of the 1.5-year range, and importantly, above an upsloping 20-month EMA.
The 2-Month Squeeze: The last 2 months (Nov & Dec 2025) especially are very interesting - tight bodied "doji" candles & extremely low volumes.
These 3 elements : a clearly defined range + prebreakout buildup + tightening squeeze - all make this a prime candidate for a potential breakout.
Step 4: Key Fundamental Drivers
Niche Monopoly: India’s largest and a top 4 global manufacturer of Chromium chemicals (~60% domestic market share). High entry barriers due to complex chemistry and environmental regulations.
The "Jan 2026" Trigger: Completion of the South African Chrome Mine acquisition (scheduled for Jan 2026). This is a massive backward integration move that secures 30 years of raw material and insulates margins from volatile global ore prices.
De-leveraging Success: A masterclass in debt management; Debt-to-Equity has plummeted from over 1.5 to ~0.25 in recent years.
Earnings Momentum: Q2 FY2025-26 saw a 44% YoY surge in Net Profit, significantly outpacing revenue growth (~18%), proving that operational leverage is kicking in.
The Gist: We are witnessing a 6-month squeeze inside a 1.5-year range, which is part of a 3.5-year coiling phase—all occurring at the boundary of a 15-year macro channel. When these "gears" align at a major resistance, the resulting resolution is typically powerful and structural.
Timeframe: Monthly. Patience is key as this macro resolution unfolds.
Disclaimer: This analysis is for educational purposes only and does not constitute financial advice. Market investments are subject to risk; please consult a SEBI-registered advisor and perform your own due diligence before making any decisions.

Gold (XAUUSD) Scalp: Rejection at the 0.618 Golden PocketOANDA:XAUUSD Since it is the end of 2025 and Gold has just come off its all-time highs near 4,550, this pullback to the 4,327 level is a major technical event.
Here is a more aggressive, Scalping-focused TradingView post with a high Risk-to-Reward ratio:
⚡️ Gold (XAUUSD) Scalp: Rejection at the 0.618 Golden Pocket
Current Market Context:
Gold is ending 2025 with significant volatility. After hitting record highs, we are seeing a sharp corrective phase. The 4H chart shows price action stalling at the 4,330 - 4,350 zone, which perfectly aligns with the Fibonacci 0.618 "Golden Pocket" retracement.
🎯 The Setup (High Risk/Reward)
* Strategy: Bearish Rejection Scalp
* Timeframe: 4H (Confirmation on 15m/30m)
* Entry Price: 4,327.00 - 4,332.00
* Stop Loss (SL): 4,355.00 (Tight SL just above the 0.618 Fib line)
* Take Profit (TP): 4,240.00 (Major support target)
* Risk-to-Reward Ratio: ~1:3.5
🔬 Technical Catalyst:
* Fibonacci Resistance: The price failed to sustain above the 0.705 (4,365) level and is now breaking below the 0.5 (4,339) level.
* Bearish Momentum: Looking at the bottom oscillator, the momentum is shifting negative (-33.33 value shown), indicating that sellers are regaining control for the New Year session.
* Liquidity Gap: There is a clear "void" below 4,316. A break here could lead to a rapid flush towards the 4,280 psychological level.
🚦 Execution Plan:
* Conservative: Wait for a 4H candle to close below 4,320 before entering.
* Aggressive: Enter at current levels (4,327) with a stop at the recent swing high (4,355).
Final Note for 2025: As we approach the market close, liquidity might be thin. Expect "wicky" price action. Manage your risk accordingly!
#GoldScalp #XAUUSD #TradingStrategy #PriceAction #FibonacciTrading #2026Outlook

BNB at a CrossroadsShort-Term Technical Analysis (Few days to 3 weeks)
On the daily timeframe, BNB price is approaching a key resistance zone around $870–$880, where a descending moving average meets horizontal resistance. This area represents a critical decision point for price action.
Bullish Short-Term Scenario:
A daily close above $880 would signal strength and open the path toward higher resistance levels.
Bearish Short-Term Scenario:
Failure to break above $880 could trigger another pullback toward the ascending trendline and lower support zones.
Short-Term Target:
$950–$980
Short-Term Stop-Loss:
Daily close below $840
Long-Term Technical Analysis (1–6 months)
From a broader perspective, BNB is still trading within a range with a bullish bias. The ascending black trendline acts as a major dynamic support. As long as price stays above it, the long-term bullish structure remains valid.
Bullish Long-Term Scenario:
A confirmed breakout above $900 could start a new impulsive rally toward previous highs.
Bearish Long-Term Scenario:
A clean break below the ascending trendline would invalidate the bullish structure and signal deeper correction.
Long-Term Target:
$1050–$1100
Long-Term Stop-Loss:
Below $800
Fundamental Analysis (Brief)
BNB benefits from strong fundamentals:
• Core utility within the Binance ecosystem
• Regular BNB token burns reducing circulating supply
• Expanding DeFi and Web3 adoption on BNB Chain
However, regulatory pressure on Binance and overall crypto market conditions remain key risk factors.
Final Takeaway
BNB is sitting at a critical inflection zone.
• Holding above resistance confirms bullish continuation
• Rejection leads to another corrective phase
Patience and confirmation are essential at this level.

$MSOS $6 Feb 20th Calls First time publishing an option chart on tradingview pretty cool they added this! Lets see where this goooz! 30Min Chart on MSOS 20 Feb 2026 Call 6

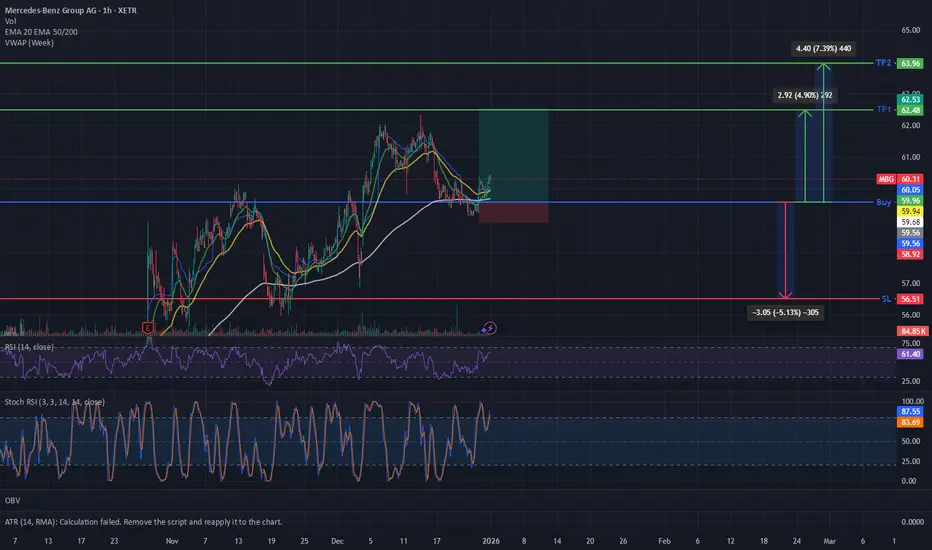
Swing Trading (D1 / H4) – Trend Following + Mean Rever📈 Swing Trading Strategy (D1 / H4) XETR:MBG
Trend Following with Controlled Pullback Entries
🧠 Core Concept
This strategy is designed to trade in alignment with the dominant uptrend, entering positions after a healthy pullback toward fair value.
The goal is to capture the next impulsive leg of the trend while keeping risk strictly predefined and asymmetric.
⏱ Timeframes
Primary: Daily (D1)
Confirmation / Timing: H4
🔧 Indicators Used
EMA 20 / EMA 50 / EMA 200 – trend structure and dynamic support
Weekly VWAP – fair value / institutional reference
RSI (14) – trend strength and momentum filter
Stochastic RSI (14,14,3,3) – entry timing
OBV – volume confirmation (accumulation vs distribution)
🟢 Trend Filter (Mandatory)
Only LONG positions are considered when all conditions are met:
Price is above EMA 200
EMA 20 is above EMA 50
Market structure shows higher lows
RSI (14) holds below 50
➡️ If any of these conditions fail, no trade is taken.
🎯 Entry Conditions (BUY)
A long position is considered after a pullback when:
Price retraces toward EMA 20 / EMA 50 or Weekly VWAP
Stochastic RSI resets from overbought and turns upward
RSI (14) remains below 50 (trend intact)
OBV does not make new lows, indicating no distribution
➡️ Entries are taken after bullish reaction, not blindly at levels.
🛑 Stop Loss (Risk Management – Important Note)
Primary SL is placed below the local pullback low
Structurally, SL remains below EMA 200 or key support
🎯 Take Profit Logic
TP1: Previous local high / resistance
TP2: Trend continuation target (approx. 1.5–2R)
If price fails to move as expected within two weeks, the position is manually closed
📐 Position Management
No averaging down
No re-entry without a new pullback structure
Trades are taken only when R:R ≥ 2:1
🚫 What This Strategy Avoids
Choppy ranges and low-volatility consolidation
Counter-trend trades
Buying below EMA 200
Indicator-only decisions without structure
🧩 Strategy Profile
Swing trading (several days up to ~2 weeks)
Low trade frequency
High selectivity
Zcash Poised for Next Move: Rally or Correction Ahead?Short-term Analysis (1–3 weeks):
• Current Situation: Price stabilized around $530 after testing the 50-day MA. Key short-term support.
• Bullish Scenario: Stabilization above $540 could push towards historical resistance at $700.
• Bearish Scenario: Breaking support at $500 may trigger a drop to $420–450.
Short-term Target: $700
Short-term Stop-loss: $500
Long-term Analysis (1–6 months):
• Current Situation: Uptrend intact but with high volatility. Staying above 50-day MA supports long-term bullish trend.
• Bullish Scenario: Break above $700 could lead to $900.
• Bearish Scenario: Losing monthly MA support may push price to $350–370.
Long-term Target: $900
Long-term Stop-loss: $350
Fundamental Summary:
• Zcash is a privacy-focused cryptocurrency with growing adoption in wallets and institutions.
• Tech adoption and network developments can drive bullish momentum.
• Regulatory pressures and crypto market risks may cause high volatility.
Summary :
• Key Support: $500 (short-term), $350 (long-term)
• Key Resistance: $700 (short-term), $900 (long-term)
• Stabilization above $540 favors bullish continuation; otherwise, a corrective move is likely.

GE Aerospace – Daily ChartMarket Structure
After a strong bullish trend, the stock experienced a V-shaped correction and rebounded back toward a key resistance zone. Price remains above the rising moving average, confirming that the primary trend is still bullish, but the current area is critical.
Short-Term Outlook
• Primary scenario:
The 316–318 zone is a major resistance. Price reaction here will define the next move.
• Key support:
300–295 zone, aligned with the moving average
• Bullish short-term targets (on breakout):
• 330
• 340
• Short-term stop loss:
Daily close below 295
• Bearish alternative:
Rejection from resistance may lead to a pullback toward 285–280
Mid / Long-Term Outlook
• Trend:
Bullish structure remains intact
• Price logic:
Recent move resembles a healthy pullback within a broader uptrend
• Long-term targets:
• First target: 350
• Extended target: 370 – 380
• Long-term invalidation:
Weekly close below 280
Fundamental Summary
• Strong exposure to aerospace and defense contracts
• Benefiting from global defense spending growth
• Long-term order backlog supports revenue stability
• Cyclical sensitivity, but solid structural growth outlook
