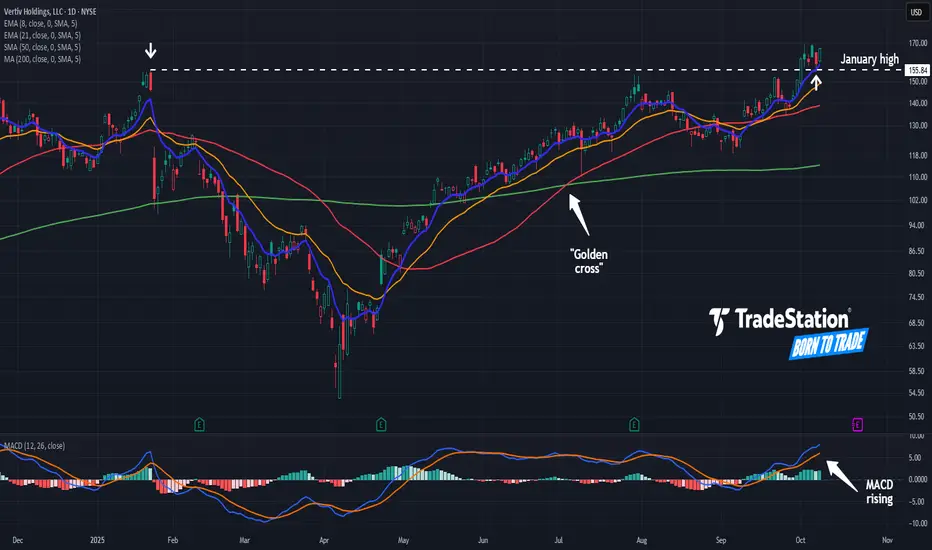
Vertiv May Have Broken OutVertiv was an early leader in the AI rally, and now it may be breaking out again.
The first pattern on today’s chart is the January high of $155.84. The provider of data-center power and cooling products began October by breaking above that level. This week, it pulled back to test it. Has old resistance become new support?
Second, prices wavered on either side of their 50-day simple moving average (SMA) for a few months and could now be accelerating from that line.
Third, the 50-day SMA had a “golden cross” above the 200-day SMA in July. That may suggest its longer-term uptrend is resuming.
Next, the 8-day exponential moving average (EMA) is above the 21-day EMA. MACD is also rising. Those signals may indicate the short-term trend has grown bullish again.
TradeStation has, for decades, advanced the trading industry, providing access to stocks, options and futures. If you're born to trade, we could be for you. See our Overview for more.
Past performance, whether actual or indicated by historical tests of strategies, is no guarantee of future performance or success. There is a possibility that you may sustain a loss equal to or greater than your entire investment regardless of which asset class you trade (equities, options or futures); therefore, you should not invest or risk money that you cannot afford to lose. Online trading is not suitable for all investors. View the document titled Characteristics and Risks of Standardized Options at www.TradeStation.com . Before trading any asset class, customers must read the relevant risk disclosure statements on www.TradeStation.com . System access and trade placement and execution may be delayed or fail due to market volatility and volume, quote delays, system and software errors, Internet traffic, outages and other factors.
Securities and futures trading is offered to self-directed customers by TradeStation Securities, Inc., a broker-dealer registered with the Securities and Exchange Commission and a futures commission merchant licensed with the Commodity Futures Trading Commission). TradeStation Securities is a member of the Financial Industry Regulatory Authority, the National Futures Association, and a number of exchanges.
TradeStation Securities, Inc. and TradeStation Technologies, Inc. are each wholly owned subsidiaries of TradeStation Group, Inc., both operating, and providing products and services, under the TradeStation brand and trademark. When applying for, or purchasing, accounts, subscriptions, products and services, it is important that you know which company you will be dealing with. Visit www.TradeStation.com for further important information explaining what this means.
Moving Averages
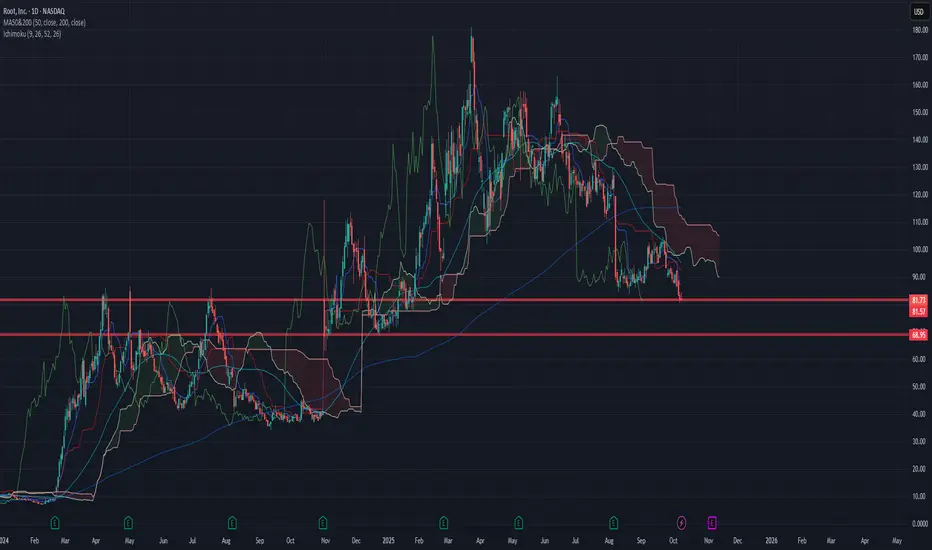
ROOT possible short playfound someone trying to pump this ticker on reddit.
i dont think its bad in the long term but this price structure needs to fix itself
that being said, quite likely we will fall more. puts at 69
Gold Minetghe gold is going crazy and the retail trader can't unpush the buy botton , its our way out thinking that the market in the US is shutting down everyone is running to buy gold , we follow the trend and aim for some new levels

A relatively Clear & Simple Bitcoin trading strategyRecently, I've noticed something. Something so simple that anyone with a simple EMA indicator can use, to achieve relatively clear, simple signals for BUYING & SELLING (or shorting) Bitcoin. Go ahead and backtest it to see what I mean.
Nearly everytime BTC crosses and closes above the EMA 33 line on the 6-hour chart Bitcoin goes much higher. And the opposite is also an effective SELL signal, as well. Go ahead and test it, I'll wait...
If Bitcoin does one of those sideways movements for a few weeks, just wait for the next clear signal instead of constantly buying and selling each time it crosses the EMA 33. It'll eventually separate and gain distance from the EMA and will start to be a clear signal again. Comments and Critics are welcome but be polite!

Retractable Technologies | RVP | Long at $0.76Retractable Technologies AMEX:RVP is a cyclical OTC stock that may be in a consolidation / accumulation phase for a major rise in the next 1-2 years. The reason this stock got my initial attention is the CEO bought $800,000 worth of shares over the last two years, with his buy range between $0.60 and $1.28. Pulling up the chart, my historical simple moving average (SMA) line seems to predict (quite well for this ticker) the sudden rise in price (i.e., as the SMA lines get closer to the price, there is a jump in price). The stock only has a 13.1 million float.
Between 2017 and 2019, the stock price consolidated near the levels seen during the last two years. Then, once my selected historical SMA reached the price, it jumped, consolidated further and rose to over $21.00... Now, I don't necessarily think the price will rise that high. There are currently two open price gaps on the daily chart (highest near $6.00) that may get closed.
I may be very early, on time, or the stock could go to zero. But if the CEO is going to risk that much for a current penny-play, I will dabble in the risk and simply be patient until SMA connects with the price.
Nothing to discuss regarding the fundamentals of this one (not great)... it's purely a technical analysis play.
Target #1 = $1.00
Target #2 = $1.25
Target #3 = $1.50
If it soars...
Target #4 = $4.18
Target #5 = $5.90

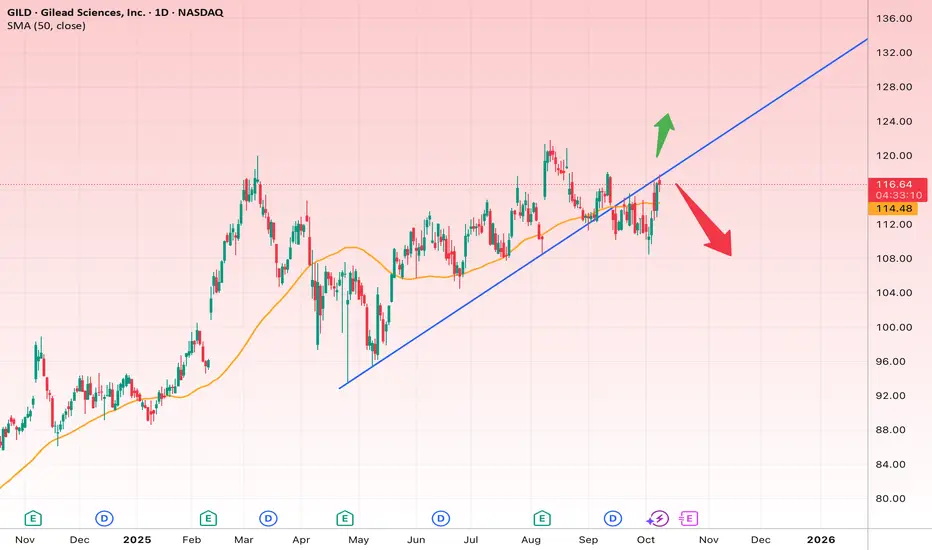
Gilead’s Critical Battle at the Uptrend Line!
Analysis:
The daily chart of Gilead Sciences (GILD) shows that the stock, after a short-term correction, is once again approaching its main uptrend line (blue). The 50-day moving average (orange) around $114.50 acts as a key support level, and the current price is trading slightly above it.
At this stage, the stock sits at a decisive point — it could either reclaim its bullish momentum by breaking above resistance or enter a deeper corrective phase if support fails.
Short-term outlook (2–4 weeks):
If the price manages to hold above $118, the next upside targets are in the $119.80–$124.80 range. This area represents the short-term bullish objective.
A reasonable stop loss for this scenario is just below $114.
Long-term outlook (2–3 months):
If the stock breaks decisively above $125 and maintains that momentum, the next major targets would be in the $130–$134 range, which also aligns with the previous highs.
However, if the blue uptrend line breaks down and a daily candle closes below $113, a bearish move toward the $106–$108 range becomes likely. In that bearish scenario, the stop loss should be placed above $113.
Overall, GILD is at a decision point. As long as it trades above $114, the bullish outlook remains valid — but losing that support could shift the balance in favor of the bears.
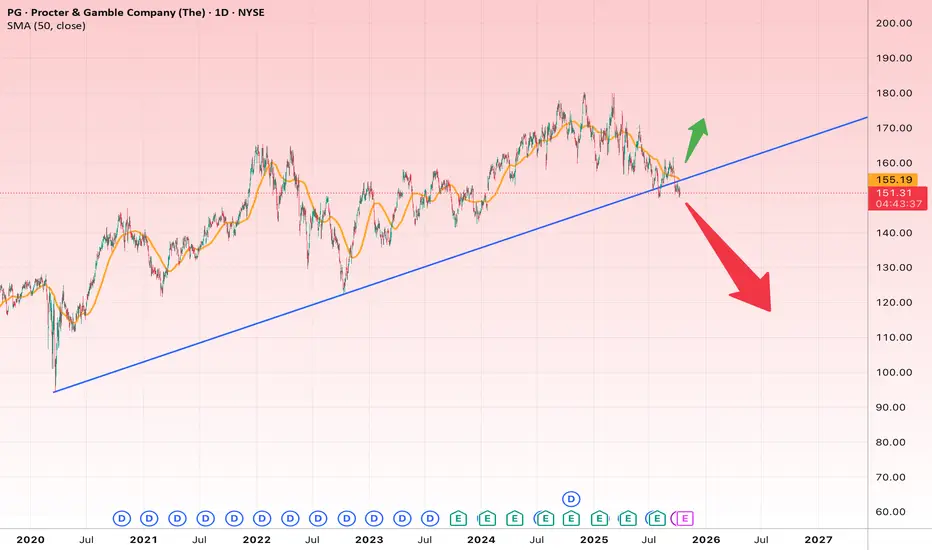
PG at the Edge: Break or Bounce?
🔹 Long-Term Overview
Since 2020, PG has been in a steady long-term uptrend, well supported by the rising blue trendline on the chart.
This trendline has acted as strong support multiple times in recent years — and once again, the price is testing it near the $150 zone.
This area is a make-or-break level for PG. Holding above it could trigger a new rally; breaking below could lead to a deeper correction.
⏳ Short-Term Outlook (1–3 months)
PG is currently trading below its 50-day moving average, showing short-term weakness.
However, it’s sitting right on the major trendline — meaning buyers may step in if this support holds.
Watch for a daily close to confirm direction:
A close above $155 would confirm a rebound toward $165–$170.
A close below $148 would signal a confirmed breakdown.
🎯 Short-Term Targets:
Bullish: $165 → $170
Bearish: $140 → $132
🛑 Stop-Loss:
For longs: below $148
For shorts: above $156
📈 Long-Term Outlook (6–12 months)
Two major scenarios are forming:
Scenario 1 – Trend Holds (Bullish)
If PG defends its long-term trendline, the broader uptrend remains intact.
This setup may evolve into a double-bottom formation, targeting new highs.
🎯 Long-Term Upside Targets:
First: $175
Second: $190
🛑 Stop-Loss: below $145
Scenario 2 – Trendline Break (Bearish)
If the weekly candle closes below $145, the four-year uptrend will be broken.
In that case, PG could retrace toward $130 or even $115–$110 in an extended correction.
🎯 Long-Term Downside Targets:
First: $130
Second: $115
🛑 Stop-Loss: above $155
Stock Influencers + 3-Step Rocket Booster Strategy Some days back there was a superstar actress that did an advertisement
For this company.
It was full of nice imagery,but then this ad caused that big Gap up you see
To the left of this chart?
This famous actress, Sydney Sweeney, 👖caused that gap 🤔
Influence is a big part of the financial markets.Maybe you are thinking
Becoming a trader means
You old school and you won't roll with the "latest" pop trends.
But that won't be the case.
Infact trading and pop culture are very much related.You will be shocked.
Just check the breakingnews tab below the price on tradingview.
Financial markets will always be a part of pop culture. Why?
Because entrepreneurs and investors always work together.
Remember that I actually noticed that one of my followers comes from the Andrew tate community.
Yes man, 😊 am a mini - influencer in the financial markets.
So this skill is not a small thing rich people will value your knowledge the moment you master trading.
This pattern follows the 3 Step
Rocket 🚀 Booster Strategy:
👉The price has to be above 50 EMA
👉The price has to be above 200 EMA👉The price should gap up
That last step you can clearly see on the chart.
And what I love about this chart is that the support is clear. From the appearance of the gap.
This gives you confidence that the price wont go lower.
Liquidity is above 500K volume
The price is "sitting" on the 50 EMA.
I need to document this strategy because I want a 🔥 fire trading system that works.
Join me on this trading journey to discover a powerful trading system.
Disclaimer ⚠️ Trading is risky please learn about risk management and profit taking strategies.Feel free to use a simulation trading account before you use real money.

Bearish outlook for Bitcoin!Bitcoin Cycle Analysis and Trade Thesis
For more than a decade, Bitcoin has evolved through recurring cyclical patterns, consistently respecting long-term moving averages and two logarithmic regression curves — one defining market peaks and the other defining troughs. I expect this structural behavior to persist over the coming years.
On Friday, as INDEX:BTCUSD briefly topped 123,000, I initiated a bear put spread on NASDAQ:IBIT (50/45 strike), expiring January 2026.
Target: BTCUSD ≈ 70,000.
If this target is not reached by late 2026, I will close the position regardless of price.
Bearish Counterpoints
“Never trade against the trend” — Bitcoin has remained structurally bullish since inception.
“No parabolic top” — Historically, bear markets have emerged only after parabolic blow-offs, which are not currently visible.
“No fundamental trigger” — Major bear phases have often begun with clear catalysts (e.g., Mt. Gox invalid transaction issues, Mt. Gox collapse, China’s mining ban…), none of which are present now.
I admit it feels somewhat awkward to go short while everyone else is buying.
But in trading, profit often comes from being contrarian — buying near the bottom when fear dominates, and selling near the top when euphoria takes over.
And one last thought: even if I believe crypto will still exist in 50+ years — stablecoins, for example, are undeniably useful for fast money transfers and cross-border payments — I expect many of the most speculative assets to trade far closer to zero than to today’s prices.
Bitcoin, along with others tokens, remains, in my view, vastly overvalued.

USDJPY — Bulls in Full Control: Is 152 Next?Bias: Bullish
Timeframe: 4H
1. Technical Overview
USDJPY continues its impressive upward momentum, breaking through several key resistance zones as the pair approaches the 151.00–152.00 psychological level — an area that historically triggered major reversals.
We’re currently witnessing a strong bullish structure supported by the 50 and 100 MA, both trending upward and providing dynamic support. The breakout above 150.00 marked a clear shift in market sentiment, confirming the dominance of buyers.
The next key resistance is located at 151.90–152.20, which was the peak of the last major rally before the Bank of Japan intervened earlier this year. A daily close above this level would open the door to 153.50–154.00, potentially signaling the start of a new medium-term uptrend.
___________________
2. Price Action Analysis
Support zone: 149.50–150.00 — previous resistance now acting as a pivot area.
Resistance zone: 151.90–152.20 — last major high and potential barrier before new highs.
Market structure: Clear sequence of Higher Highs and Higher Lows.
Momentum: Bullish volume expansion, confirming strong participation by institutional buyers.
Price is currently consolidating below the resistance area, forming a potential bullish flag pattern on the 4H chart. A breakout from this mini-structure would confirm continuation to the upside.
___________________
3. Fundamental Context
From a macro perspective, the divergence between Fed and BoJ policies continues to drive this pair upward.
The Federal Reserve maintains a restrictive stance as inflation data remains above target, keeping the USD supported.
The Bank of Japan, meanwhile, sticks to ultra-loose policy and continues yield-curve control, suppressing JPY strength.
Additionally, rising U.S. Treasury yields provide further tailwinds to USDJPY, while Japan’s inflation and wage growth data haven’t shown the strength needed to justify policy tightening.
Unless we see verbal intervention from BoJ officials or a sudden USD correction, the path of least resistance remains to the upside.
___________________
4. Trading Plan (For Reference Only)
Long entry: 150.80 – 151.00 (on retest or small pullback)
Target 1: 151.90
Target 2: 153.50
Stop loss: Below 150.00
Risk-reward ratio: 1:2.5
___________________
5. Summary
USDJPY remains fundamentally and technically bullish. The market shows no immediate signs of exhaustion, and all eyes are now on whether bulls can sustain momentum above the 152.00 threshold — a breakout that could accelerate the rally further.
As always, watch for BoJ rhetoric near these levels — it’s the only real wildcard that can disrupt the current trend.
___________________
Trade safe, plan your entries, and never fight the trend.
— Simon Weber | ICEBERG FOREX SIGNALS

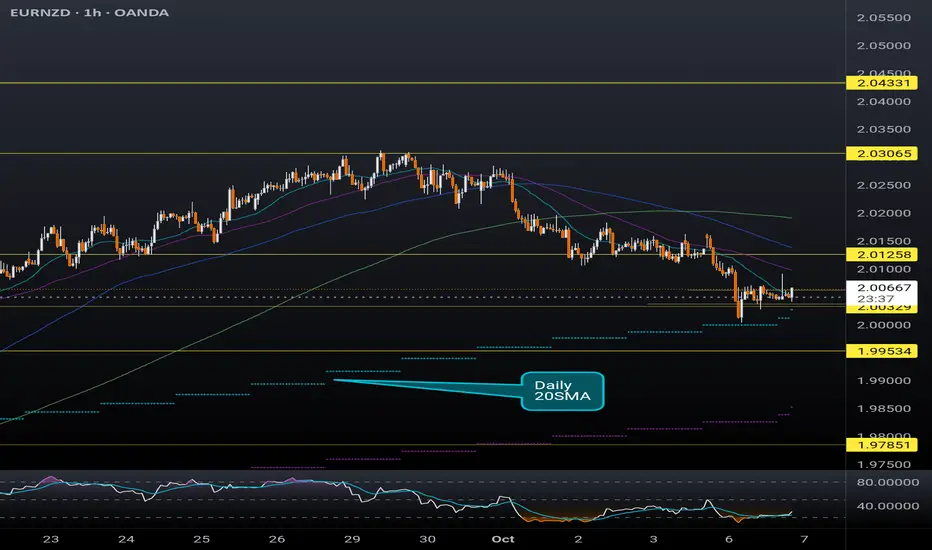
EURNZD finding support at the daily 20SMASimilar to the previous 2 posts regarding GBP pairs, EURNZD is currently riding support at the daily 20SMA (overlayed on this 1H chart). The hourly RSI is also indicating this pair is oversold. RBNZ is expected to cut interest rate tomorrow by another 25 basis points which could be the catalyst to realizing this potential bullish move. Recent weakness in the NZD came after the latest interest rate cut, and if further dovish comments follow the interest rate decision tomorrow, this pair could retest the 2.03xx high hit in late September.
BMNR bull caseFOR REFERENCE : I AM A BULL AND OWN 300+ SHARES
NO CURRENT OPTION PLAYS
We have drawn a HUGE flag and have consolidated for quite some time.
We are far from being overbought and have finally broken out and closed green from this formation.
I am of the belief that we can and will pump this as ETH potentially reaches price discovery mode.
Shadow lines are valid as we rise up and find a potential channel between these as we trend "UP&RIGHT"
We are using the lowest level (YELLOW) as a bear case scenario.
If we are approaching, we turn bearish for near term. if we close below yellow, that means ETH is in freefall and we want to wait until we find a good place to buy back in for positive scalps.
This is a BULL PLAY today. With this trade there is no price target because of ETH price discovery. My holdings are meant to scalp and raise our STOP LOSS as we climb.
Though because of BMNR's past history, I do not put it past the ticker to reach levels like 90, 105 and 130.

Pullback in Morgan StanleyMorgan Stanley recently hit a new high, and now it’s pulled back.
The first pattern on today’s chart is the advance between September 5 and September 23. MS retraced half that move before bouncing, which may confirm its direction remains to the upside.
Second, prices held the rising 21-day exponential moving average (EMA). The 8-day EMA has also stayed above the 21-day EMA. Those signals may be consistent with an uptrend.
Third, Wilder’s Relative Strength Index (RSI) peaked above 76 before dipping toward 50. That may suggest the financial stock worked off an overbought condition and has returned to areas where dip-buyers may feel more comfortable.
Finally, some traders may view the recent pullback as a completed ABC correction, with the potential for the longer-term uptrend to resume.
TradeStation has, for decades, advanced the trading industry, providing access to stocks, options and futures. If you're born to trade, we could be for you. See our Overview for more.
Past performance, whether actual or indicated by historical tests of strategies, is no guarantee of future performance or success. There is a possibility that you may sustain a loss equal to or greater than your entire investment regardless of which asset class you trade (equities, options or futures); therefore, you should not invest or risk money that you cannot afford to lose. Online trading is not suitable for all investors. View the document titled Characteristics and Risks of Standardized Options at www.TradeStation.com . Before trading any asset class, customers must read the relevant risk disclosure statements on www.TradeStation.com . System access and trade placement and execution may be delayed or fail due to market volatility and volume, quote delays, system and software errors, Internet traffic, outages and other factors.
Securities and futures trading is offered to self-directed customers by TradeStation Securities, Inc., a broker-dealer registered with the Securities and Exchange Commission and a futures commission merchant licensed with the Commodity Futures Trading Commission). TradeStation Securities is a member of the Financial Industry Regulatory Authority, the National Futures Association, and a number of exchanges.
TradeStation Securities, Inc. and TradeStation Technologies, Inc. are each wholly owned subsidiaries of TradeStation Group, Inc., both operating, and providing products and services, under the TradeStation brand and trademark. When applying for, or purchasing, accounts, subscriptions, products and services, it is important that you know which company you will be dealing with. Visit www.TradeStation.com for further important information explaining what this means.

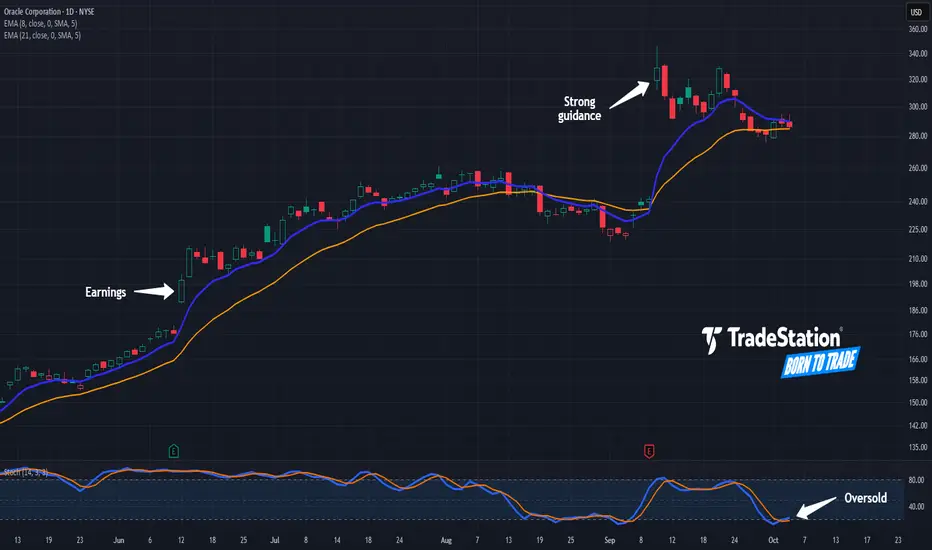
Oracle Pulls BackOracle made a dramatic move four weeks ago, and now it’s pulled back.
The first pattern on today’s chart is the bullish gap on September 10 after the software company issued strong guidance for long-term AI demand. That news prompted investors to revalue the once-sleepy tech giant.
Second, ORCL stalled after the news and declined. But prices have held their rising 21-day (EMA) since last Friday. That could suggest its pullback is ending.
Third, the 8-day EMA has stayed above the 21-day EMA – a potentially bullish short-term signal.
Next, stochastics have dipped to an oversold condition.
Finally, ORCL is an active underlier in the options market. (Its average daily volume of 238,000 contracts ranks 15th in the S&P 500, according to TradeStation data.) That could help traders take positions with calls and puts.
TradeStation has, for decades, advanced the trading industry, providing access to stocks, options and futures. If you're born to trade, we could be for you. See our Overview for more.
Past performance, whether actual or indicated by historical tests of strategies, is no guarantee of future performance or success. There is a possibility that you may sustain a loss equal to or greater than your entire investment regardless of which asset class you trade (equities, options or futures); therefore, you should not invest or risk money that you cannot afford to lose. Online trading is not suitable for all investors. View the document titled Characteristics and Risks of Standardized Options at www.TradeStation.com . Before trading any asset class, customers must read the relevant risk disclosure statements on www.TradeStation.com . System access and trade placement and execution may be delayed or fail due to market volatility and volume, quote delays, system and software errors, Internet traffic, outages and other factors.
Securities and futures trading is offered to self-directed customers by TradeStation Securities, Inc., a broker-dealer registered with the Securities and Exchange Commission and a futures commission merchant licensed with the Commodity Futures Trading Commission). TradeStation Securities is a member of the Financial Industry Regulatory Authority, the National Futures Association, and a number of exchanges.
Options trading is not suitable for all investors. Your TradeStation Securities’ account application to trade options will be considered and approved or disapproved based on all relevant factors, including your trading experience. See www.TradeStation.com . Visit www.TradeStation.com for full details on the costs and fees associated with options.
Margin trading involves risks, and it is important that you fully understand those risks before trading on margin. The Margin Disclosure Statement outlines many of those risks, including that you can lose more funds than you deposit in your margin account; your brokerage firm can force the sale of securities in your account; your brokerage firm can sell your securities without contacting you; and you are not entitled to an extension of time on a margin call. Review the Margin Disclosure Statement at www.TradeStation.com .
TradeStation Securities, Inc. and TradeStation Technologies, Inc. are each wholly owned subsidiaries of TradeStation Group, Inc., both operating, and providing products and services, under the TradeStation brand and trademark. When applying for, or purchasing, accounts, subscriptions, products and services, it is important that you know which company you will be dealing with. Visit www.TradeStation.com for further important information explaining what this means.
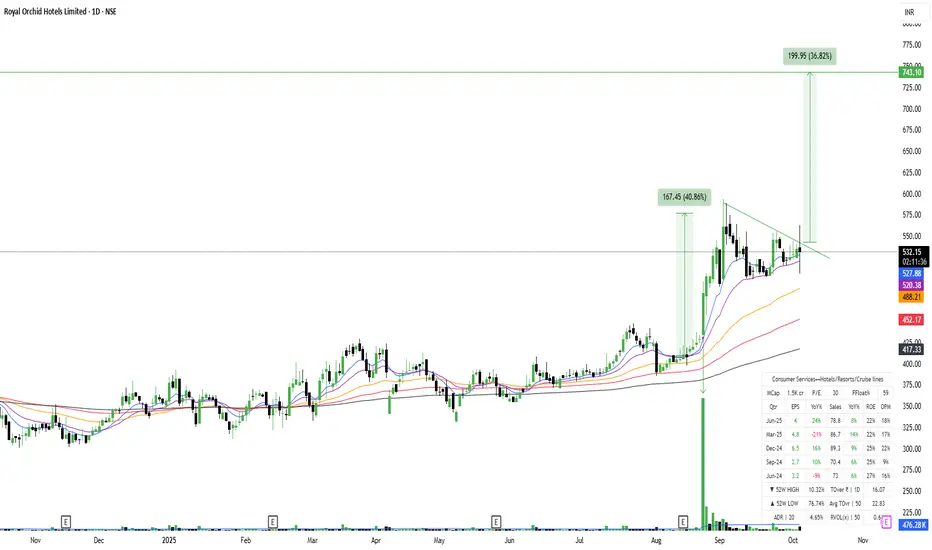
ROHLTD = Descending Triangle Breakout + Volume SurgBreakout from Descending Triangle with Volume Surge in Royal Orchid Hotels
NSE:ROHLTD
📈Pattern & Setup:
Royal Orchid Hotels has given a breakout from a descending triangle pattern on the daily chart. The price successfully closed above the downtrend line, supported by a visible surge in trading volume.
The setup indicates a shift in momentum from sideways to bullish, with strong support from the moving averages (20EMA, 50EMA, and 100EMA) all trending upward. The stock has been consolidating between 480–550 for weeks, and now this breakout confirms renewed buying interest.
📝 Trade Plan:
Entry: Current levels 528–532 look good for a fresh entry.
🚩Stop-Loss: 495 (below recent swing support).
🎯Targets:
Target 1 → 620 (previous swing high).
Target 2 → 743 (measured breakout target with nearly 37% upside).
💡Pyramiding Strategy:
1. Enter first lot near 530–535.
2. Add above 565 after volume confirmation, trail SL to 515.
3. Add final lot above 620, trail SL to 560.
Hold positions for a medium-term swing till 740 zone as long as the price sustains above 500.
🧠Logic Behind Selecting this Trade:
The stock displays a textbook breakout from a descending triangle after weeks of tight range movement — a sign of absorption and strength. The presence of rising EMAs beneath price further strengthens the bullish outlook.
The hospitality sector has shown strong tailwinds lately, and Royal Orchid’s structure aligns perfectly with the sectoral momentum.
Keep Learning. Keep Earning.
Let's grow together 📚🎯
🔴Disclaimer:
This is not an investment advice. Always do your own due diligence before making any trading or investment decision.
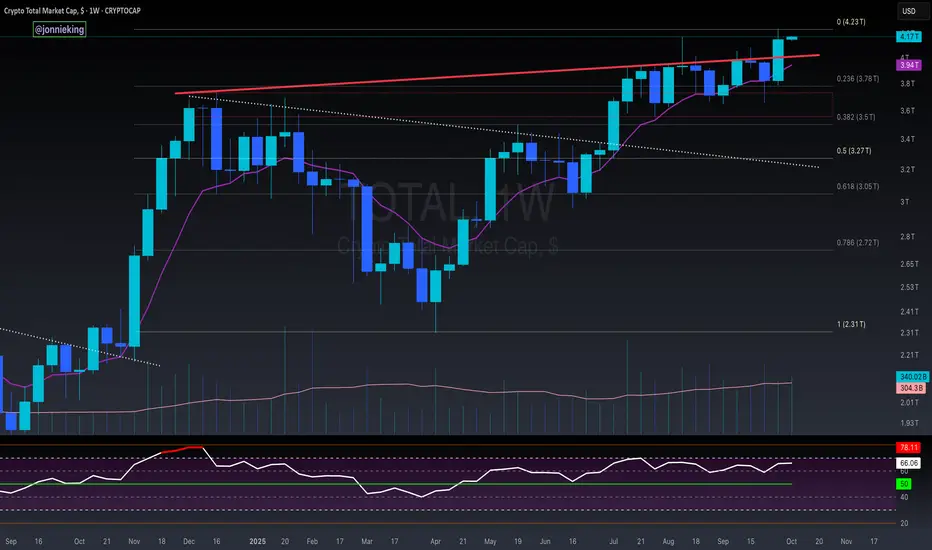
$TOTAL Crypto Market Cap Closes Week ATHCrypto CRYPTOCAP:TOTAL Market Cap Closes the Week at ATH.
Bulls need to close these next couple weeks above
$3.9 - 4.1T to really build momentum.
Solana’s Battle With Historic ResistanceAnalysis of SOL/USDT on the daily chart:
🔎 Technical Overview
Current Trend: Solana has rallied strongly from around $120 to $240 but is now facing heavy resistance at the long-term descending trendline (blue line). Price is currently correcting.
50-Day SMA: Located around $142, acting as a key support zone.
Key Resistance: $260–265 (descending trendline + horizontal resistance).
Key Support: $210–212 (horizontal support + close to SMA50 area).
📉 Short-Term Outlook (1–3 weeks)
Bearish case: If price loses $212, a drop toward $185–190 is likely.
Stop Loss: Below $210.
Bullish case / Short-term target: If price stabilizes above $240, next upside target is $260 (retest of trendline).
📈 Long-Term Outlook (3–6 months)
Bullish breakout scenario: A strong breakout above $265 would confirm a trend reversal, opening room for a larger rally.
Long-term targets:
First target: $300
Second target: $350
Stop Loss (long-term): Below $185 (falling back into the previous bearish channel).
✅ Summary:
Short-term: Risk of correction remains; $210 support is crucial.
Long-term: A confirmed breakout above $265 could trigger a new bullish phase with potential toward $300–350.

AMD Possible long entryNASDAQ:AMD We have to wait for the rejection in the current support level for continuation

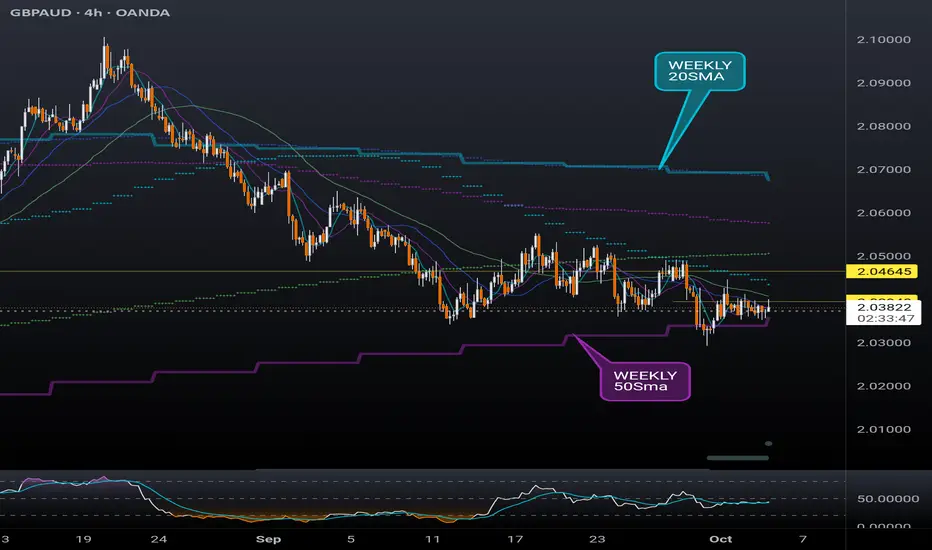
GBPAUD finding support on Weekly 50SMASimilar to the previous post regarding GBPJPY, the British pound is finding support at the weekly 50SMA (overlayed on this 4H chart) after a long sell off indicated in the RSI. Cautiously bullish on GBPAUD considering recent strength in the Aussie dollar due to gold hitting new ATHs (and commodities rallying in general). Approach this with expectations of lots of rejections and chop as price action breaks through the daily moving averages wedged between the 50 and 20 weekly SMA (daily and weekly SMAs overlayed on the 4H chart). This could potentially bounce to retest the weekly 20 currently at 2.06 area.
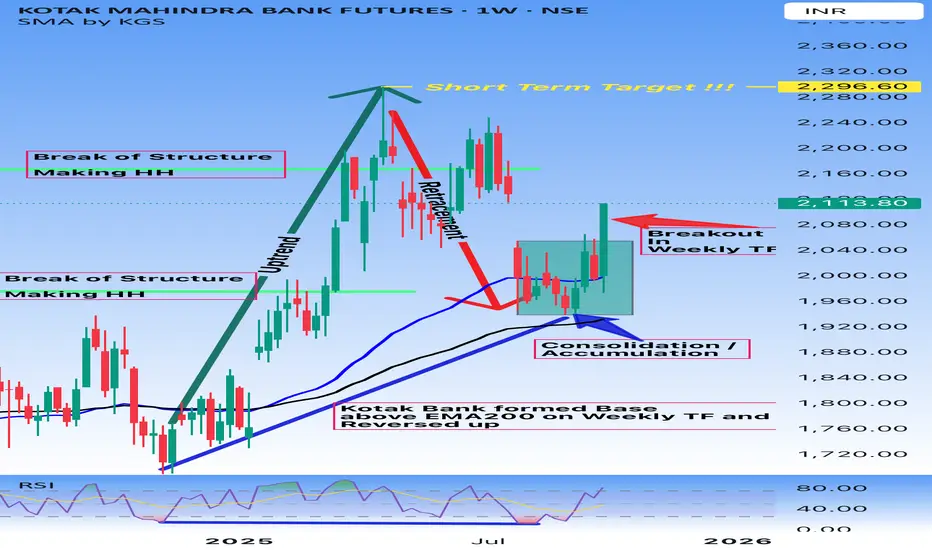
Buy KotakBank - Multiple confirmation - Technical Anaysis
Kotak Mahindra Bank Futures (Weekly Timeframe Analysis)
Current Price: 2,113.80
Technical Analysis:
1. Trend Structure
• Previous strong uptrend with Higher Highs (HH) formation.
• Experienced a retracement phase after topping out.
• Recently consolidated in a range, forming an accumulation zone above the 200 EMA (Weekly TF) and around 100 EMA.
2. Range Breakout Confirmation
• Range Breakout observed on the weekly timeframe after consolidation.
• Price sustained above EMA 200, showing strength.
3. Key Levels
• Support Zone: ₹1,880 – ₹1,940 (consolidation base).
• Resistance Zone / Short-Term Target: ₹2,296.60.
4. Indicators
• Hidden Divergence formed on weekly timeframe, the same area where accumulation happened & RSI bounced from oversold levels and crossed above 50, indicating renewed momentum.
• 100 EMA above 200 EMA shows the trend in favor of bulls.
🎯 Trading Plan:
• Bullish Bias: As long as the price sustains above ₹1,940–1,960 zone.
• Targets:
• Short-Term: ₹2,296.60
• Medium-Term: Higher levels possible if momentum sustains.
• Risk Management:
• Stop-loss below ₹1,880 (recent accumulation low).
Summary:
Kotak Mahindra Bank Futures has broken out from weekly consolidation after forming a strong base above EMA 200. The structure suggests the potential to move towards ₹2,296.60 in the short term, with RSI and price action both supporting bullish momentum.
Is this a Good Time to Buy? (Analysis)I ran the data on this stock—which is based on last-second filings—through Gemini. The results were quite intriguing, but I am certainly aware of the high risk involved.
The analysis reveals a high-risk, high-reward profile driven by a clear divergence between the company's financial fundamentals and its market performance.
Arguments for a "Buy" Consideration (Bullish/Value)
Extreme Undervaluation on Earnings: The low Price-to-Earnings (P/E) ratio of ~1.0 indicates that the stock is trading at a steep discount to its net income. This suggests that investors currently place little to no value on the company's reported earnings.
Strong Cash Flow from Operations: The business continues to generate positive and growing operational cash flow (+$10.1 million), which is a sign of underlying business health.
Aggressive Investment in Future Growth: The massive, nearly 600% increase in R&D expenses signals that management is heavily investing in the company's proprietary AI (AIGC) and metaverse-related technology. If this investment pays off, it could lead to future growth and a re-rating of the stock.
Revenue Growth: The 34.2% year-over-year revenue increase shows the company's products and services are in demand.
Arguments for Caution (Bearish/Risk)
Market Sentiment and Price Action: The stock has lost 80% of its value in the past year and is in a strong falling trend. This indicates overwhelming negative investor sentiment, possibly due to geopolitical risks (as a Chinese company), lack of market awareness, or concerns about long-term profitability.
Profitability Concerns: The significant drop in Gross Margin (from 59.3% to 44.2%) is a major red flag. This suggests the cost to deliver the product is increasing, eroding profitability even with higher revenue.
Cash Burn from Investing: The company used a large amount of cash on investing activities (primarily purchasing intangible assets), resulting in a significant decrease in its overall cash balance.
Reverse Stock Split: The company executed a 15-to-1 reverse stock split on November 26, 2024, which can sometimes be a sign of distress aimed at maintaining listing compliance.
In summary, GMM is a deeply discounted stock with strong revenue and cash generation, but its valuation remains low because of severe margin contraction and high execution risk on its massive R&D/AI investments. A potential buyer would be betting on the success of the company's AI initiatives reversing the trend of declining margins and negative market sentiment.

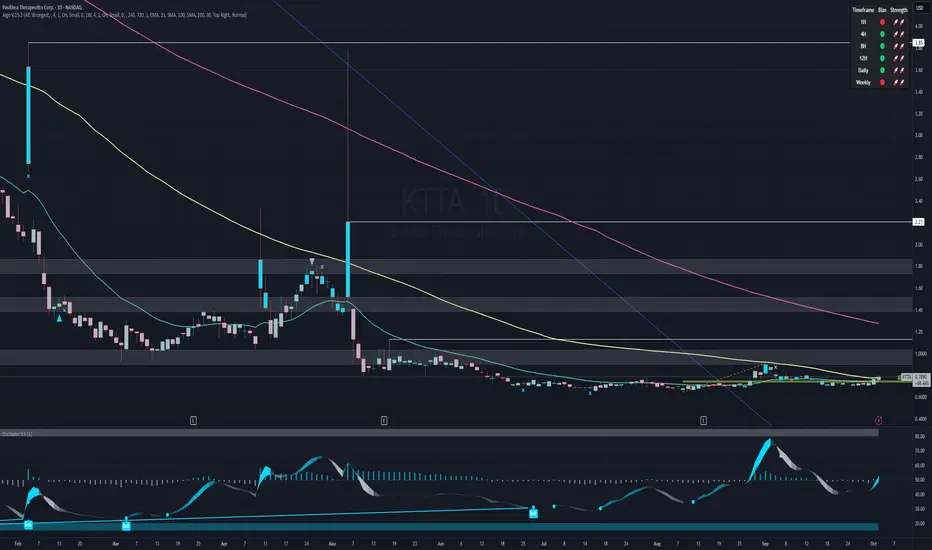
KTTA: Bull case but not confirmedFor one, what stock is this? This is a Penny Stock. They usually come with high risk, high reward.
KTTA has Ketamine products in developments and testing. I'm a strong believer in 'pshychedelics' and their positive effect on health, when done correctly. The sector has been bad for quiet some time.
- as a contrarian indicator, this seems capitulation phase. We want it when nobody else will.
- moving averages: currently above daily 21 and 100 daily MA. Weekly 21MA (really important) is at 0.91
- previous top at 0.91 as well. This will be strong resistance.
- watch volume on daily chart. previous rallies were pure sell off rallies. a change in pattern like big green volume with a green bar is bullish and could mark the start of a rally up (if there is no immediate sell off the days later ..).
- long term blue downtrend is broken
- Weekly RSI is rising
- after prolonged downtrend might be seeing some base building here
retest of lows remains possible
Buying here might still be early, too early in the cycle? 0.91 and 1.14 needs to get broken and the overall structure needs to change to really become bullish.
Magnet levels when in bull run
- 0.91
- 1.14
- 1.40
- 2.21
- 3.85
- 5.43
- 6.00
- 7.50
Big stretch:
- 9.25
- 17.40
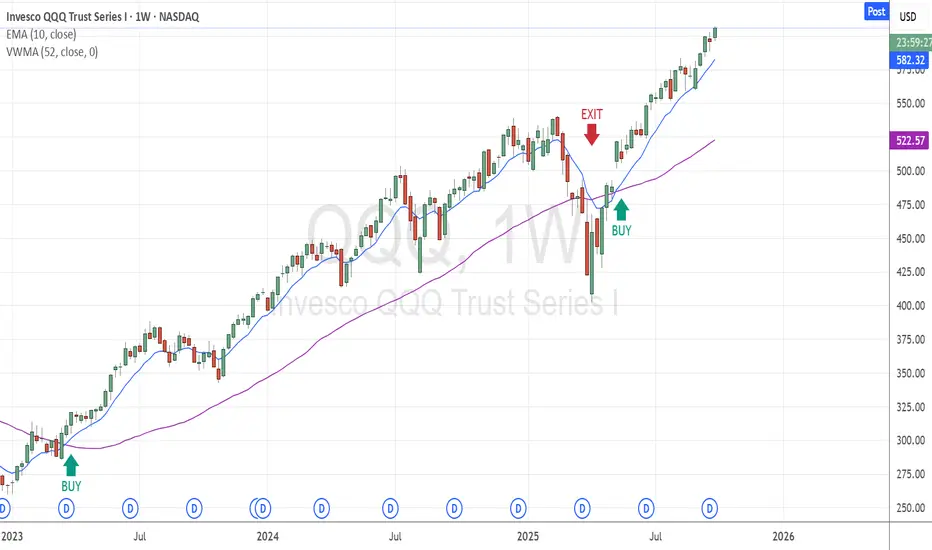
Simple Investment Strategy (Long Term only)This strategy is designed for long-term investors using a simple, two-indicator setup on the weekly chart:
• VWMA (Volume-Weighted Moving Average) – 52-period
• EMA (Exponential Moving Average) – 10-period
✅ Entry Signal (Buy)
• Enter a position when the 10-period EMA crosses above the 52-period VWMA.
This crossover suggests a potential upward trend supported by volume.
❌ Exit Signal (close Long Position)
• Exit the position when the 10-period EMA crosses below the 52-period VWMA.
This indicates a possible trend reversal or weakening momentum.
💡 Additional Note
• When the 10 EMA is below the 52 VWMA, it's best to stay in cash and wait patiently for the next bullish crossover. This helps avoid false entries and keeps you aligned with the broader trend.