See if we can break above 0.04364-0.04630
Hello, fellow traders!
Follow us to get the latest updates quickly.
Have a great day!
-------------------------------------
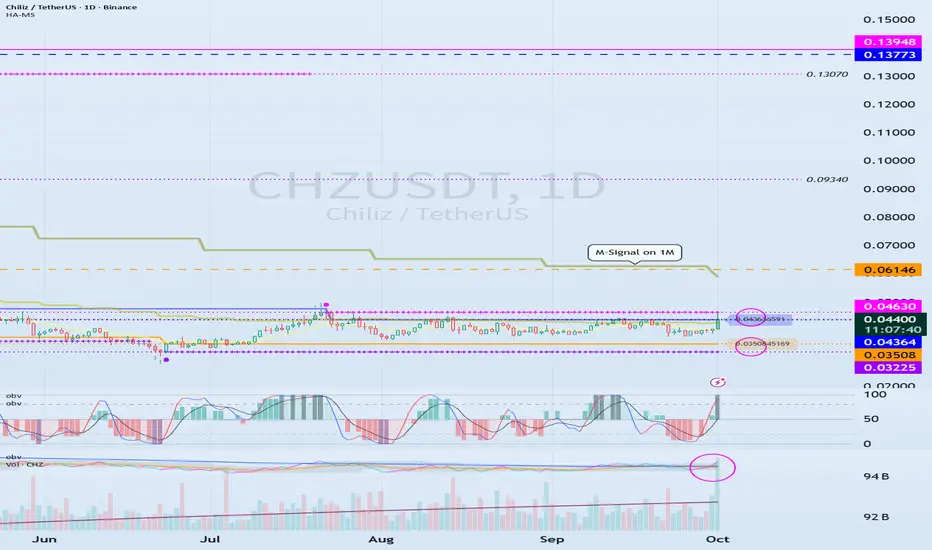
(CHZUSDT 1D chart)
The OBV indicator is showing an upward break above the EMA 2 indicator.
If the price rises above the 0.04364-0.04630 range, it is expected to continue its upward trend.
However, since the price is below the M-Signal indicator on the 1M chart, a quick and quick response is required when trading.
Therefore, if possible, it is recommended to confirm that the price rises above the M-Signal indicator on the 1M chart, providing support, before trading.
-
(1M chart)
If the price rises above the M-Signal indicator on the 1M chart, it is highly likely that the price will attempt to rise to around 0.20790.
------------------------------------------
Considering the above, for medium- to long-term investment, it is recommended to buy when the price rises above the 0.04364-0.04630 range, providing support.
If you're looking to make a short-term investment, it's best to buy when the price rises above the M-Signal indicator on the 1M chart and shows signs of support.
Buying at a low price doesn't always lead to profits.
This is because some investors may not be able to wait for the price to rise and may give up midway.
Therefore, you should calmly consider your investment horizon for the altcoin you're currently considering.
Your investment size and trading strategy will vary depending on your investment horizon.
-
Thank you for reading to the end.
I wish you successful trading.
--------------------------------------------------
MS
Next Volatility Period: Around October 3rd (October 2nd-4th)
Hello, fellow traders!
Please "Follow" to get the latest information quickly.
Have a great day!
-------------------------------------
(BTCUSDT 1D Chart)
This volatility period lasts until September 29th, but since the next volatility period is around October 3rd (October 2nd-4th), it's highly likely that the volatility period will continue until October 4th.
Therefore, we need to see if the price can sustain above 11696.21 after the volatility period.
If it fails to do so and falls below the 104463.99-108353.0 range, a sharp decline is likely.
If a sharp decline occurs, we need to check for the formation of new indicators such as the DOM (-60) or HA-Low indicators.
If new support is formed, it's important to determine whether there is support near that area.
If support is not found, a step-down trend is likely.
-
It is currently located near the M-Signal indicator on the 1W chart and the M-Signal indicator on the 1D chart.
Therefore, if the price rises above 111696.21 and holds, further upward movement is likely.
At this point, the key question is whether the price can rise above 115854.56 and hold.
To sustain the uptrend,
- The StochRSI indicator must show an upward trend. It must rise from the oversold zone.
- The On-By-Signal (OBV) indicator must show an upward trend. It must rise above EMA 1 and, if possible, above the High Line and remain there.
- The TC (Trend Check) indicator must show an upward trend. It must rise above the 0 point and remain there.
If the above conditions are met, the uptrend is likely to continue above 111696.21.
-------------------------------------------
The basic trading strategy is to buy in the DOM(-60) ~ HA-Low range and sell in the HA-High ~ DOM(60) range.
However, if the price rises in the HA-High ~ DOM(60) range, a stepwise upward trend is likely, while if the price falls in the DOM(-60) ~ HA-Low range, a stepwise downward trend is likely.
Therefore, the basic trading strategy should be a segmented trading approach.
This basic trading strategy principle was developed for trading on Heikin-Ashi charts.
Adding the M-Signal indicator on the 1M, 1W, and 1D charts allows you to see the overall trend.
The remaining indicators indicate support and resistance points or zones for chart analysis or trading strategies.
Trading is all about reaction, so understanding support and resistance points or zones is crucial.
However, you should interpret the charts based on core fundamental trading strategies.
-
Thank you for reading to the end.
I wish you successful trading.
--------------------------------------------------
- Here's an explanation of the big picture.
(3-year bull market, 1-year bear market pattern)
I'll explain more in detail when the bear market begins.
------------------------------------------------------
Resistance Zone: 977.90-1047.80
Hello, fellow traders!
Follow us to get the latest information quickly.
Have a great day!
-------------------------------------
(BNBUSDT 1M Chart)
We achieved our target by touching the Fibonacci level of 1.618 (1057.16).
We need to see if the price can rise towards Fibonacci ratio 2 (1259.05).
-
(1D chart)
The HA-High ~ DOM (60) range has formed at 977.90-1047.80.
Therefore, the 977.90-1047.80 range could act as resistance.
If it falls below 977.90, it could encounter the M-Signal indicator on the 1M chart.
Before that, we need to see if the price rises along the uptrend line (1).
-
Thank you for reading to the end.
I wish you successful trading.
--------------------------------------------------

The DOW, Gold, and Morgan StanleyAs it turns out, the stock market that appears to be the gift that keeps giving, is actually giving nothing. In reality, when we measure the value of the DOW with real money (Gold) rather than fiat inflationary currency, the markets are crashing down so fast it'll make your head spin. The $NYSE:DOW/TVC:GOLD shows us that what appears to be one of the greatest bull markets in the history of the entire exchange, is actually just one giant melt up fueled by monetary expansion and inflationary action.
Morgan Stanley NYSE:MS recent came out and shared their new edit to their famous 60/40 portfolio arrangement. In this edit, they entertained the idea that inflation was simply not friendly to the client's holdings and that they should actually diversify their positions. Originally, the 60/40 portfolio consisted of 60% equities, and 40% bonds. However, they presume that the future will not bring a passive environment to the boring 40% bonds because, like anyone with two eyes and a brain, they believe that higher inflation lies ahead. Their solution? Get this, to buy Gold . Who would of thought of something so genius? The profound idea that a placeholder of value would hold value and protect you from inflation could only possibly be developed in such a megabank super titan with trillions in AUM. All sarcasm aside though, it might not be exactly obvious to most what this means for gold and bonds.
Firstly for bonds, most of which are held in treasuries, we can expect some sort of retail selloff only to be bought back up again by the Fed. So nothing news worthy there. However for our precious gleaming metal, we can expect a continuing bull run as money leaves the debt market and enters into precious metals (again namely gold). We should also be inclined to believe that this should help gold mining companies and give them a nice increase in their stock values over time. Next, we shouldn't expect to much of a move from this in the stock market except the usual volatility and seasonal shifts.
Lastly, from this admission from the boys at Morgan Stanley, we can also expect continuing inflation despite what the numbers released by the Fed say. No, the cost of living will not lower. No, the Fed will not raise rates to curb inflation. No, the numbers are never real and never will be. But this does mean that we know what's coming and how to protect ourselves.
Here are the possible plays to consider
Gold: GOLD (USD/OZ)
Stocks: NYSE:NEM , $B, NYSE:EGO , AMEX:EQX , NYSE:AEM
ETF: GDX, GDXJ

Volatility Period: Around September 19th (September 18th-20th)
Hello, traders!
Follow us to get the latest information quickly.
Have a great day!
-------------------------------------
(BTCUSDT 1D Chart)
This volatility period is around September 19th (September 18th-20th).
As this period of volatility progresses, we need to examine the direction in which the price deviates from the 115,854.56-119,177.56 range.
As previously mentioned, the key ranges are 87,814.27-93,570.28 and 104,463.99-108,353.0.
Therefore, if the price falls below 115,854.56, we need to check for support near these key levels.
-
It's perhaps natural for trading volume to decrease after a new ATH (Any New High).
If a new ATH (Any New High) is met with high trading volume, it could indicate a significant amount of profit-taking, increasing the likelihood of a downward trend.
Therefore, I don't think it's wise to interpret the current decline in trading volume as a sign of a decline.
We're using the On-By-Volume (OBV) indicator, which helps us understand the movement of trading volume, so we can roughly gauge the current trading volume trend.
-
The HA-High ~ DOM(60) range on the 1D chart is 115854.56-119177.56, and the HA-High ~ DOM(60) range on the 1W chart is 116259.91-119086.64.
Since these two resistance levels overlap, a breakout above this level suggests a potential surge.
-
Thank you for reading to the end.
We wish you successful trading.
--------------------------------------------------
- This is an explanation of the big picture.
(3-year bull market, 1-year bear market pattern)
I will explain in more detail when the bear market begins.
------------------------------------------------------

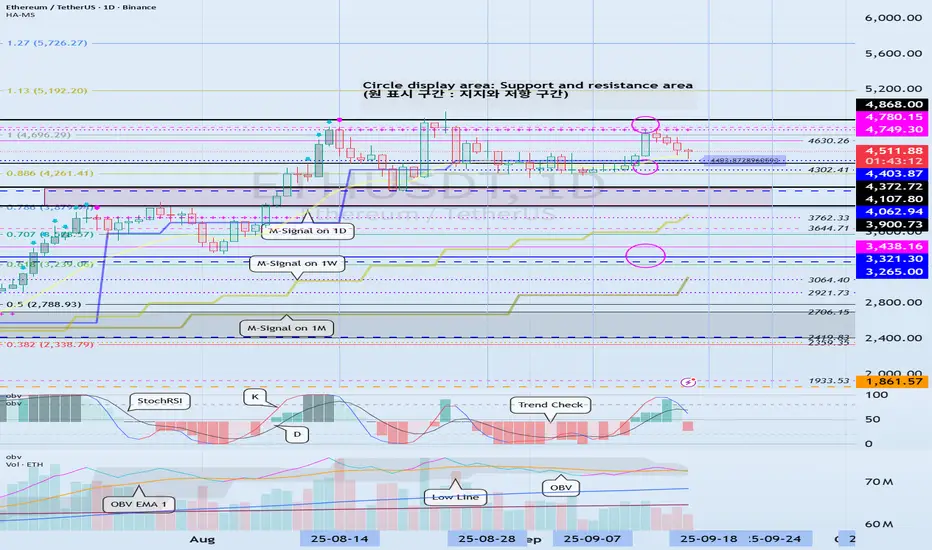
This Volatility Period:Around September 24th(September 23rd-25)
Hello, traders!
Follow us to get the latest information quickly.
Have a great day!
-------------------------------------
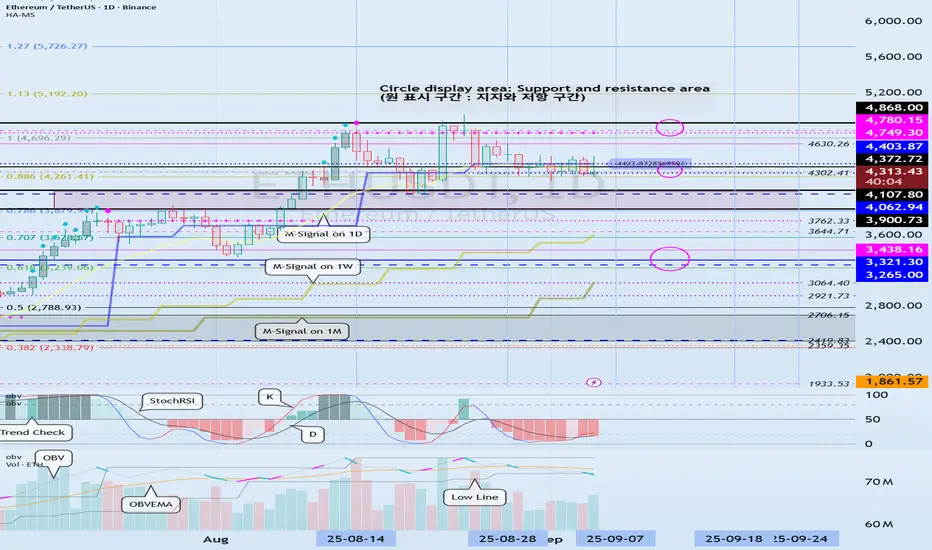
(ETHUSDT 1D Chart)
This Volatility Period: Around September 24th (September 23rd-25th)
Before this volatility period began, the price fell below 4403.87 and then fell to the 3900.73-4107.80 range.
The 4403.87-1749.30 range, which corresponds to the HA-High ~ DOM (60) range, is likely to act as resistance, as it represents a high point.
The 3900.73-4107.80 range represents the previous all-time high (ATH). If the price remains above this range, the uptrend is likely to continue.
Therefore, the key question is whether the price can find support in the 3900.73-4107.80 range and rise above the 4403.87-4749.30 range.
After this volatility period, we should examine whether the price can find support in the 3900.73-4107.80 range.
If not, support around 3265.0-3438.16 is crucial.
-
If the OBV indicator falls below the Low Line, the price is likely to decline again.
Therefore, support around 3900.73-4107.80 is crucial.
-
The basic trading strategy is to buy in the DOM(-60) ~ HA-Low range and sell in the HA-High ~ DOM(60) range.
Considering this basic trading strategy, it may be natural for the price to decline since it failed to rise above 4403.87-4749.30.
Since it fell in the HA-High ~ DOM(60) range, it is likely to decline until it meets the DOM(-60) or HA-Low indicator.
However, since important support and resistance points or zones have formed, the trend can reverse at any time depending on whether support is found at those points or zones.
In this sense, the K value of the StochRSI indicator is in the oversold zone, suggesting a potential uptrend in the near future.
While the K value of the StochRSI indicator is in the oversold zone, the possibility of further decline is high. However, the established support and resistance zones increase the likelihood of turning this crisis into an opportunity.
In this situation, what we can do is confirm the signs of an uptrend.
Otherwise, if we anticipate a new trade in advance, we may face another crisis as the volatility period progresses.
-
If you are currently trading, there is an opportunity to sell in the first installment when resistance is encountered in the 4403.87-4749.30 zone.
As mentioned earlier, this is based on the basic trading strategy.
Depending on whether support is found in the 3900.73-4107.72 range, you'll decide whether to sell in two installments or buy.
Since the stock market trades in single-share increments, selling before the price has more than doubled from the purchase price makes it difficult to buy again.
However, the coin market allows for decimal trading, making trading easier than in the stock market.
This freedom of buying and selling is the biggest advantage of the coin market.
If your buy price is below 3900.73, buying when the 3900.73-4107.80 range shows signs of support will increase your average buy price, potentially putting you under psychological pressure.
However, as mentioned earlier, the coin market allows for decimal trading, making it possible to separate your buy price into separate trades.
Therefore, you can record the purchase price and purchase amount separately, differentiating them from the existing average purchase price, and then trade them separately.
If you understand this principle, you'll find the coin market much easier to trade than the stock market.
This is one of the reasons why even those who have successfully traded in the stock market often fail in their initial trading in the coin market.
-
Thank you for reading to the end.
I wish you successful trading.
--------------------------------------------------
- Here's an explanation of the big picture.
(3-year bull market, 1-year bear market pattern)
I'll explain more in detail when the bear market begins.
------------------------------------------------------

The key is whether it can rise above 3.0361
Hello, fellow traders.
Follow us to get the latest information quickly.
Have a great day.
-------------------------------------
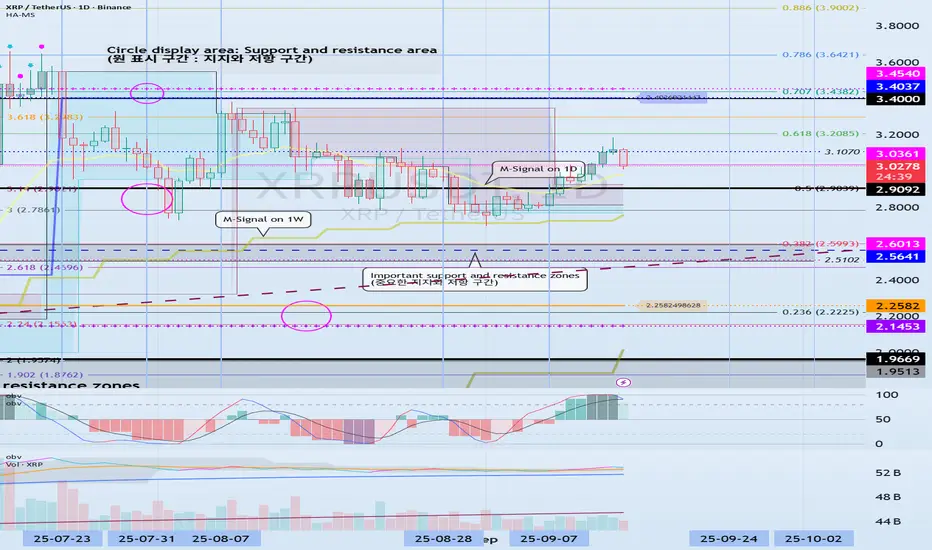
(XRPUSDT 1D chart)
The key is whether it can rise above 3.0361 and sustain the price after the next period of volatility, around October 2nd.
This period of volatility is expected to continue until September 25th, and we should examine whether support can be found around 2.9092 and whether it can rise.
-
If the price falls below the M-Signal indicator on the 1W chart,
1st: 2.5102-2.6013
2nd: 2.1453-2.2582
We should check for support near the 1st and 2nd levels above.
-
If the price remains above the M-Signal indicator on the 1D chart, further upside is highly likely, so it's important to determine whether support can be found near 3.0361.
The best time to buy was when support was found at key support and resistance levels, or around the 2.1453-2.2582 range.
Currently, a new buy is possible when support is found near 3.0361.
However, since this does not fit the basic trading strategy, a quick and rapid response is required.
-
The basic trading strategy is to buy in the DOM(-60) ~ HA-Low range and sell in the HA-High ~ DOM(60) range.
However, if the HA-High ~ DOM(60) range rises, a step-up trend is likely, while if the DOM(-60) ~ HA-Low range falls, a step-down trend is likely.
Therefore, the basic trading strategy should be a segmented trading approach.
-
The HA-High ~ DOM(60) range on the 1D chart is currently 3.4037-3.4540.
Therefore, a rise to around 3.4037 is possible.
However, since the DOM(60) point on the 1M chart is formed at 3.0361, if the price rises above 3.0361 and maintains, a long-term step-up trend is likely.
Therefore, the current buying opportunity should be when support is confirmed around 3.0361.
-
(1W chart)
To rise above 3.0361 and maintain support, the upward trend should continue.
- The StochRSI indicator should be trending upward. Ideally, it should not enter the overbought zone.
- The On-By-Value (OBV) indicator should be trending upward. Ideally, it should remain above the High Line.
- The TC (Trend Check) indicator should be trending upward. Ideally, it should remain above the zero level.
If the above conditions are met, the upward trend is expected to continue.
-
Thank you for reading.
We wish you successful trading.
--------------------------------------------------

Support and Resistance Area: 0.9563-1.0036
Hello, traders!
Follow us to get the latest information quickly.
Have a great day!
-------------------------------------
(TWTUSDT 1W Chart)
The key support and resistance area is 1.65-1.8839.
To break above this important support and resistance zone, we need to see if the price can maintain support near 1.0036 and rise above 1.4026.
-
(1D chart)
Since the HA-High indicator on the 1D chart was generated at 0.9563, it's crucial to see if the price can maintain above 0.9563-1.0036.
To achieve this, the key is whether the price can rise after finding support near 1.2224.
Therefore, if the price falls below 1.2224, support around 0.9563-1.0036 will be crucial.
------------------------------------
The basic trading strategy is to buy in the DOM(-60) ~ HA-Low range and sell in the HA-High ~ DOM(60) range.
However, if the price rises from the HA-High to DOM(60) range, it is likely to exhibit a step-like upward trend, while if it falls from the DOM(-60) to HA-Low range, it is likely to exhibit a step-like downward trend.
Therefore, the basic trading strategy should be a segmented trading strategy.
Buying when the HA-High to DOM(60) range shows support requires a short and quick response.
As mentioned earlier, the HA-High to DOM(60) range is considered a sell zone, or resistance zone.
Therefore, if possible, it's best to find a buying opportunity when the price declines and then rises.
1. The K indicator of the StochRSI indicator should be rising. If possible, it should not enter the overbought zone.
2. The On-By-Sign-Operative (OBV) indicator should be rising. If possible, it should remain above the High Line.
3. The TC (Trend Check) indicator should be rising. If possible, it should be above the 0 point.
When the three indicators listed above are met, the price is likely to continue its upward trend.
-
Thank you for reading to the end.
We wish you successful trading.
--------------------------------------------------

Volatility Period: Around September 18th (September 17th-19th)
Hello, fellow traders!
Follow us to get the latest information quickly.
Have a great day!
-------------------------------------
(ETHUSDT 1D Chart)
The 4403.87-4749.30 range, which is the HA-High ~ DOM (60) range, represents a resistance zone.
Therefore, we need to monitor the price movement after the current volatility period, around September 18 (September 17-19).
To sustain the uptrend, the price must remain above the 3900.73-4107.80 range.
From a medium- to long-term perspective, the 3265.0-3321.30 range is a key area.
Considering the above, if it falls below 4403.87,
1st: 4107.80-4372.72
2nd: 3265.0-3321.30
Therefore, it is likely to fall to the first and second levels above.
Therefore, the key question is whether it can find support near 4403.87 after this period of volatility.
-
When trading, it's important to understand the current price level.
I believe there are several ways to determine this.
My basic trading strategy is to determine when to trade.
My basic trading strategy is to buy when support is found in the DOM(-60) ~ HA-Low range and rise, and to sell when it touches the HA-High ~ DOM(60) range.
However, if the price rises in the HA-High ~ DOM(60) range, a step-like upward trend is likely, while if it falls in the DOM(-60) ~ HA-Low range, a step-like downward trend is likely.
Therefore, the basic trading strategy should be a segmented trading strategy.
If you were unable to buy in the DOM(-60) ~ HA-Low range, but the current price is within the DOM(-60) ~ HA-Low range, you should check for support.
Support is determined by checking whether support is found near the HA-Low or DOM(60) indicators.
If you bought when support was found near the HA-Low indicator, the first sell position would be near the DOM(60) indicator.
If you bought when support was found near the DOM(60) indicator, you should execute the trade quickly and effectively.
If the price falls below the purchase price, it would be considered a buy at the high.
To prevent this to some extent, we've utilized several indicators for verification.
First, we utilize the M-Signal indicator on the 1M, 1W, and 1D charts.
That is, if the M-Signal indicator is passing near important support and resistance levels, the presence of support in that area is likely to play a more important role.
Currently, the M-Signal indicator on the 1D chart is passing near 4403.87, so we should consider the area around 4403.87 as a potential important support and resistance level.
Second, we should monitor the movements of auxiliary indicators such as the TC (Trend Check) indicator, the StochRSI indicator, and the On-By-Signal (OBV) indicator.
For the price to continue its upward trend in this important support area,
- the StochRSI indicator must show an upward trend. If possible, it's best to avoid entering the overbought zone.
- The OBV indicator should be showing an upward trend. If possible, it should remain above the High Line.
- The TC (Trend Check) indicator should be showing an upward trend. If possible, it should remain above the 0 level.
By monitoring the movements of the three indicators above, you can determine whether there is support near important support and resistance levels.
However, you should not blindly trust the movements of auxiliary indicators. Even if you have identified the movements of auxiliary indicators, you should always monitor the price movement.
To determine support, you should monitor the price movement for at least 1-3 days.
This is especially important during periods of volatility.
Volatility is a period where you cannot predict the direction of movement, so extra caution is required.
Therefore, if possible, it's better to observe the situation and find a trading opportunity after the volatility period has passed rather than entering a new trade during a volatile period.
-
Thank you for reading to the end. I wish you successful trading.
--------------------------------------------------
- Here's an explanation of the big picture.
(3-year bull market, 1-year bear market pattern)
I'll explain more in detail when the bear market begins.
------------------------------------------------------
The key is whether it can rise above 3.9509
Hello, fellow traders.
Please "Follow" to always get the latest information quickly.
Have a great day.
-------------------------------------
(SUIUSDT 1D Chart)
Since the HA-High ~ DOM (60) ranges on the 1W and 1D charts partially overlap, a breakout above the 3.9509-4.7328 range is expected to lead to a sharp rise.
Therefore, the 3.9509-4.7328 range is considered a resistance zone.
The HA-Low and HA-High indicators are converging as price movements move.
If this convergence occurs, the converged range, i.e., the HA-Low ~ HA-High range, can be considered a buy zone.
If the price falls below the 2.4495-2.8161 range, trading should be halted and the situation should be monitored.
Currently, the M-Signal indicator on the 1M chart is moving between 2.4495 and 2.8161. Therefore, if the price falls below this level, a stop loss should be considered and a response strategy should be developed.
Based on a basic trading strategy, a buy signal is signaled when support is found in the 2.4495-2.8161 range.
However, if the price falls below the M-Signal indicator on the 1M chart, a downtrend is likely, requiring a response strategy.
-
I mentioned the resistance range as 3.9509-4.7328. However, since the HA-High ~ DOM (60) range on the 1D chart is 3.9509-4.3260, a buy signal can be made when the price finds support within this range and rises.
However, since the buy signal is near the resistance level, a quick and short response is required.
The first sell range is 4.7328-4.96.
-
Thank you for reading to the end.
I wish you successful trading.
--------------------------------------------------

The 115854.56-119177.56 area is a resistance zone
Hello, fellow traders!
Follow us to get the latest information quickly.
Have a great day!
-------------------------------------
(BTCUSDT 1D chart)
Looking at the big picture, there are two important areas.
These are the 104463.99-18353.0 and 84814.27-93570.28 levels.
To continue the stepwise uptrend, an upward breakout of the 116259.91-119177.56 level is necessary.
The M-Signal indicator on the 1D and 1W charts is passing through the 108353.0-116259.91 level. If support is found in this area, the price is likely to continue attempting to break above the 116259.91-119177.56 level.
If the price declines to the 104463.99-18353.0 level and encounters resistance, it is expected to eventually encounter the M-Signal indicator on the 1M chart.
Currently, the M-Signal indicator on the 1M chart is moving between 84814.27 and 93570.28, so it's important to determine whether it can find support within this range.
--------------------------------------
Two OBV EMA lines have been added to the OBV indicator in the Low Line ~ High Line channel.
OBV EMA 1 can be used as a short-term indicator, EMA 2 as a medium-term indicator, and EMA 3 as a long-term indicator.
Disabling EMA 3 reveals that the OBV is currently above both EMA 1 and EMA 2, indicating a transition from EMA 1 to EMA 2.
If OBV rises above the High Line and remains above it, the price is likely to continue its upward trend.
Currently, the price has been trending upward as the OBV indicator has risen above the High Line, but with the High Line indicator re-emerging, it appears to be declining below the High Line.
However, as mentioned earlier, since the OBV indicator is holding above EMA 1 or EMA 2, the key is whether the current support and resistance zones hold support.
In other words, the key is whether support can be found and an upward movement can occur around the 115,854.56-116,259.91 range.
The 115,854.56 and 116,259.91 points are the HA-High indicator levels on the 1D and 1W charts.
Therefore, the current support and resistance zones should be considered resistance zones and a corresponding strategy should be developed.
The basic trading strategy is to buy between DOM(-60) and HA-Low and sell between HA-High and DOM(60).
However, if the price rises in the HA-High ~ DOM(60) range, it could exhibit a step-like upward trend, while if it falls in the DOM(-60) ~ HA-Low range, it could exhibit a step-like downward trend.
Therefore, the basic trading strategy should be a segmented trading strategy.
Therefore, those who bought near the DOM(-60) ~ HA-Low range should consider selling in segments.
If you want to make a new purchase, you can do so when the HA-High ~ DOM(60) range shows support. However, this requires a quick and short response, so caution is advised.
From a broader perspective, this means buying in a sell zone.
-
I believe whether the price will rise or fall in the future depends on whether it can break above Zone 1.
There's a possibility of a bear market turning around, with a new all-time high (ATH) occurring between the week of November 24th and the week of January 26th, 2026.
More details will likely emerge as this month progresses.
This month's volatility period will be around September 19th and September 28th.
-
Thank you for reading.
I wish you successful trading.
--------------------------------------------------
- This is an explanation of the big picture.
(3-year bull market, 1-year bear market pattern)
I will explain in more detail when the bear market begins.
------------------------------------------------------

Explanation of the Basic Trading Strategy
Hello, fellow traders!
Follow me to get the latest information quickly.
Have a great day.
-------------------------------------
To understand the charts, the basic trading strategy is the concept used.
Let's look at an example.
---------------------------------------------------------
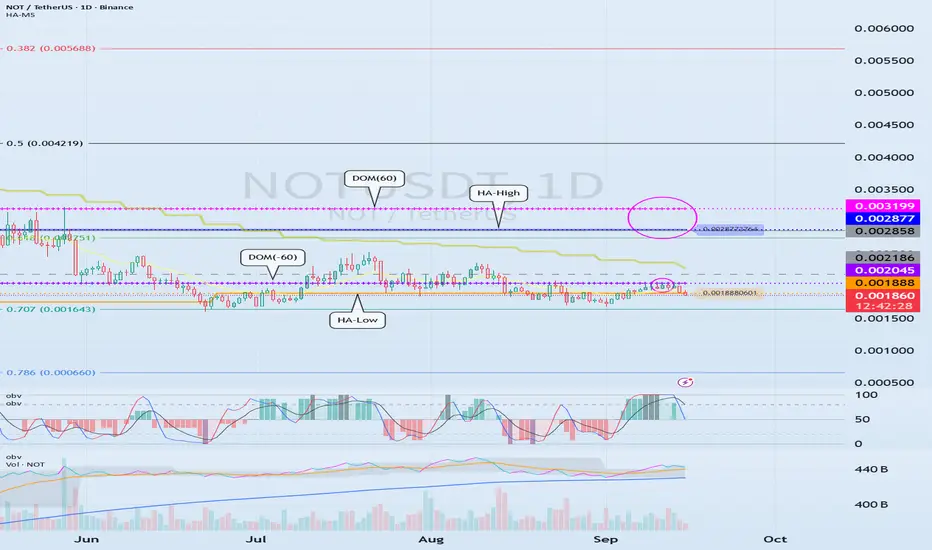
The OBV indicator, which follows the Low Line ~ High Line channel, has shown an upward trend as it has broken above EMA 1 and EMA 2.
Afterwards, the DOM(60) and HA-High indicators were formed, ultimately returning the price to its original position.
Since the HA-Low indicator is forming at 0.001888, we need to examine whether it can find support and rise around this level.
In other words, a buy signal is in the 0.001888-0.002045 range, where support is found and the price rises.
Since the HA-Low and HA-High indicators have converged, a sharp rise is expected if the sideways movement ends and the price rises above 0.002877-0.003199.
-
The basic trading strategy is based on the HA-Low and HA-High indicators, indicators developed for trading on Heikin-Ashi charts.
The basic trading strategy is to buy in the DOM(-60) to HA-Low range and sell in the HA-High to DOM(60) range.
However, if the price rises from the HA-High to DOM(60) range, a step-like upward trend is likely, while if it falls from the DOM(-60) to HA-Low range, a step-like downward trend is likely.
Therefore, the basic trading strategy should be a segmented trading approach.
Therefore, rather than predicting trends based on the movements of one or two indicators, you should prioritize developing a basic trading strategy.
-
If the HA-Low indicator touches and rises to meet the HA-High indicator, the wave should be considered closed.
Furthermore, if the HA-High indicator touches and falls to meet the HA-Low indicator, the wave should also be considered closed.
Remember that the closing of these waves serves as a benchmark for creating new trading strategies.
Previous waves should be forgotten and new trading strategies developed.
-
Thank you for reading to the end.
I wish you successful trading.
--------------------------------------------------
Volatility Period: Around September 7th (September 6th-10th)
Hello, traders!
Follow us to get the latest information quickly.
Have a great day!
-------------------------------------
(ETHUSDT 1D Chart)
This volatility period is around September 7th (September 6th-10th).
After this period of volatility, the key question is whether the price can find support and rise above the 4403.87-4749.30 level.
-
To continue the cascading upward trend, the price must rise above 4749.30.
Therefore, we need to monitor whether the price maintains above the 4749.30-4868.0 level.
-
If resistance is encountered at 4403.87 and the price declines, it is likely to decline until it meets the HA-Low indicator.
Therefore, we need to check for support around 4302.41-4403.87.
However, there is a possibility of a rise after touching the previous all-time high (ATH) range of 3900.73-4107.80, so we need to consider a response plan.
If the price falls below 4107.80, it is expected to touch the M-Signal indicator on the 1W chart and resume the trend.
-------------------------------
The On-By-Signal (OBV) indicator is falling below the Low Line.
The TC (Trend Check) indicator is below 0.
The K value of the StochRSI indicator is showing signs of rising from the oversold zone.
If the High Line of the OBV indicator falls and forms a downward channel, it is highly likely that selling pressure will continue to dominate, so caution is advised when trading.
Therefore, the key issue this time is whether support is found around 4302.41-4403.87.
The TC (Trend Check) indicator is a comprehensive evaluation of the StochRSI, On-By-Signal (OBV), and PVT-MACD Oscillator indicators.
Therefore, if the TC indicator is below 0, selling pressure is dominant, and the price is likely to decline.
If the K value of the StochRSI indicator continues to rise, the price is likely to rise after this period of volatility.
However, for the uptrend to continue, the OBV and TC indicators must show upward trends.
-
Thank you for reading to the end.
We wish you successful trading.
--------------------------------------------------
- Here's an explanation of the big picture.
(3-year bull market, 1-year bear market pattern)
I'll explain more in detail when the bear market begins.
------------------------------------------------------
Check for support around 3.0361
Hello, fellow traders!
If you "Follow" me, you'll always get the latest information quickly. Have a great day today.
-------------------------------------
(XRPUSDT 1D chart)
The next volatility period is around September 24th.
However, we should closely monitor the movements around September 18th, which is also the volatile period for BTC.
The key is whether it can find support near 3.0361 and rise above 3.4037.
If not, we should check for support near 2.9092.
The 3.0361 level is the DOM (60) indicator point on the 1M chart. If it finds support near this level and rises, it could potentially lead to a long-term, step-like uptrend.
However, since the HA-High ~ DOM (60) range on the 1D chart is currently formed in the 3.4037-3.4540 range, a breakout above this range is expected to initiate a stepwise uptrend.
-
Thank you for reading to the end.
I wish you successful trading.
--------------------------------------------------
- Here's an explanation of the big picture.
(3-year bull market, 1-year bear market pattern)
I will provide more details when the bear market begins.
------------------------------------------------------
Check if it can rise above 347.21
Hello, traders!
Follow us to get the latest updates quickly.
Have a great day!
-------------------------------------
(TSLA 1D chart)
The key is to determine which direction the price breaks out of the two support and resistance areas of 268.07-311.48 and 347.21-382.40.
For a step-up trend to occur, the price must remain above 334.09-347.21.
However, a step-up trend is highly likely only if the price rises above the support and resistance levels of 382.40 and 421.06 on the 1W and 1M charts.
Even so, a larger increase is likely if the price rises above the 334.09-347.21 range on the 1D chart.
-
The 268.07-311.48 range also falls within the HA-High indicator.
Therefore, it's important to remember that the current position is not a buy position, but rather a sell position.
However, for new buys, it's best to initiate them when support is found near the M-Signal indicator on the 1M chart, if possible.
Therefore, when the 268.07-311.48 range acts as a support zone, it can be considered a buying opportunity.
However, since it's within the HA-High indicator zone, trades should be executed with short and quick responses.
The key volatility period is around October 7th, but before that, we should check the movements around September 5th and September 12th.
At this time, the trend is likely to be determined by which direction the price moves: the 268.07-311.48 range or the 347.21-382.40 range.
-
Thank you for reading to the end.
I wish you successful trading.
--------------------------------------------------

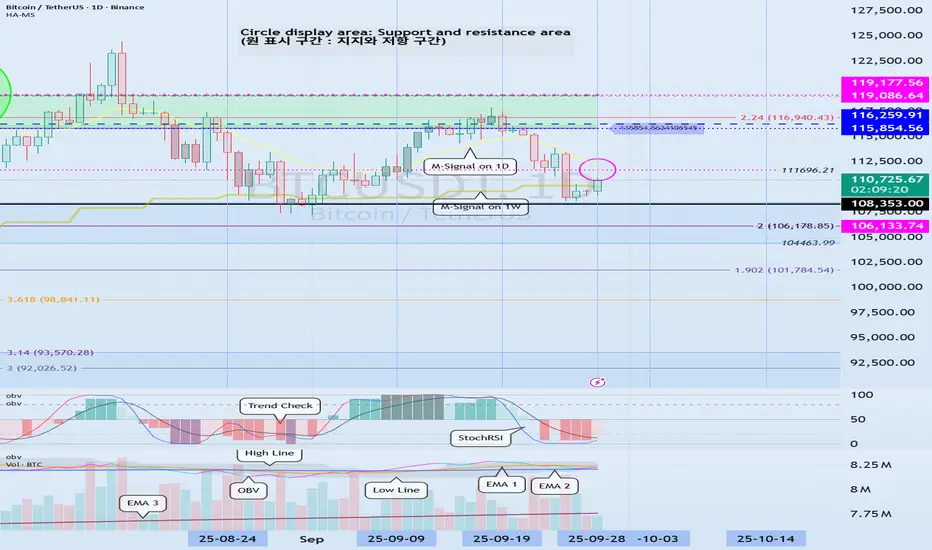
Check for support near 111696.21
Hello, traders!
Follow us to get the latest information quickly.
Have a great day!
-------------------------------------
(BTCUSDT 1D chart)
The TC (Trend Check) indicator appears to have risen above the 0 level.
Accordingly, the key question is whether support can be found around 111696.21.
For the uptrend to continue, the OBV indicator must rise above the High Line and remain so.
-
The volatility period in September is expected to occur around September 9th, September 19th, and September 28th.
-
Thank you for reading.
I wish you successful trading.
--------------------------------------------------
- This is an explanation of the big picture.
(3-year bull market, 1-year bear market pattern)
I will explain in more detail when the bear market begins.
------------------------------------------------------

Checking for support near 171.26
Hello, traders!
Follow me to get the latest information quickly.
Have a great day!
-------------------------------------
(NVDA 1M chart)
The basic trading strategy is to buy in the DOM(-60) ~ HA-Low range and sell in the HA-High ~ DOM(60) range.
However, if the price rises from the HA-High to DOM(60) range, a step-like uptrend is likely, while if it falls from the DOM(-60) to HA-Low range, a step-like downtrend is likely.
Therefore, the basic trading strategy should be a segmented trading strategy.
-
Looking at the current 1M chart, the HA-High to DOM(60) range is 121.80-138.23.
Therefore, if the price holds above 121.80-138.23, the step-like uptrend is likely to continue.
The left Fibonacci ratio was drawn in the first wave, and the key is whether the price can rise above 3.618 (181.85) and hold.
The right Fibonacci ratio was drawn in the second wave, and the key is whether the price can rise above 1 (198.88).
Therefore, the key question is whether the price can break above the 181.85-198.88 range.
If the price fails to rise,
1st: 152.89
2nd: 121.80-138.23
We need to check for support near the 1st and 2nd levels above.
-
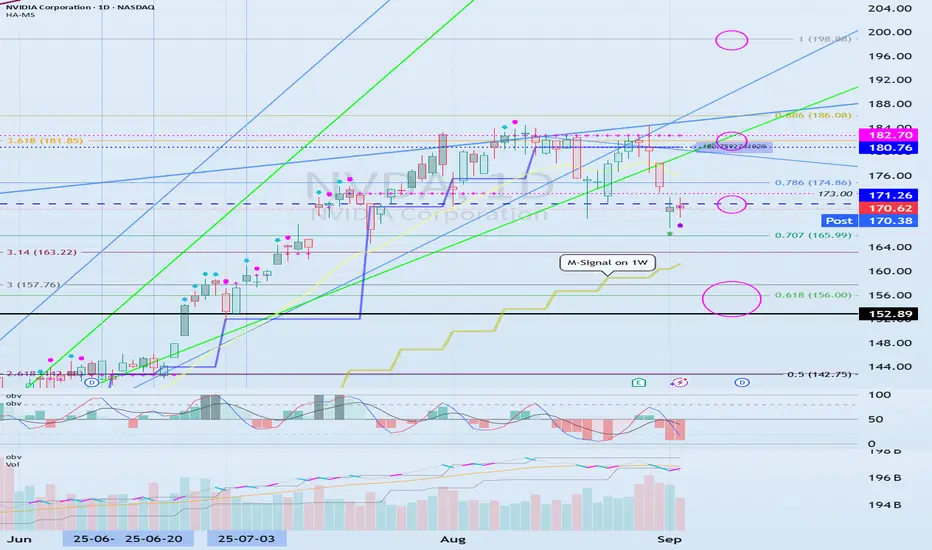
(1D chart)
The HA-High ~ DOM(60) range on the 1D chart is 180.76-182.70.
Therefore, for a stepwise uptrend to begin, the price must rise above 180.76-182.70 and maintain its position.
The 171.26 level is the HA-High indicator level on the 1W chart.
Therefore, the key question is whether support is found near 171.26.
If it falls below 171.26, it is likely to decline until it meets the M-Signal indicator on the 1W chart.
At this point, the key is whether it can find support near 152.89, the Fibonacci 3 level (157.76) to the left.
If it falls below the M-Signal indicator on the 1W chart, there is a possibility of a downtrend, so you should consider a response plan.
------------------------------------------------
If this is your first time hearing this explanation, you may not understand what I'm talking about.
The important thing is that the DOM(-60) and HA-Low indicators indicate lows, while the DOM(60) and HA-High indicators indicate highs.
Therefore, buys should be made near the DOM(-60) and HA-Low indicators, and sells should be made near the DOM(60) and HA-High indicators.
To interpret charts from a long-term perspective, you need to check the positions of the DOM(-60), HA-Low, HA-High, and DOM(60) indicators on the 1M chart.
The 1W chart is interpreted from a medium- to long-term perspective, while the 1D chart is interpreted from a short-term perspective.
In the stock market, price fluctuations are often driven by issues other than the chart itself, so it's important to always be aware of volatility.
Even so, since volatility ultimately occurs after the chart is created, it's best to analyze the chart first and then examine other issues.
Otherwise, you'll likely end up creating a trading strategy that heavily reflects your own subjective opinions.
-
Thank you for reading to the end.
I wish you successful trading.
--------------------------------------------------
The key is whether the price can rise above 240.55 and hold
Hello, fellow traders!
Follow me to get the latest information quickly.
Have a great day.
-------------------------------------
(AAPL 1D chart)
The basic trading strategy is to buy in the DOM(-60) ~ HA-Low range and sell in the HA-High ~ DOM(60) range.
However, if the price rises from the HA-High to DOM(60) range, a step-like uptrend is likely, while if it falls from the DOM(-60) to HA-Low range, a step-like downtrend is likely.
Therefore, the basic trading strategy should be a segmented trading strategy.
-
The HA-High to DOM(60) range on the current 1D chart is 229.27-232.78.
Therefore, if the price remains above the 229.27-232.78 range, a step-like uptrend is highly likely.
However, looking at the chart overall, the 226.67-240.55 range corresponds to the HA-High indicator.
Therefore, it is necessary to check for support within the 226.67-240.55 range.
If it rises above 240.55, it is expected to attempt to rise to the 250.42-260.10 range.
The 250.42 and 255.59 levels correspond to the DOM(60) indicator on the 1M chart and the DOM(60) indicator on the 1W chart, respectively.
Therefore, to sustain the mid- to long-term uptrend, the price must rise above 250.42-255.59 and maintain its position.
-
Based on the basic trading strategy mentioned earlier, this is currently within the range for a partial sell-off.
Buying in this range requires a short and quick response, so be cautious.
Buying is possible when the 226.67-240.55 range shows support.
If it falls below 226.67, cut your losses and wait to see how the situation develops.
If the price falls below the M-Signal indicator on the 1M chart and remains there, there's a possibility of a medium- to long-term downtrend, so a countermeasure is needed.
-
The HA-Low indicator on the 1D chart is currently at 192.31.
This point is located within the previous all-time high (ATH) range of 182.94-199.62, making the 182.94-199.62 range an important support area.
-
(1M chart)
The area highlighted by the circle represents an important area.
-
Thank you for reading to the end.
I wish you successful trading.
--------------------------------------------------

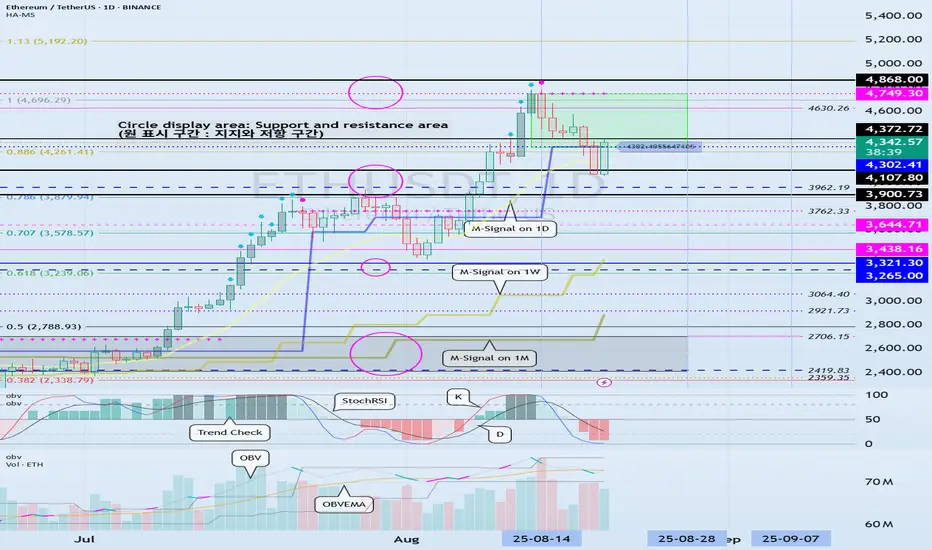
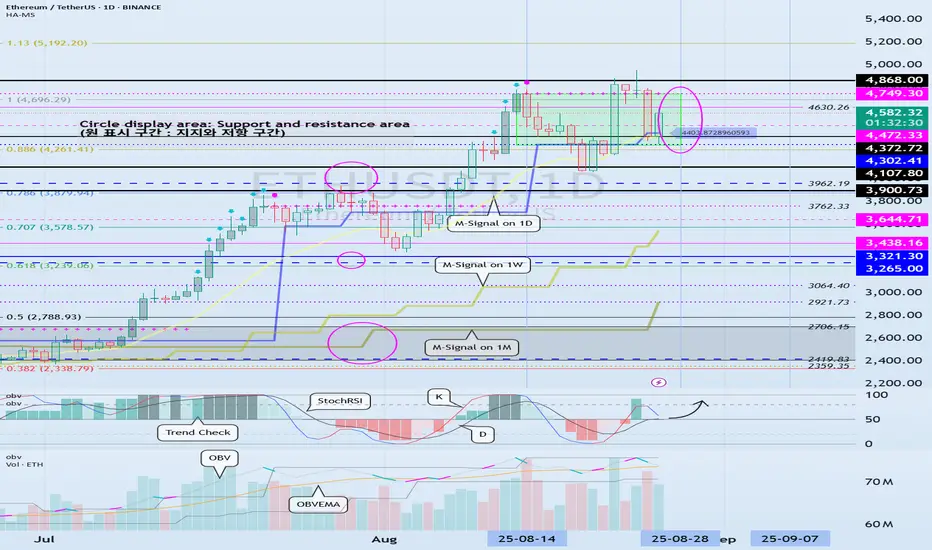
Volatility Period: Around August 28 (August 27-29)
Hello, fellow traders!
Follow us to get the latest information quickly.
Have a great day!
-------------------------------------
(ETHUSDT 1D chart)
It's rising, with support near 4372.72.
However, since the TC (Trend Check) indicator is at 0, it's unclear where the price will bounce.
Therefore, we need to determine whether support is found around 4630.26 or whether the price falls below 4472.33.
This period of volatility is expected to last from August 27th to 29th.
-
To initiate a cascading upward trend, support must be found around 4749.30.
-
Thank you for reading to the end.
I wish you successful trading.
--------------------------------------------------
- This is an explanation of the big picture.
(3-year bull market, 1-year bear market pattern)
I will explain in more detail when the bear market begins.
------------------------------------------------------
The key is whether it can rise above 237.60
Hello, fellow traders!
Follow us to get the latest information quickly.
Have a great day.
-------------------------------------
(SOLUSDT 1M Chart)
To understand the strangely drawn trendline, you need to refer to the StochRSI indicator.
This is because the StochRSI indicator was used to draw the trendline.
When the K indicator of the StochRSI forms a peak in the overbought zone, a trend line is drawn by connecting those peaks. When the K indicator forms a peak in the oversold zone, a trend line is drawn by connecting those peaks.
When drawn this way, the trend line drawn in the overbought zone becomes the high trend line, and the trend line drawn in the oversold zone becomes the low trend line.
However, due to the long timeframe of the 1M chart, the high and low trend lines are not separated and are instead displayed as a single line.
Of the three trend lines, we need to determine whether the upward trend can continue along trend line (1).
The DOM (60) indicator is forming at 237.60, so the key question is whether it can break above this level.
Illegible areas are marked with circles.
-
(1W Chart)
Looking at the explanation of the big picture below, a major bear market is expected to begin in 2026.
However, the trend lines drawn on the chart suggest that the upward trend could continue until the first quarter of 2026.
With time remaining until the end of 2025, we need to closely monitor BTC's movements.
The DOM (60) indicator on the 1M chart is at 237.60, so the key question is whether it can break above 237.60 and maintain its price.
However, the DOM (60) ~ HA-High range formed in the 202.45-222.61 range on the 1W chart, so whether it can find support within this range is crucial.
Accordingly, the volatility period on the 1W chart is the period around the week of September 29th, i.e., September 22nd to October 5th.
Please refer to the circled area on the 1M chart for the important period.
-
(1D chart)
This volatility period ends on August 29th.
The next volatility period will be around September 7th.
After the volatility period around September 7th, we need to see if the price remains above 195.92.
If the price remains above trendline (1), it is highly likely that an attempt to rise above 222.61 will occur.
---------------------------------
As mentioned earlier on the 1W chart, the key question is whether the price can rise above 237.60.
To draw a line, we need to examine whether the 202.45-222.61 range provides support and can move upward.
From this perspective, if the 202.45-222.61 range provides support, it's considered a buying opportunity.
However, considering the basic trading strategy, buying in the DOM(-60) ~ HA-Low range and selling in the HA-High ~ DOM(60) range is necessary, so we can see that this is actually a selling opportunity.
Therefore, executing a new purchase in the 202.45-222.61 range requires a short and quick response.
If you maintain a basic trading strategy, you can either sell in installments to gain psychological stability or choose to purchase additional shares when the 202.45-222.61 range provides support.
-
Some people argue that support and resistance aren't important, but rather whether the price will rise or fall.
Yes, I agree with this.
However, to move up or down, you need to understand the support and resistance points or ranges that serve as reference points.
If you can't distinguish between these, you won't be able to trade, regardless of whether the price is rising or falling.
Therefore, you need to evaluate how important the support and resistance points or ranges formed at the current price are.
If you don't understand this, you'll end up trading by buying late after the price has risen or selling late after the price has fallen.
-
Thank you for reading to the end.
I wish you successful trading.
--------------------------------------------------
- This is an explanation of the big picture.
(3-year bull market, 1-year bear market pattern)
I will explain in more detail when the bear market begins.
------------------------------------------------------

Important range: 115854.56-119177.56
Hello, traders!
Follow us for quick updates.
Have a great day!
-------------------------------------
(BTCUSDT 1D chart)
This period of volatility is expected to last from August 23rd to 25th.
It found support near 111696.21 and rose above 115854.56.
Therefore, the key question is whether it can find support near 115854.56 and rise above 119177.56.
If it falls below 115854.56, it could fall to around 108353.0.
If it rises above 119177.56 this time and holds, it could attempt to rise near the right Fibonacci level 2.618 (133889.92) during the next volatility period, around September.
Therefore, we should watch for support in the HA-High ~ DOM (60) range of 115854.56-119177.56 and see if it rises above that level.
-
Looking at the OBV indicator of the Low Line ~ High Line channel, it appears to be transitioning into a downward channel.
Therefore, if the OBV indicator fails to rise above the High Line, there is a possibility of forming a short-term top.
-
Thank you for reading to the end.
I wish you successful trading.
--------------------------------------------------
- Here's an explanation of the big picture.
(3-year bull market, 1-year bear market pattern)
I will explain more in detail when the bear market begins.
------------------------------------------------------

The key is whether it can find support near 44.46 and rise
Hello, fellow traders.
Follow us to get the latest information quickly.
Have a great day.
-------------------------------------
(ZECUSDT 1M chart)
It appears to have broken away from the long-term downtrend line (1).
However, to initiate an uptrend, the price must remain above the M-Signal indicator on the 1M chart.
The key is whether the price can rise above 56.29 and hold its value.
-
(1D chart)
The key is whether the price can find support around 44.46 and rise above 49.89-56.29.
To achieve this, we need to see whether the price remains above the M-Signal indicator on the 1M chart after the volatility period around September 1st.
If it fails and falls, we need to check for support near the first and second levels above:
1st: 37.69
2nd: 31.08-33.69
- Thank you for reading.
We wish you successful trading.
--------------------------------------------------
- This is an explanation of the big picture.
(3-Year Bull Market, 1-Year Bear Market Pattern)
I will explain more in detail when the bear market begins.
------------------------------------------------------

Check for support near 4302.41-4372.72
Hello, traders!
Follow us to get the latest updates quickly.
Have a great day!
-------------------------------------
(BTC.D 1M chart)
For an altcoin bull market to begin, the price must either fall below 55.01 and hold or continue its downward trend.
(USDT.D 1M chart)
I believe that USDT dominance must remain below 4.91 or continue its downward trend for the coin market to continue its upward trend.
The maximum decline in 2025 is expected to be around 2.84-3.42.
After that, the coin market is expected to enter a bear market with an upward trend.
------------------------------------
(ETHUSDT 1D chart)
It touched the previous all-time high (ATH) range of 3900.73-4107.80 and is showing an upward trend above 4302.41.
Therefore, we need to check whether it can find support around 4302.41-4372.72.
To continue the step-up trend, it's expected to rise above 4749.30.
-
When a new candlestick is formed, a low trend line is expected to form, consolidating the trend line as shown below.
Therefore, the key question is whether the price can rise along the rising channel after the volatility period around August 28 (August 27-29).
-
The 4302.41-4749.30 range represents a high-boundary zone, requiring a short and quick response when trading.
Therefore, if the price finds support near 4302.41 and rises, it would be wise to develop a trading strategy based on the assumption that the first sell-off will occur around 4749.30.
For the uptrend to continue, rising above 4749.30,
- the StochRSI indicator must remain upward with K > D,
- the OBV must rise above the High Line and remain upward,
- the TC (Trend Check) indicator must remain upward. (Preferably, it should show an upward trend above 0.)
If the above conditions are met, I believe the uptrend is likely to continue.
-
If the price falls below 4302.41,
1st: 3900.73-4107.80
2nd: M-Signal on the 1W chart
We need to check for support near the 1st and 2nd levels above.
-
The basic trading strategy is to buy in the HA-Low ~ DOM (-60) range and sell in the HA-High ~ DOM (60) range.
However, if the price rises from the HA-High to DOM(60) range, it is likely to exhibit a step-like upward trend, while if it falls from the HA-Low to DOM(-60) range, it is likely to exhibit a step-like downward trend.
Therefore, the basic trading strategy should be a segmented trading strategy.
If you purchase a new position because the price appears to be supporting the HA-High to DOM(60) range, you should execute the trade quickly and with short-term responses.
Otherwise, if the price falls below the HA-High indicator, it is likely to decline until it meets the HA-Low or DOM(-60) indicator.
-
Thank you for reading to the end.
I wish you successful trading.
--------------------------------------------------
- This is an explanation of the big picture.
(3-year bull market, 1-year bear market pattern)
I will explain in more detail when the bear market begins.
------------------------------------------------------