SPY 20JAN 2026 READ DESCRIPTIONSpy is about to hit this level. Just be careful if you are short.
Market can easily bounce and go up from here.
I am travelling and will try to update spy weekly asap.
Microsoft (MSFT)

Microsoft. Great business. Tough tape.Microsoft came into the year priced for AI dominance and flawless execution. The business still delivers. The stock does not have the same margin for error. Rallies into the 430–440 zone have failed. Buyers hesitate. Sellers appear. That tells you expectations are heavy.
The OpenAI advantage is narrowing at the margin. Models are commoditising faster than the market expected. Compute is expensive but available. Distribution still matters, and Microsoft owns it, but narrative premiums are compressing. That hits multiples, not revenues.
Capex is the next pressure point. Data centre spend is enormous and visible. Investors are no longer waving it through. They want returns, timelines and proof. Add political and social scrutiny around power usage and infrastructure and the risk premium rises.
There is also internal tension. AI boosts productivity but threatens parts of Microsoft’s legacy software economics. Copilot is strategic. It is also cannibalistic. Transitions like that are rarely clean in the eyes of the market.
Competition matters too. Alphabet is executing better. The gap story is fading, even if Microsoft remains the enterprise leader.
If 400 breaks, momentum traders step away and 370 becomes the natural magnet . That is where longer-term investors may return.
Microsoft remains a great business. This year, it is a crowded trade adjusting to reality. The stock feels like digestion, not discovery.
The forecasts provided herein are intended for informational purposes only and should not be construed as guarantees of future performance. This is an example only to enhance a consumer's understanding of the strategy being described above and is not to be taken as Blueberry Markets providing personal advice.

Stock Market Forecast | BTC TSLA NVDA AAPL AMZN META MSFT0:00 Intro & Overview
0:22 Sector Data & Sentiment
2:42 Dark Pools (RSP & MAG7)
6:44 S&P 500 (SPY)
9:21 Nasdaq 100 (QQQ)
11:37 Bitcoin (BTC)
15:04 Tesla (TSLA)
18:17 Meta (META)
22:03 Amazon (AMZN)
23:25 Microsoft (MSFT)
26:54 Google (GOOGL)
31:16 Apple (AAPL)
34:58 Nvidia (NVDA)
37:26 Outro
Stock Market Forecast | BTC TSLA NVDA AAPL AMZN META MSFT
SP:SPX AMEX:SPY CME_MINI:ES1! CME_MINI:NQ1!

Microsoft (MSFT) shares fall below $460Microsoft (MSFT) shares fall below $460
As the Microsoft (MSFT) share chart shows:
→ yesterday’s candle closed below $460 — the lowest level since early June last year;
→ the decline from the all-time high near $550 has exceeded 16%.
Why MSFT shares are falling
The downward move may reflect a shift in market sentiment from AI-driven euphoria to a more sober reassessment of the actual returns on investment. Investors are locking in profits amid concerns that the company’s current infrastructure spending may not pay off in the near term.
Concerns have been reinforced by media reports of:
→ disappointing sales momentum for its AI products (Microsoft 365 Copilot);
→ intensifying competition, including from Google Gemini and Amazon AWS;
→ rising capital expenditure (forecast at more than $80bn per year).
Technical analysis of Microsoft (MSFT) shares
From a long-term perspective, the share price continues to move within a key ascending channel. In this context:
→ the lower boundary acted as support in April 2025;
→ the upper boundary has served as resistance. The orange arrows highlight aggressive selling pressure whenever the price moves beyond it. The black arrow points to rising volumes during the price decline in early November — a bearish signal following overbought conditions;
→ the QH line, which divides the upper half of the channel into two parts, has switched from support to resistance near the psychological $500 level;
→ the current price has fallen towards the channel’s median, where supply and demand typically come into balance (marked by the blue arrow).
In light of the above, it is reasonable to assume that the market may find an equilibrium that could persist until 28 January, when the quarterly earnings report is scheduled for release.
This article represents the opinion of the Companies operating under the FXOpen brand only. It is not to be construed as an offer, solicitation, or recommendation with respect to products and services provided by the Companies operating under the FXOpen brand, nor is it to be considered financial advice.

Stock Market Forecast | BTC TSLA NVDA AAPL AMZN META MSFT0:00 Intro
0:19 Sector Data
0:44 Sentiment Data
1:38 Dark Pools (Mag 7 ETF)
5:10 S&P 500 (SPY)
7:12 Nasdaq 100 (QQQ)
10:46 Bitcoin (BTC)
13:44 Tesla (TSLA)
16:39 Meta (META)
18:16 Amazon (AMZN)
19:11 Microsoft (MSFT)
21:35 Apple (AAPL)
23:55 Nvidia (NVDA)
26:06 Outro
QQQ stock market Forecast
Nvidia Stock NVDA Forecast
Apple Stock AAPL Forecast
Microsoft Stock MSFT Forecast
Google Stock GOOGL Forecast
Amazon Stock AMZN Forecast
Meta Forecast Technical Analysis
Tesla Stock TSLA Forecast
Magnificent 7 stocks forecast
Bitcoin BTC forecast
CRYPTOCAP:BTC SP:SPX NASDAQ:NDX NYMEX:NG1!
#daytrading #btc #stockmarketanalysis #nvda #tsla #aapl #msft #technicalanalysis #stockmarketeducation #mag7

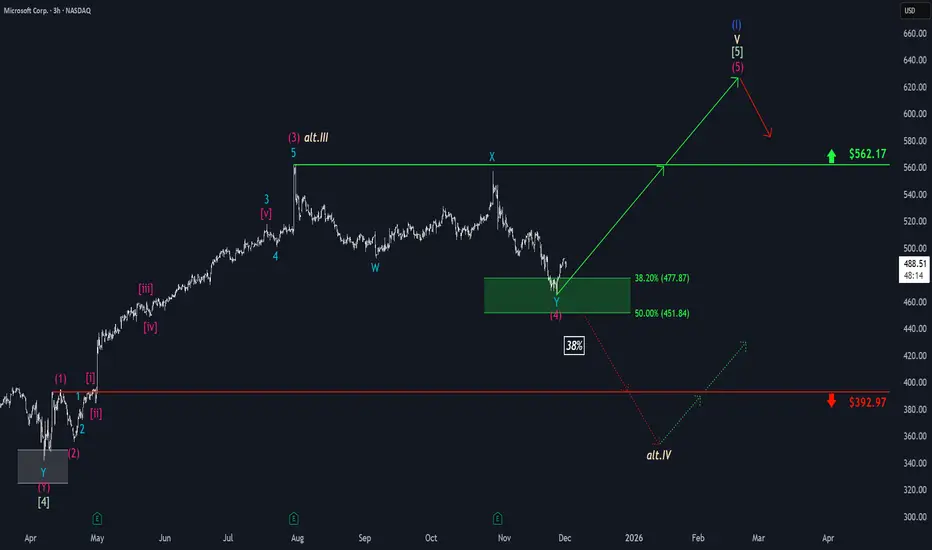
Microsoft: Back in the Target Zone!Microsoft’s stock has slid back, settling again within our green Target Zone between $477.87 and $451.84. We anticipate an imminent upward movement as part of the magenta wave (5), which is expected to push price beyond the resistance at $562.17. Just above this level, the large blue wave (I) is likely to complete before a significant correction begins. There’s also a 38% chance of additional selling pressure below the support at $392.97. In this case, the high of $562.17 would align with the beige wave alt.III , while the low of wave alt.IV would form below $392.97.

MSFT: Risk of a buyer trap near the upper boundary of the rangeThe beginning of a new year is a good time to look at the annual and monthly timeframes.
Hello traders and investors!
Annual chart
On the annual timeframe, the buyer initiative remains intact. The range of the annual initiative is as follows:
lower boundary — 213.43,
upper boundary — 555.45,
50% of the initiative — 384.44.
A key level to highlight is 349.67 — the upper boundary of the previous buyer initiative on the annual chart. This level has already been retested, and the current active level is 344.79. This area represents an important structural support zone in the event of a deeper correction.
It is also important to note that, on last year’s candle, the minimum price range where at least 50% of the volume was traded is located in the upper part of the candle. In fact, this entire area is above the previous annual high, which indicates sustained buyer interest at higher prices.
Monthly chart
On the monthly timeframe, the market remains in a sideways range that was formed back in 2024. In March–April 2025, there was a manipulation of the lower boundary of this range — a false breakout on increased volume followed by a return of price back into the range.
As a result, a buyer zone was formed with an upper boundary at 402.15. The manipulated level 385.58 also stands out, as it nearly совпides with 50% of the annual trading range (384.44). This confluence strengthens the importance of the area and makes it attractive for searching for long-term buying opportunities.
The buyer managed to push the price above the upper boundary of the range (468.35), but failed to develop the initiative further. The structure formed above this level (468.35) strongly resembles a manipulation (false breakout). Despite the previously noted sustained buyer interest at higher prices, in the current context this move may turn into a trap for late buyers.
Above the upper boundary of the range, all candles with increased volume are seller candles, indicating seller pressure and a lack of further result from the buyer side.
If the price returns back into the range, the first resistance will be 450.12 (50% of the range). If this level fails to hold the price, the probability increases for gap closures below, with a move into the 402.15–385.58 area, where it makes sense to closely monitor patterns for long-term buying, provided there is confirmation from volume and initiative structure.
On the daily timeframe , the market is in a sideways range.
The price has broken out of this range to the downside, and if the seller now initiates a trend by forming another initiative, this could indicate a decline in price toward 450 and then further down to 402.
Profitable trades!
This analysis is based on the Initiative Analysis (IA) method.

Stock Market Forecast | BTC TSLA NVDA AAPL AMZN META MSFTQQQ stock market Forecast
Nvidia Stock NVDA Forecast
Apple Stock AAPL Forecast
Microsoft Stock MSFT Forecast
Google Stock GOOGL Forecast
Amazon Stock AMZN Forecast
Meta Forecast Technical Analysis
Tesla Stock TSLA Forecast
Magnificent 7 stocks forecast
Bitcoin CRYPTOCAP:BTC forecast
SP:SPX NASDAQ:NDX CME_MINI:NQ1! CME_MINI:ES1!

MSFT accumulation phaseAfter all that buying on the left, smart money is accumulating longs again by creating a trading range.
They had a stop hunt to grab a ton of orders, then kept buying on the lows of the range. Just before they move prices higher, they have a shake out to get rid of weak hands who keep selling into their uptrend. The volume is much lower on the retest of the shakeout bar, which means No Supply, now they are confident that there are no more sellers to slow their move up until they reach new highs (liquidity). Breakout to new highs will get retail traders to buy so they can sell into without driving prices down. Target is at a 50 percent retracement

Stock Market Forecast | BTC TSLA NVDA AAPL AMZN META MSFTQQQ stock market Forecast CME_MINI:ES1! SP:SPX NASDAQ:NDX
Nvidia Stock NVDA Forecast
Apple Stock AAPL Forecast
Microsoft Stock MSFT Forecast
Google Stock GOOGL Forecast
Amazon Stock AMZN Forecast
Meta Forecast Technical Analysis
Tesla Stock TSLA Forecast
Magnificent 7 stocks forecast
Bitcoin CRYPTOCAP:BTC forecast

Stock Market Forecast | BTC TSLA NVDA AAPL AMZN META MSFTQQQ stock market Forecast
Nvidia Stock NVDA Forecast
Apple Stock AAPL Forecast
Microsoft Stock MSFT Forecast
Google Stock GOOGL Forecast
Amazon Stock AMZN Forecast
Meta Forecast Technical Analysis
Tesla Stock TSLA Forecast
Magnificent 7 stocks forecast
Bitcoin CRYPTOCAP:BTC forecast
SP:SPX NASDAQ:NDX CME_MINI:ES1!

MICROSOFT Hit a WALL. DOUBLE TOPPED and WILL DROPPrice action has confirmed and triggered a double top pattern.
Calling tops in tech is dangerous as we all know.
But as Tech fatigue hits, and selloffs quicken, the risk of a deeper shakeout increases.
Remember US stock market is 230% of GDP.
With increasing Job Losses.

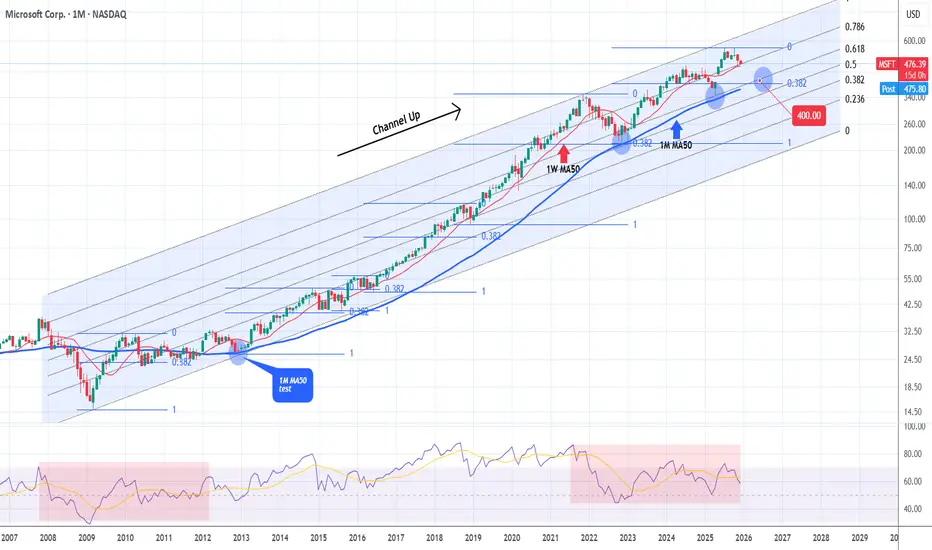
MICROSOFT testing the most important Support of the Cycle.Microsoft (MSFT) hit last month its 1W MA50 (red trend-line) and held. The rebound seems short-lived however as again half-way through December, the market is about to re-test that Support again.
This is a critical Support level for the Bull Cycle that started upon the November 2022 market bottom, as the last two times this broke, the price pulled-back to the 1M MA50 (blue trend-line).
That level has in fact been the ultimate long-term Support since 2012, the most important level of the Channel Up that started after the 2008 Housing Crisis.
We also see here that almost all of the strong bearish corrections within this pattern, hit the 0.382 Fibonacci retracement level and rebounded.
As a result, if 1W MA50 breaks again, we expect the subsequent correction / Bear Cycle to hit $400 at least.
---
** Please LIKE 👍, FOLLOW ✅, SHARE 🙌 and COMMENT ✍ if you enjoy this idea! Also share your ideas and charts in the comments section below! This is best way to keep it relevant, support us, keep the content here free and allow the idea to reach as many people as possible. **
---
💸💸💸💸💸💸
👇 👇 👇 👇 👇 👇
MSFT Selling Pressure Activated — Time to Short!🔥 MSFT Bearish Profit Playbook — Thief-Style Layer Attack Activated! 🔥
Asset: MSFT — Microsoft Corporation (NASDAQ)
Style: Swing / Day-Trade Playbook 📉💼
📉 Plan: Bearish Pressure Play — Smart Sell-Side Thief Approach
Microsoft is showing potential exhaustion on the upside, and this setup focuses on a structured bearish move using a layered sell-limit strategy (Thief Layer Method) 😎🕵️♂️.
🎯 Entry Strategy (Thief Layer Method)
Using the thief-style multi-layer approach, we stack multiple sell-limit orders at different levels to catch premium liquidity:
Sell Limit Layers:
$500, $490, $480
(You can increase or adjust layers based on your own risk tolerance.)
This method aims to fade upward pushes, catching price exhaustion during liquidity grabs.
🛑 Stop Loss (Risk Control)
This is the Thief SL @ $510 🛑
Note: Dear Ladies & Gentlemen (Thief OG’s), I’m not recommending that you use only my stop-loss. It’s your money — your rules. Manage your risk like a pro. 💼⚠️
🎯 Target (Exit Zones)
We are aiming toward strong support zones + potential oversold zones where bearish momentum may slow.
Main Target: $450
Trap may form — escape with profits before the market police catch us 🚓💨
Note: Dear Ladies & Gentlemen (Thief OG’s), I’m not recommending using only my target. Exit where you feel safe and profitable. 🏦✨
📊 Market Summary (Clean, TV-Safe Explanation)
Bearish attempt based on overextended zones
Layered entries help clip premium during upside wicks
Targeting liquidity pockets near support
SL above structural invalidation
Setup respects TradingView House Rules: No financial advice, no promises, no signals, educational thief-style humor only ✔️
🔗 Related Pairs to Watch (Correlation Insights)
Because MSFT is a heavyweight in tech + NASDAQ index weighting:
1️⃣ NASDAQ:QQQ (NASDAQ 100 ETF)
Strongly correlated
If QQQ rejects from local resistance → MSFT bearish play strengthened
QQQ weakness = tech sector weakness
2️⃣ AMEX:SPY (S&P500 ETF)
Broader market risk sentiment
SPY pullback often pressures mega-caps like MSFT
3️⃣ NASDAQ:AAPL (Apple Inc.)
Moves similarly during liquidity rotations
Apple weakness = added pressure to mega-cap tech basket
4️⃣ NASDAQ:NVDA (Nvidia Corp.)
High-beta tech name
When NVDA loses momentum, MSFT downside probability increases through sector rotation
5️⃣ NASDAQ:GOOGL (Alphabet Inc.)
If large-cap tech corrects collectively, MSFT rarely moves opposite
Perfect correlation watch ⚡
Watching these pairs helps confirm bearish bias through sector-wide confirmation, not isolated signals.
✨ “If you find value in my analysis, a 👍 and 🚀 boost is much appreciated — it helps me share more setups with the community!”
⚠️ Disclaimer:
This is a thief-style trading strategy just for fun.
Educational only — not financial advice. Trade at your own risk. 😄🕵️♂️

Stock Market Forecast | BTC TSLA NVDA AAPL AMZN META MSFTStock Market Forecast | CRYPTOCAP:BTC CME_MINI:ES1! CME_MINI:NQ1! SP:SPX
Mag 7 | TSLA NVDA AAPL AMZN META MSFT GOOGL

Stock Market Forecast | BTC TSLA NVDA AAPL AMZN META MSFTStock Market Forecast | CRYPTOCAP:BTC SP:SPX NASDAQ:NDX CME_MINI:ES1!
Mag 7 | TSLA NVDA AAPL AMZN META MSFT GOOGL

QS V3 Weekly Call Opportunity – MSFT Bullish TrendMSFT Weekly Signal | 2025-12-05
MSFT Weekly Call Option
Direction: Buy Calls (Long / Bullish)
Strike: $482.50
Entry Price: $5.62 – $5.70
Profit Target 1: $8.90 (≈60% gain)
Profit Target 2: $11.20 (≈100% gain)
Stop Loss: $3.90 (≈30% loss)
Expiry: Dec 12, 2025 (7 days)
Position Size: 2% of portfolio
Confidence: 58%
Rationale: Katy AI predicts upward trajectory to ~$497 by Friday; MACD bullish divergence suggests potential multi-day reversal.
Risk Notes: High – Friday expiration with gamma effects; low VIX may reduce premium capture. Monitor actively.

Microsoft: Overvalued but Still Bullish - Watching the 400–450Microsoft NASDAQ:MSFT
1. Quick Trade Plan (for those who want levels first) 🎯
Market Bias: Long term bullish, but in a late phase of the cycle.
Strategy: Don’t chase highs; buy the correction.
📌 Buy Zones
Primary Buy Zone: 400–450 USD
Strong support cluster and the preferred accumulation zone.
Aggressive Early Entries:
450–470 on sharp dips, but main focus remains 400–450.
⛔ Invalidation Level
345 USD
A break below this level invalidates the mid term bullish structure.
🎯 Take Profit Targets
TP1: ~600
TP2: 680–720
Potential completion of the final fifth wave.
🧭 For Current Holders
Continue holding while above 345.
Use a protective stop below 345 if trading shares.
Options traders may hedge instead.
🆕 For New Buyers
Avoid entering near ATHs.
Wait for the 400–450 pullback.
Use 345 as your hard-risk level.
2. Fundamental Overview: Great Business, Clearly Overvalued 💼📊
Microsoft has delivered very stable mid-teens growth for years:
Revenue growth: 15–17 percent annually
EPS growth: also 15–20 percent annually
Last 3 quarters: EPS +9–12 percent, revenue in the same range
This is a mature mega-cap, not a hyper-growth name.
⚠️ Buybacks Stopped
Company regularly bought back shares for six years
Stopped in March 2023 and hasn’t resumed
This removes a major EPS-boosting engine
📉 Valuation (Peter Lynch style)
EPS growth ≈ 15 percent
P/E ≈ 30
Stock trades at ~2x its fundamental fair value
Conclusion:
Amazing business. Predictable. Cash generative. 🔥
But fundamentally overpriced and in the late stage of its growth curve.
3. Technical Picture: Still Bullish, but Late in the Cycle 📐📈
📅 Long Term Channel Since 2010
Price has stayed inside a massive uptrend channel for 14+ years.
As long as MSFT remains inside it, the primary trend stays bullish.
📏 200-Day Moving Average
MSFT consistently bounces from the 200d MA on the weekly.
That keeps the structural bull trend intact.
🌊 Elliott Wave Context
Currently in the 5th sub-wave of a larger 3rd wave
Upside still possible
Potential final wave targets: 600–700
⏳ What Comes After
Once this major wave completes:
Expect a multi-year sideways cycle (5–7 years) as the market distributes the massive positions accumulated since 2009.
4. Current Structure: A Correction Is Likely Before New Highs 🔄
We already saw an A–B–C correction, but structure suggests another A–B–C, forming a zigzag, before the final move higher.
🎯 Why 400–450 Is the Key Zone
Major liquidity & support cluster
Aligns with channel midline and prior consolidation
Perfect area for a 5th wave launch
If MSFT hits 400–450 and bounces → 600–700 is back on the table.
5. What To Do Based on Your Situation 🧭
✔️ If You Already Hold MSFT
Stay in the trade while above 345
Expect volatility
You can hedge or use a stop below 345
🟦 If You Want to Enter
Don’t FOMO near the highs ❌
Wait for a pullback into 400–450
Start with partial size, add on confirmation
345 = hard stop
⚡ If You Trade Short Term
Shorts are counter-trend
Treat every drop as a tactical move, not a macro reversal
Unless 345 breaks
6. Final Thoughts ✨
Microsoft is still in a powerful long term uptrend, but:
Fundamentally overvalued
Technically late stage of its long cycle
Likely to give a clean buyable correction
Best accumulation zone: 400–450
Invalidation: 345
Upside targets: 600–700
It’s a “buy the dip, not the rip” market for MSFT.
Not financial advice — manage risk according to your plan.

MSFT PullbackPattern Identified: Bearish Double Top pattern confirmed on Microsoft ( NASDAQ:MSFT ) with neckline break and clear measured move objectives. Neckline Break Triggers Measured Move to Gap Fill.
Key Confluence:
First Top: Initial rejection
Second Top: Failed breakout, lower high
Neckline: Support connecting swing lows between tops
Confirmation: Neckline break & retest completed
Measured Move Calculation:
TP1: Distance from highest top to neckline, projected onto the breakout zone = $430
TP2: Gap fill zone from May 1st, 2025 = $400
SL: Above Neckline at previous confirmation

Resurfacing fears of AI overinvestment triggered by MSFT
A report claimed that Microsoft (MSFT) had lowered AI product sales growth targets across several divisions by as much as 50% for the current fiscal year, after many sales teams failed to meet targets for the fiscal year ending June 2025.
Although MSFT swiftly denied the report, it reignited investor concerns about AI monetization and the risk of overinvestment.
Adding to the unease, IBM CEO Krishna warned that even trillions of dollars invested in AI data centers cannot deliver meaningful returns under current cost structures, further fueling market anxiety.
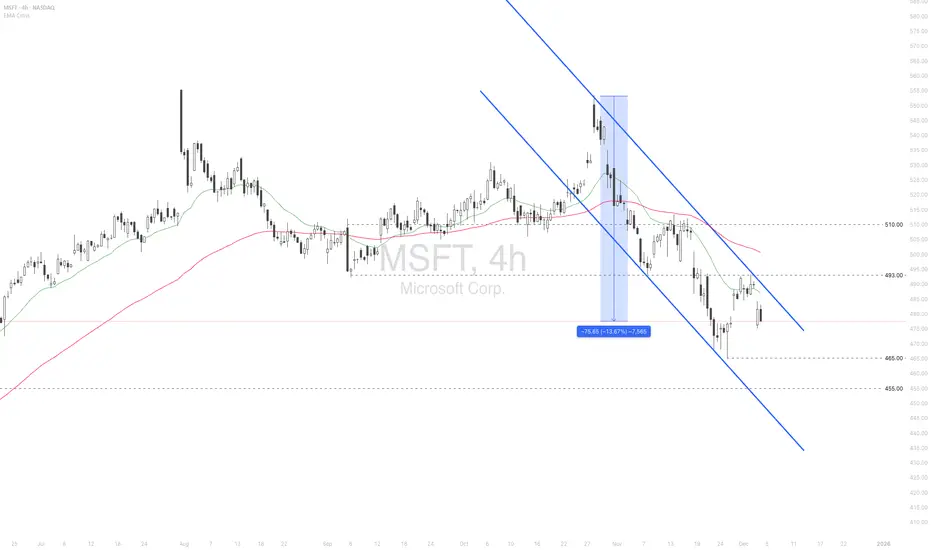
MSFT briefly tested the resistance at 493.00 before falling below EMA21. The price remains below bearish EMAs, indicating a potential downtrend continuation.
If MSFT fails to close above EMA21, the price could retreat toward the following support at 465.00.
Conversely, if MSFT breaches above EMA21 and 493.00, the price may advance toward the next resistance at 510.
Microsoft (NASDAQ: $MSFT) Drops as AI Sales Miss Targets Microsoft (NASDAQ: NASDAQ:MSFT ) slid more than 2% after a report from The Information claimed that the company had reduced growth targets for its AI products because sales teams failed to meet expectations. The report highlighted that several Azure sales units missed ambitious quotas tied to Foundry—Microsoft’s enterprise AI platform used to build and manage autonomous AI agents. According to the report, less than 20% of salespeople in one U.S. Azure division hit the 50% Foundry growth target, while another team initially faced a quota requiring them to double sales.
Microsoft quickly refuted the claims, stating that The Information conflated growth projections with internal quotas. The company emphasized that “aggregate sales quotas for AI products have not been lowered,” reaffirming the strength and ambition of its broader AI roadmap. Despite the clarification, the stock reacted sharply, reflecting heightened sensitivity around AI monetization as enterprise adoption continues to lag expectations.
Although AI is transforming workflows and offering automation opportunities, the adoption curve for enterprise-scale AI agents remains slower compared to consumer AI breakthroughs. Competitors including Google, Amazon, Anthropic, Salesforce, and OpenAI all face similar challenges as traditional organizations navigate data integration, reliability issues, and operational risk.
Technical Outlook
From the chart, MSFT has pulled back sharply from its $555 resistance zone and is now retesting a key support level around $465. This area aligns with previous structure and may act as short-term demand. A breakdown below $465 opens room for a deeper decline toward the $450 level. However, holding this support could trigger a rebound back toward the $555 region. Momentum remains neutral-bearish, with price sitting below the recent swing highs.

Microsoft: Target Zone Hit!Microsoft has reached our green Long Target Zone between $451.84 and $477.87 as anticipated. In the meantime, the stock has successfully completed the magenta wave (4) and has since broken out of the Target Zone to the upside. We now expect further gains as wave (5) unfolds, targeting a move above the resistance at $562.17, where the larger blue wave (I) is expected to conclude. After that, we anticipate a pronounced correction phase. However, there remains a 38% chance that MSFT could break down through the Target Zone and fall below the support at $392.97. In this case, we would reclassify the last significant high at $562.17 as the top of the beige wave alt.III and prepare for a new low in wave alt.IV .
Stock Market Forecast | BTC TSLA NVDA AAPL AMZN META MSFTStock Market Forecast | CRYPTOCAP:BTC SP:SPX NASDAQ:NDX NASDAQ:QQQ
Mag 7 | TSLA NVDA AAPL AMZN META MSFT GOOGL
