Microsoft H1 Trading The Bullish Triangle BreakIn this update we review the recent price action in #Microsoft and identify the next high probability trading opportunity and price objectives to target
Microsoft (MSFT)

vroom Final phase before stock split☢️🔻⚠️☢️🔻As per the last 10k Filing .
This is so bad and don't invest in the stock right now.
You will lose money!
One final way to make money is short it if it goes high. If it goes 10 -20% short it 1x Leverage, 50-100% short it 5x or 10x leverage.
Don't long on this one. Past 900 days this stock is pure red and financials are so bad and more over Antara capital who is famous for shorting is invested in this.
☢️🔻☢️⚠️
========
We may not be able to generate sufficient revenue to generate positive cash flow on a sustained basis.We cannot assure you that we will generate sufficient revenue to offset the cost of maintaining our platform and operations. In line with the reduced unit sales contemplated by our Realignment Plan, our revenue has declined from $3,184.3 million for the year ended December 31, 2021 to $1,948.9 million. Our revenue growth also may be adversely affected by our inability to acquire and appropriately price vehicle inventory, provide the customer experience needed to attract customers or execute effective marketing campaigns to increase traffic to our platform. We expect our revenue to decline in the short term as we implement our long-term roadmap. You should not consider our historical revenue growth as indicative of our future performance. If our revenue declines our business, financial condition and results of operations will be materially and adversely affected.
========

Will it hit 100?Once it breaks above 73, there is a high chance it could touch 100 within three months. Stop loss 67.

Microsoft SHORTMicrosoft SHORT as shown in wave analysis - pls follow the levels -
keep a sl of swing high +0.3%
always divide ur qtys into small small batches on both side on every trade - to average your cost .

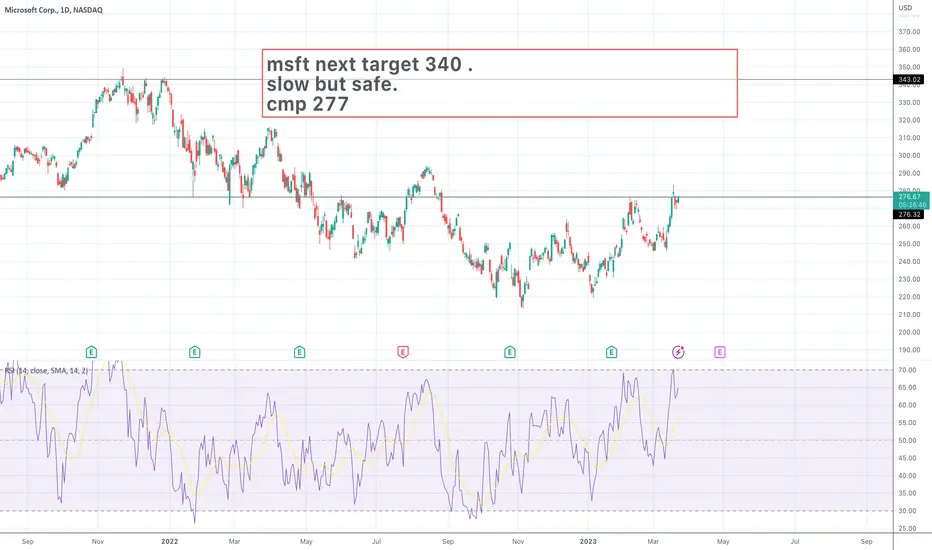
MSFT $350 AND BEYOND Microsoft has been a big player in the AI industry recently and has been making a lot of buzz lately. Their acquisition of ChatGPT was an strategic play against GOOGLE to position themselves better as a search engine. GOOGLE has been the leader as a search engine but things look like they are changing soon.
Other than that, MSFT has a couple good reasons why it is a good investment:
Established brand and resources: Microsoft is an established technology company with significant resources and a long history of innovation. Its vast network of developers and engineers, coupled with its access to cutting-edge technology and data, could give it a significant advantage in the AI market.
Diversification: By entering the AI market, Microsoft could diversify its revenue streams and reduce its reliance on traditional software products. As AI technology continues to develop and become more ubiquitous, Microsoft's investment in this field could position it for long-term growth and success.
Customer base: Microsoft has a large customer base that includes both consumers and businesses. Its AI technology could be integrated into existing products, such as Office 365 and Azure, providing a seamless experience for customers. This integration could create significant value for both Microsoft and its customers, making it an attractive investment opportunity.

MSFT D1 UPDATE ( TECHNICAL )For more updates, please follow my TradingView page, and if you find the content useful, kindly hit the "thumbs up" button to show your support. If you have any queries regarding trading, please feel free to send me a direct message on TradingView. Additionally, please share this content with your friends who may find it beneficial.
Please note that any trading updates provided here are for educational purposes only, and it is always advisable to conduct your own research before making any investment decisions. It is important to ensure that all conditions are met before following any trade plan suggested in this update.

MSFT has shown strong growth over the years and currently has +MSFT is a technology services company that has shown strong growth over the years. According to the data, the stock is currently trading at $279.99 with a 0.53500898% change. The one-month high for the stock is $283.33, while the one-month low is $245.61.
The stock's oscillators rating is "Buy," indicating positive momentum, while the average directional index (14) is at 37.41, suggesting moderate strength in the current trend. The volume is at 3663530, and the average true range (14) is at 5.14944311, indicating high volatility in the stock.
The moving averages rating for MSFT is "Strong Buy," which indicates a positive trend in the stock price. The 20-day exponential moving average is at $271.45996219, while the 50-day exponential moving average is at $263.87531659, and the 200-day exponential moving average is at $253.6958574.
The relative strength index (14) is at 64.71, indicating that the stock is currently in a neutral zone. The stochastic %K (14, 3, 3) is at 78.69, while the stochastic %D (14, 3, 3) is at 77.23, suggesting that the stock is overbought. The MACD level (12, 26) is at 5.63, while the MACD signal (12, 26) is at 5.28, indicating a bullish signal for the stock.
In summary, MSFT has shown strong growth over the years and currently has positive momentum, indicating a potential buying opportunity. However, the stock is currently overbought, and investors should exercise caution before making any investment decisions. It's essential to conduct thorough research and analysis before investing in any stock.

NVDA Nvidia A100 and OpenAI's trend: Long Lower ShadowThe technical rating for NVDA is "Buy." The stock has a strong buy rating for moving averages, and oscillators rating is "Sell." The 1-month high for NVDA is 275.89, and the 1-month low is 204.21.
The stock is currently trading at 271.82, and the change percentage is -0.24038903 with a change of -0.655. The stock has a YTD performance of 83.09204767 and a 5-year performance of 348.69636964.
The volatility week is 3.61977509, and the volatility is 3.86286999.
The technical indicators for NVDA are mixed. The average directional index (14) is 25.53672889, and the commodity channel index (20) is 100.91947669. The relative strength index (14) is 71.93093942, and the stochastic %K (14, 3, 3) is 85.20138725. The stochastic %D (14, 3, 3) is 86.77363202, and the momentum (10) is 16.33.
The moving averages for NVDA are strong buy, with the simple moving average (10) at 263.48646, the exponential moving average (20) at 255.16254544, the exponential moving average (30) at 249.3622347, the exponential moving average (50) at 239.95627651, the exponential moving average (100) at 221.04912237, and the exponential moving average (200) at 199.5298234.
Other technical indicators for NVDA include the awesome oscillator at 24.44188382, the average true range (14) at 7.27553041, the MACD level (12, 26) at 9.77699817, the MACD signal (12, 26) at 8.17087914, the bull bear power at 19.08011698, and the parabolic SAR at 251.41589934.
The stock's current pattern is "Long Lower Shadow." The pivot Fibonacci P is 248.03, and the pivot Camarilla R1 is 260.89016667. The pivot Camarilla P is 248.03, and the pivot Camarilla R3 is 268.4105. The pivot Camarilla S2 is 249.60966667, and the pivot Camarilla S3 is 245.8495. The pivot Fibonacci R1 is 263.69964.
What is Long Lower Shadow?
A Long Lower Shadow is a candlestick pattern that indicates a potential reversal in the current trend. It occurs when the price opens at a certain level, then drops significantly during the trading session, but eventually recovers and closes near the opening price. This creates a long lower shadow below the real body of the candlestick .
Traders may interpret a Long Lower Shadow as a sign of bullishness, as it suggests that the bears (sellers) tried to push the price down, but the bulls (buyers) were able to drive it back up. However, it's important to consider other technical indicators and market factors before making any trading decisions based on a single candlestick pattern.

The End of an Era: Is Google's Reign Over?I believe that right now is an incredible time to short googles stock, The challenges facing it over the next few years could topple its position as an industry leader.
Current price: 105.35
Target 1: 90.55 (-14%)
Target 2: 74.50 (-29%)
The regulatory scrutiny that Google is facing is a significant threat to the company's future. If the company is found guilty of antitrust violations, it could face substantial fines and restrictions on its business practices, which could lead to a loss of market share and revenue. Moreover, the negative publicity generated by these investigations could harm Google's brand image and reputation.
In addition to regulatory scrutiny, Google is also facing increased competition from Microsoft's backed venture OpenAI. OpenAI is a major player in the artificial intelligence (AI) space, and is rapidly expanding its capabilities in natural language processing, computer vision, and other areas. As Google relies heavily on AI for many of its products and services, such as search and Google Assistant, increased competition in this area could pose a significant threat to the company's market position.
These challenges have already had an impact on Google's stock price, which has fallen from its all-time high of $150.70 in November 2021 to its current level of $105.30. This decline is likely due in part to concerns about regulatory scrutiny and competition from OpenAI.
Looking ahead, it is difficult to predict with certainty what the future holds for Google. However, it is clear that the company will need to address the regulatory concerns and navigate the increasingly competitive landscape if it hopes to maintain its market position and continue to grow. If it can successfully address these challenges and continue to innovate and adapt, Google could emerge from this period of uncertainty even stronger than before. However, if it fails to do so, its stock price could continue to decline, and its market position could be threatened.

Microsoft Potential Retest of BreakoutMicrosoft has been ripping lately, but as you can see price is way outside the upper bollinger band, wouldn’t be surprised to see a retest of the breakout next week.
Not financial advice.

MSFT MSFT Technical Analysis:
Three possible targets are specified based on the harmonic pattern. Save fifty percent on the first target, 30% on the second target, and 20% on the third target.
Good luck.
Karim Heydari

Microsoft: Challenges and Opportunities for InvestorsMicrosoft's business appears to be slowing down, with the company's stock declining since the beginning of 2022 due to sales growth reaching its limit. Furthermore, large parts of the company's business, including the PC and video game segments, are shrinking, and the outlook for corporate technology spending in 2023 isn't looking good.
Despite these major problems, Microsoft has several aspects that are not as well known and point to solid returns for investors in the long run. For example, the company has a rich portfolio that covers attractive sectors such as cybersecurity, video games, and cloud services, offering more diversified participation in technology growth trends than many other peers.
Although some of these niches may go through periods of decline, Microsoft provides investors with exposure to attractive industries that offer solid returns in the long run. Additionally, Microsoft's stable cash flow is another strength that sets it apart from many of its peers. The company generated $20.4 billion in operating income in Q2 of fiscal 2023, just 8 percent less than the previous year, and its operating cash is still strong at $11.2 billion.
Despite the challenges facing most tech giants in 2023, Microsoft has several strengths that could help it weather the storm. For example, the company pays a dividend that was recently raised by 10 percent, has plenty of cash, and does not need to rely on costly debt to finance its business. Additionally, Microsoft's global sales presence should smooth out the volatility from the downturn in demand in some markets and niches.
In conclusion, although Microsoft's stock may not be recession-proof, the company's strengths provide it with the flexibility to continue investing in high-yield projects such as artificial intelligence and virtual reality, ensuring that long-term growth prospects are not jeopardized by a few weak quarters.

QQQ/Nasdaq Breakout?Are we about to witness a technical breakout in the QQQ?
Yields have softened, Disocunt window opened, heading into options X...lots of catalyst to rip higher.
However Tech is overbought and into technical resistance.

AAPL/MFST Key Resistance for $QQQ. XLF Houly Bullflag, 25BPS- 7.5% move on QQQ/NASDAQ in 4 days. AAPL and MSFT now hitting key resistance, will be watching to see if it can break above or not for QQQ to continue.
- likely a slight pullback hourly consolidation for QQQ before attempting another leg up.
- after ECB hiked 0.5% this morning our rate hike of 25Bps increased to 80% chance this morning.
- XLF hourly bullflag still possible need to see bulls show up and hold above 0.382 fib
- as long as hourly trend is intact for the bulls on QQQ / SPY / SPX there is no red flag at all for the bulls.

$NDX looks good, better than $DJIRecently we made a post on how $NDX would outperform $DJI being it lacked #banks & #oil & it has done this.
As we have stated for some time, we're still CAUTIOUS BULL on the #stockmarket. Even after this latest fiasco.
CAUTIOUS is the key word.
Daily $NDX broke channel to upside AND longer term downtrend!!!!!!!!!!!!!!!!!!!!
Weekly chart shows #NDX holding above the weekly moving avg's & there was a bullish moving avg crossover, yellow circle, & has held.
12900 is an important level for #NASDAQ 100. Breaks that 13700 is next target.
$DJI looks okay. It held well until recently. It is close to forming a bearish crossover but we'll see. IMO likely not. While #DJI is much weaker as a whole cherry picking individual #stocks on the index should be okay. We stated $MSFT $AAPL have done well & newbie $AMGN & $VZ for yield.
#msft #aapl #amgn #VZ

$MSFT: Buy the dip to join the trend#Microsoft has a very interesting weekly uptrend signal active here, while the daily has just had a correction that ran its course. This gives us an interesting reward to risk entry to join the weekly trend at a more favorable reward to risk spot.
It's interesting how $GOOGL's monopoly in search being disrupted might affect things going forward also. On one hand, $MSFT has a chance at gaining ground in advertising and $GOOGL a chance to take a huge hit to their search margins if forced to integrate LLMs into it due to pressure from $MSFT (it was a big number, +30% hit). This might kick start some soul searching in $GOOGL, since they had been quite complacent and developed a ton of fluff thanks to their dominant position in search favoring it, a lot of excess they needed to shake off (head count, ridiculous woke practices and divisions burning $ for no reason like Waymo or miraculous anti aging methods to name a few, lots and lots of fat to shed).
$MSFT has done a better job in that regard, and are well positioned thanks to their subscription service model producing recurrent revenues and cash generation. Of the two, $MSFT is better run, by a lot...
Technically, $GOOGL is below weekly support while $MSFT is in a weekly uptrend and erased a recent monthly decline.
All things considered from a long term perspective I would be inclined to invest in $MSFT long term here, rather than $GOOGL, and the entry point here seems to be low risk vs potential reward, even in the short and mid term. It's certainly worth considering.
Best of luck if you do follow this buy signal.
Cheers,
Ivan Labrie.

NVDA Microsoft and OpenAI's ChatGPT 4 RevolutionNVIDIA Corporation (NVDA) is a semiconductor company that designs and manufactures graphics processing units, as well as other specialized processors for a wide range of applications such as gaming, professional visualization, data centers, and autonomous vehicles.
As of the current market data, NVDA is priced at $240.82 with a 1.02% increase in the last trading session. The 1-month high and low for the stock were $244.54 and $204.21, respectively. The Relative Strength Index (RSI) for NVDA is at 58.90, indicating a neutral market sentiment for the stock.
NVDA has been showing strong bullish momentum, as evidenced by its Average Directional Index (ADX) of 16.02. Additionally, the Moving Averages Rating for NVDA is Strong Buy, indicating that the stock is trading above its short-term and long-term moving averages.
However, the Awesome Oscillator for NVDA is at 5.08, indicating a weak bullish momentum. The MACD Level (12,26) is positive at 2.95, but the MACD Signal (12,26) is at 3.01, indicating a bearish trend reversal in the short term. The Commodity Channel Index (CCI) is currently at 85.94, suggesting that the stock may be overbought.
The company's financials also look strong, with a YTD performance of 4.28%. The Exponential Moving Averages (EMA) for NVDA are also positive, with the 20-day EMA at 234.73, 50-day EMA at 225.89, and 200-day EMA at 191.54.
Overall, NVDA appears to be in a bullish trend, with strong financials and technical indicators. However, investors should be cautious of a possible bearish trend reversal in the short term. Microsoft new partner OpenAI will make Microsoft better than Google. Will see

💥 MICROSOFT MSFT 4H-TIMEFRAME ANALYSIS💥 MICROSOFT MSFT 4H-TIMEFRAME ANALYSIS
💗Hello ladies and gentlemen
This is my new idea for 💥MSFT
I hope my idea is clear
Support me by like and share thank you
Stay Safe💯💲💲💲
Good luck💰😍

ChatGPT4 makes $MSFT rise againOn the daily chart, Microsoft is showing a double bottom and the lows are rising.
The 1-hour level broke out of the central zone, and the short-term take profit target is set at the previous high near 267

Getting close to another support level on $DJI, SCALPING onlyAs stated many times, in & out. Get as much as you can and then WAIT, be PATIENT IF you want to hold longer. It could be a while before we get another good longer term buy opportunity.
As stated before, SCALPING quick moves.
Most of these were not huge moves BUT Put premiums did lessen & provided 10-25% in minutes.
$MSFT went from 249 - 252
$ZS 106 - 108.5
$TSLA 170 -177
$COIN 53-55.2
$RUN 21.9 - 22.95
Picked up some gold miners $BTG $KGC Possible consolidation in the industry.

𝗧𝗲𝘀𝗹𝗮 𝗨𝗽𝗱𝗮𝘁𝗲: $TSLA Daily. 180 Support Lost5 waves down all the way to ~100 to end 2022. Huge bounce all the way to 200dma and key resistance area that has rejected. 180 support failing ... looks like we'll move towards the gap fill at 145
Through the first 2 months of 2023, retail investors have bought ~$10B worth of Telsa, more than any other stock/ETF (compared to ~$4B of $SPY). What could go wrong? 🤓
$QQQ $NQ_F $NDX $AAPL $MSFT $GOOG $AMZN $SOX $ES_F $SPX $TLT $TNX $VIX #Stocks 📉

$DJI dip bought yesterday paying off, $NDX #stocks BOUNCINGYesterday pointed out that we were using cash on that dip
We had sold decent amount couple days before from the longs of last week.
Bought (Sold puts) $MSFT $UDOW $TQQQ $RUN $ZS and others
With rates increasing & #FED staying hawkish how are we not going lower?
Maybe not here but we've stated before MANY times that #markets don't work, especially now, the way most think.
It's psychology & BIG MONEY moves how they see it.
$DJI can very well stay RANGEBOUND for a bit. Stayed this way for 2 weeks in December.
The indices are "easier" to track so find your fav company and use indices to trade around it.
