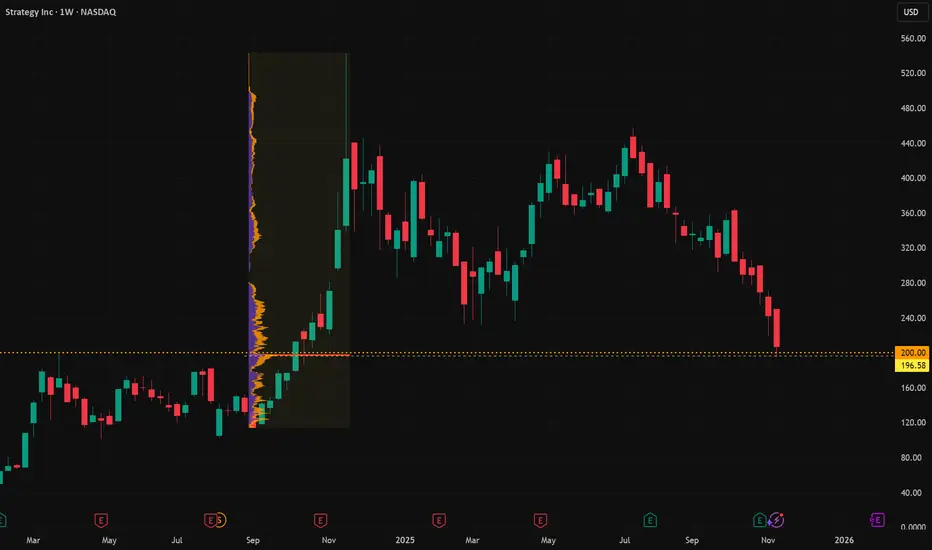
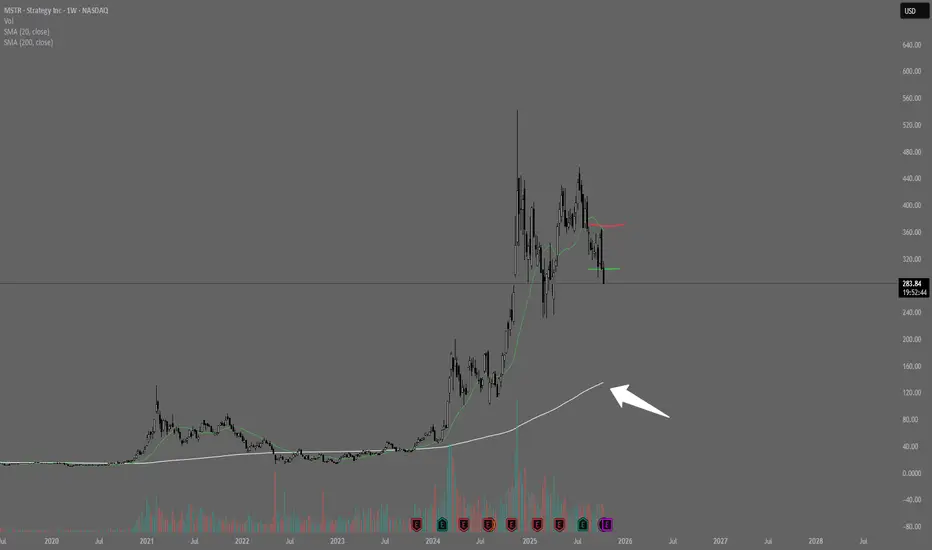
MSTR to $676MSTR is on major support, looking to run to $676 once bitcoin lifts (currently just below it's long term trend buy area).
Good luck!
MSTR

Full Reset before Full SendWhy March 2025 Could See New Highs
What's Happening Right Now?
Everyone is freaking out right now, but this is actually creating one of the best buying opportunities we've seen. Bitcoin is trading around $95,600 after dropping about 24% from its peak of $126,000 in October.
The Fear & Greed Index is at 10 (Extreme Fear) – and you know what they say? Be greedy when others are fearful. But, also, be patient and set limits.
The thing is, most people don't understand the economics behind Bitcoin or how liquidity actually works in crypto markets. We're playing a completely different game than stocks here.
The Real Cost to Mine Bitcoin (And Why It Matters)
Here's where it gets interesting. The big mining operations are producing Bitcoin for around $26,000-$28,000 per coin, while less efficient miners saw costs spike to $114,842 in October 2025... That's a massive range, and it tells you everything about where the floor is.
After the April 2024 halving, it now takes 854,400 kilowatt-hours to mine just one Bitcoin – that's about 81 years of electricity for an average home, just for one coin. That's a fun fact.
No smart miner is going to sell at a loss when they're paying that much for electricity and equipment (GPUs, etc). They'll just hold and wait. This creates natural supply constraints.
The Liquidity Trap
Right now, the market is in what I call a liquidity trap. As Bitcoin crashed from $126K down to where we are now, all the leveraged traders got wiped out. We saw $870 million in Bitcoin ETF outflows in a single day – that's both panic selling and intelligent, planned shorting, not fundamental weakness.
Here's what most people are missing: if Bitcoin drops to around $75K, it's going to unlock massive amounts of liquidity – I'm talking hundreds of millions, possibly billions of dollars that's currently locked up in long positions (Futures).
When those long get liquidated, the shorts will likely reverse their positions, that money floods back into the market and creates a supply shock. Basic economics: limited supply + sudden demand increase = price explosion.
Price Targets & When to Buy
I think we'll see $89K very soon – possibly this week between Monday and Wednesday (November 17-19, 2025). But here's my recommended strategy instead of trying to catch the exact bottom:
First Buy: $89K
Put in about 30% of what you're planning to invest. This is still a good entry even though it's not the absolute bottom.
Second Buy: $80K
Another 35% here. This is where things get really interesting from a risk/reward perspective.
Third Buy: $75K
The final 35%. This is the sweet spot where all that trapped liquidity gets released. Remember, demand increases as the price drops, and miners won't sell below cost. That's your supply shock waiting to happen.
What About MicroStrategy?
MSTR has crashed about 40% and is now trading at only 1.06 times its Bitcoin holdings, down from 2.7 times. The stock is around $200-$237 now, way down from its November 2024 high of $543.
My prediction: MSTR will probably hit the $140-$150 range, maybe even drop to $100-$120 (which is where it found strong support from March to September 2024). If we do see those lower prices, I'm going all-in on
MSTX
shares, not
MSTR
– the 2x leverage structure is better.
The Macro Picture
Fed rate cut expectations dropped from 90% to about 40%, which is why everything's selling off. But this is temporary sentiment, not permanent damage. The infrastructure is still being built, institutions are still coming in, and the fundamentals haven't changed.
Bottom Line
Be patient. Wait for the dips. Bitcoin will likely hit $89K this week, and from there we could see further drops to $80K and $75K. Each level is a buying opportunity. By March 2025, I expect we'll be making new all-time highs.
The key is understanding that crypto operates on different rules than stocks. Liquidity and supply dynamics matter more than anything else right now.
Good luck,
Terrapins

MSTR – Approaching Major Support as Downtrend ContinuesMicroStrategy remains in a clear higher-timeframe downtrend, and if Bitcoin continues to weaken, NASDAQ:MSTR could slide further toward the next major support level — now sitting roughly 63% below its all-time high. This zone may act as a potential reversal area, especially if market sentiment stabilizes.
Trade Setup:
• Entry Zone: $170 – $180
• Take Profit Targets:
🥇 $280
🥈 $360
• Stop Loss: $122

Crypto & Bitcoin Do or Die!In this video we show you the mother of all trendlines on BTC and why we think it will likely catch a dead cat bounce.
The total crypto market cap is at an inflection point. If this level doesn't hold we have a failed weekly bullish pattern.
A failed bullish pattern of results in extreme downside pressure.
BTC is retracing to a key 618 Fib level from your tariff low selloff so there is some support here.
Its also hitting a monthly chart trendline going back several years.
I like crypto for a long here on a risk to reward basis. If we lose this area keep in mind our next major support is $85k which is another 10K lower.

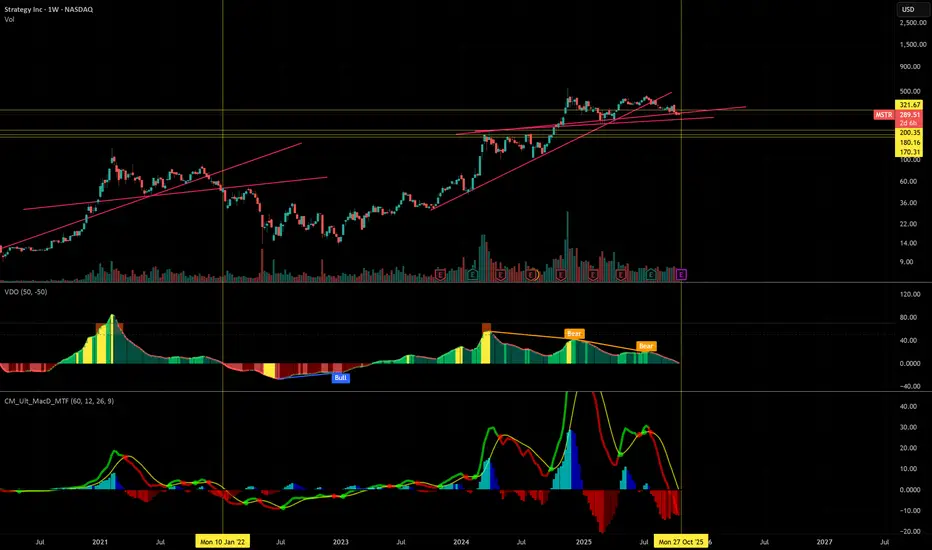
MSTR Short Closed: Michael Burry vibesI started my NASDAQ:MSTR short last November during the retail yeet. I really took a dislike to Saylor telling people to mortgage all they could to buy Bitcoin and then later to buy stock in his company. The history of finance is littered with con men saying and doing such things. History doesn't repeat but it rhymes.
Now the stock sits on a key Support; the March 2024 high and the prime Volume Profile level of the run up. Its time to unwind the position in profit and see what happens next.
MSTR hitting a Support coincides with CRYPTO:BTCUSD also hitting a major Volume Profile Support. The Weekly Ichimoku chart remains bullish. A recovery pullback up could happen from here.
Over the last year I've had to go through the cycle of being "right" and being "wrong" all the while being public in my position among Bitcoin Maxi friends. They enjoyed poking fun at me the whole way. Their arrogance and jabs did not change my mind, rather they gave me some confidence that I was properly contrarian. Hubris never pays off in investing. Every great trade I have made has begun (and lasted) in deep uncertainty. That is what it means to take risk.
I still believe that the narrative of MSTR has yet to completely dissolve among the faithful but I have a habit of always taking profit "too early."
Trade wisely. Stay convicted.
Strategy: Downward Pressure Intensifies Strategy has continued to develop downward pressure as anticipated since our last update, bringing it closer to the targeted low of the turquoise wave 2. Our alternative—and now grayed-out—Target Zone has been breached to the downside, allowing us to remove the alternative scenario of a premature breakout to the upside. Investors who speculated on this alternative and entered within the alternative Target Zone with a stop 1% below the lower edge have likely been stopped out by now. For now, we are still allowing some room for turquoise wave 2 to move lower; however, it should find its bottom above the support at $102.40 to set the stage for wave 3 to advance further above the resistance at $674.18.

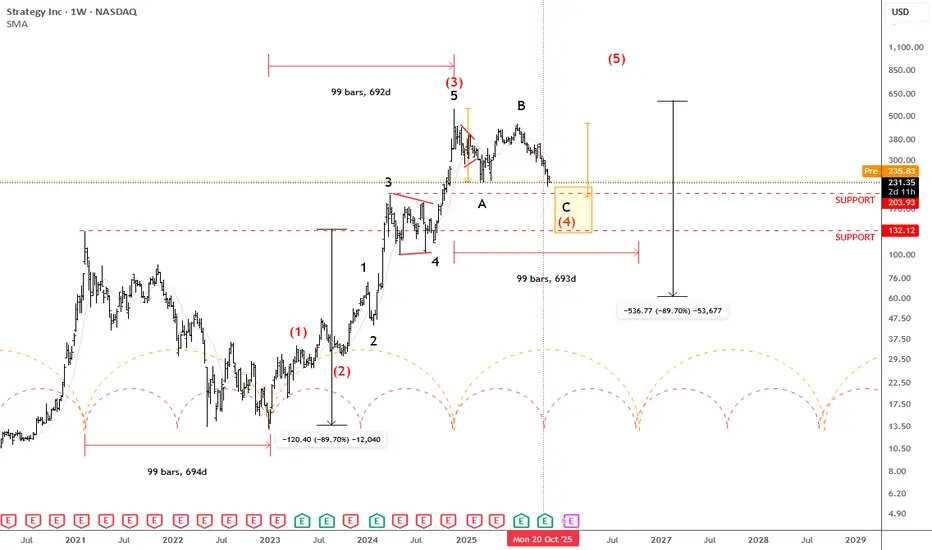
MSTR Trading Close To Support Based on Elliott wave and CyclesMicroStrategy has seen a strong uptrend since the December 2022 lows, but over the last year the market has been in a retracement phase. It appears that this could be another A-B-C setback within a higher-degree wave four, where subwave C could potentially retest the 200 area, or even extend toward the deeper 132 support. That level also aligns with the February 2021 high, making it an important zone to watch.
Cycle-wise, it looks like we’re currently in the middle of a full cycle, suggesting that the correction could be moving into second half of this retracement, and may come to an end within the next few months. Ideally, we could then see a new turn higher in 2026, continuing the broader bullish trend.
Highlights:
Trend: Corrective pullback in wave four
Support: 200 / 132
Cycle View: Mid-cylce; possible new rebound early 2026
Note: Structure fits within a broader five-wave bullish sequence, with strong long-term trend intact
GH
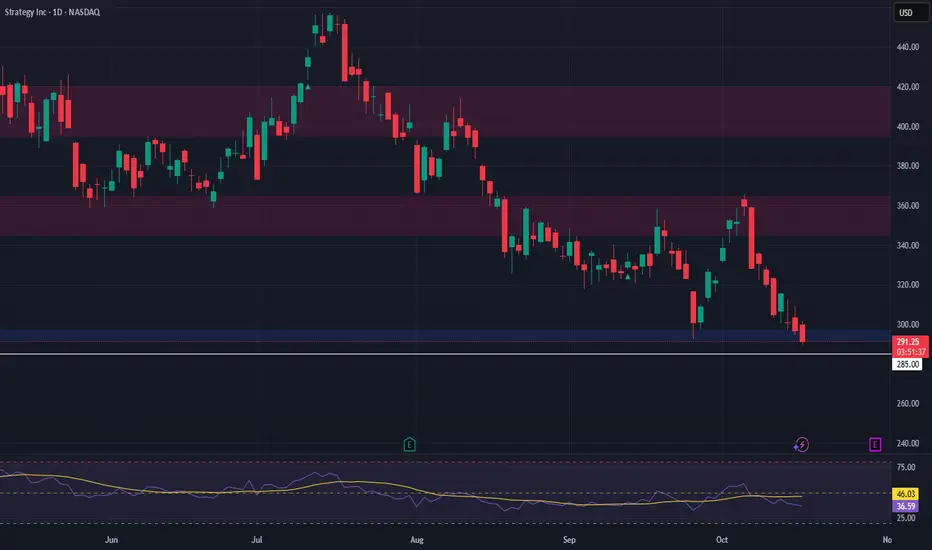
$MSTR bounce above $300 before falling further?Ever since Early October, MSTR has been falling. We've now reached the bottom of a flag structure and I'd expect a bounce here before we fall further.
I think the most likely path from here is that we see a rally into the $300 zone, however, it's possible that we can go up to the top of the flag before falling further.
That said, if we get a rally, it'll be a rally you want to sell because eventually I think we're heading down to the $100 level before you want to become a long term buyer.
I've marked off key resistances on the path up to take profits on a long, should the rally play out from here.

MSTR HIGH PROBABILITY BIG BULL MOVE SOON!!!🚨 MSTR HIGH PROBABILITY BUY SETUP 🚨
* Here We Can See Clearly The Next Potential Moves For MSTR Coming Hours/Days.
* Keep Your Eyes Close On Your Trading Positions.
* Happy PIP Hunting Traders.
FXKILLA.

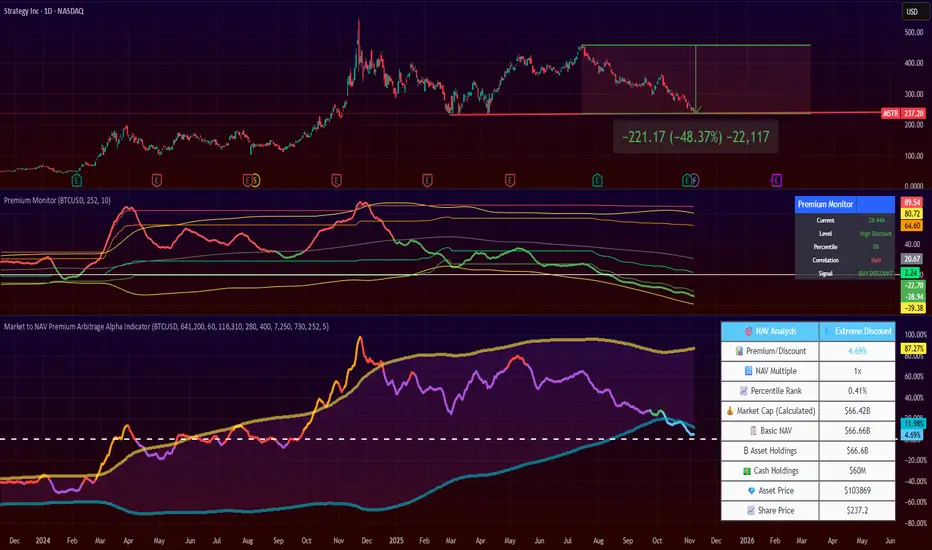
Strategy's Premium is Gone. Time to Load? 4 months ago, I posted that NASDAQ:MSTR premium was unsustainable and the stock price would drop.
Since then, the price dropped by 50%!!
Now, Strategy's is close to zero, and I flip my views on it.
If you like this kind of trade, it might be a good time to start DCA'ing it.
Note that Strategy continues to be a highly volatile stock, more volatile than Bitcoin itself.
Finally, the stock is now at a technical resistance level.
You can keep an eye on the premium/discount of this stock by looking at my 2 indicators:
Market to NAV Premium Arbitrage Alpha Indicator , and
Asset Premium/Discount Monitor
MSTR further downside but looking exhaustedNASDAQ:MSTR Price continues range bound in a complex wave 4 correction, notoriously hard to analyse. The trend is down but looks exhausted.
Wave Y can complete any time in this flat correction pattern but is approaching the previous swing low and the 0.236 Fibonnacci retracement.
Daily RSI has printed bullish divergence but price continues lower. IF pice breaks down further the next target is $185 where price may find a bottom.
Recovering the daily 200EMA is the first goal.

Will Microstrategy $MSTR follow the 2021 cycle?
Top was around the most greedy time in the market per Election '24. As bitcoin put in new all time highs MSTR continued lower highs, just like in '21. Last line of support around $230, it should continue putting in lower highs as the cycle comes to an end.
MSTR - How to profit from a $140 short target🔱 The MS ponzi is taking its toll. 🔱
I’m not laughing, because it’s genuinely unfortunate for everyone who believed in this scam.
But today, I don’t want to rant about that.
I want to show how one could profit from a potential drop of more than $100.
As an Andrews Pitchfork trader, I know there’s roughly an 80% chance that price will reach the centerline. From there, price either reverses in the opposite direction or breaks through the centerline to continue its journey.
That’s exactly what happened with MSTR.
You can see how the price first reached the centerline, held there a few times, and then broke it. Since then, it’s been following the rulebook by moving further to the downside.
Now, there’s another rule worth remembering:
price often tests or retests the line it just broke.
In our case, that line is the centerline.
This means we could be lucky enough to get a pullback to the centerline, and that would be a good level to consider shorting.
The target is usually the opposite line of the centerline, which in our case is the L-MLH (Lower Median Line Parallel).
👉 If you want to learn the full framework and its rules, check the links for free material.
I hope this helps many of you, and I wish you all good profits.

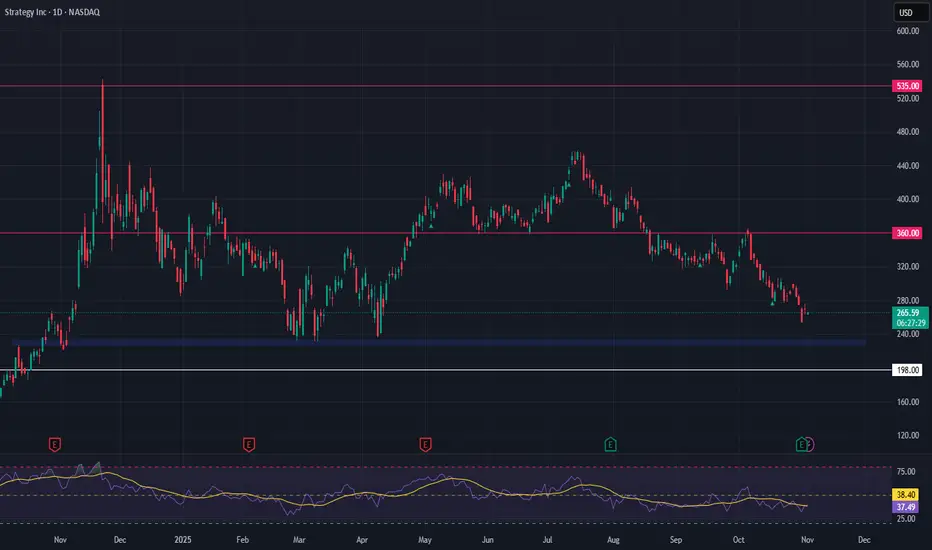
Strategy Inc (MSTR) – High-Beta Bitcoin Proxy at Key SupportStrategy Inc NASDAQ:MSTR has delivered another strong quarterly report, underscoring its continued commitment to aggressive Bitcoin accumulation. With over 158,000 BTC on the books, MSTR has firmly positioned itself as a leveraged proxy for Bitcoin, offering equity traders indirect crypto exposure. This bold balance sheet strategy has also pushed MSTR into alignment with S&P 500 inclusion criteria — a potential catalyst if index inclusion materializes.
Technically, the stock is now retesting a key support zone between $228 and $233. This level has historically held well and may offer a high-conviction entry for those anticipating a BTC rebound. Should Bitcoin aim for new highs, MSTR could respond with outsized upside, though traders must account for the volatility and downside risks that come with crypto-correlated equities.
🎯 Trade Setup:
Entry Zone: $228 – $233
Take Profit Targets: $360 and $535
Stop Loss: $198
This setup offers a high-risk, high-reward opportunity. As always, manage position size carefully and watch BTC price action for confirmation.
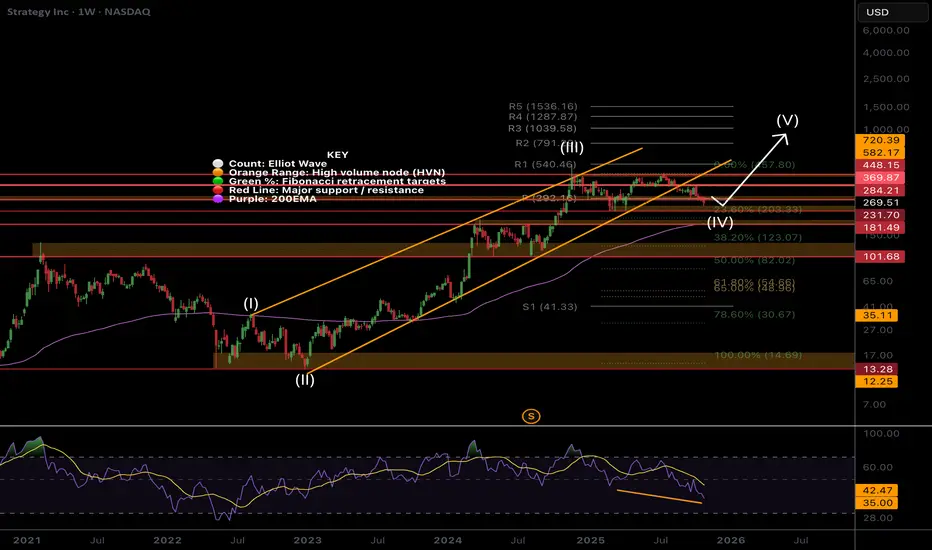
MSTR weekly bull divergence on low sentimentSentiment is low, the asset is hated and misunderstood by TradFi and retail. It’s a recipe for a bottom!
Price is still in a wave (IV) which are expected to be long and drawn out, driving investors into shallow capitulation through boredom into patient hands. I don’t expect wave (V) to kick in until Bitcoin moves. Wave (V) has an expected target of the R3 daily pivot at $1039 but will overextend if Bitcoin does.
Price has fallen out of the lower channel boundary and sitting below the weekly pivot, still above the weekly 200EMA so the outlook is bullish. Wave (4) may complete at the 0.236 Fibonacci retracement at $230. For now I am waiting to see what happens before entering. Good opportunities are setting up.
🎯 Terminal target for the business cycle could see prices as high as $1000 based on Fibonacci extensions
📈 Weekly RSI has bullish divergence
👉 Analysis is invalidated if we close back below $82
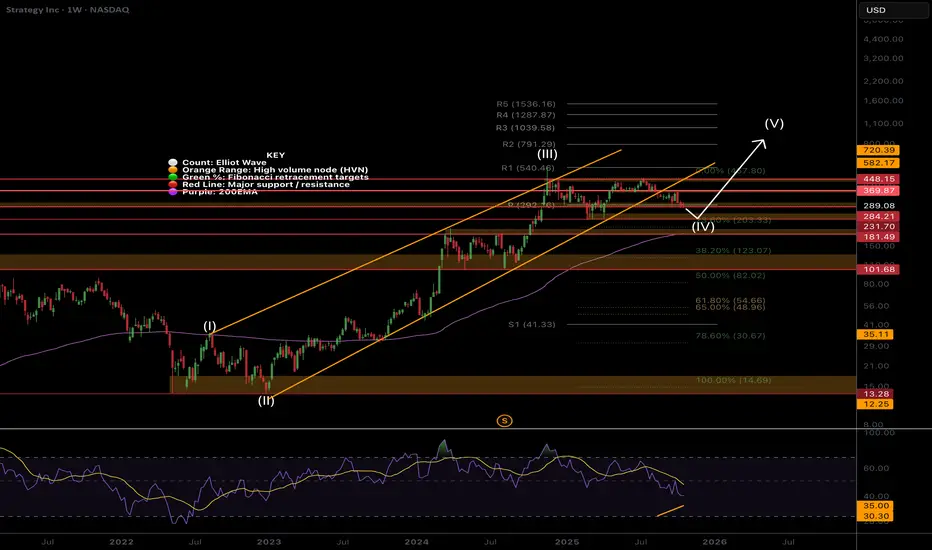
MSTR still in wave 4 rangeNASDAQ:MSTR Price is still in a wave (IV) which are expected to be long and drawn out, yet shallow which is what we have here. I don’t expect wave (V) to kick in until Bitcoin moves. Wave (V) has an expected of the R3 daily pivot at $1039 but will overextend if Bitcoin does.
Price has fallen out of the lower channel boundary and sitting at the weekly pivot, still above the weekly 200EMA so the outlook us bullish. wave (4) may complete at the 0.236 Fibonacci retracement at $203. For now I am waiting to see what happens before entering but believe good opportunities are setting up.
Safe trading
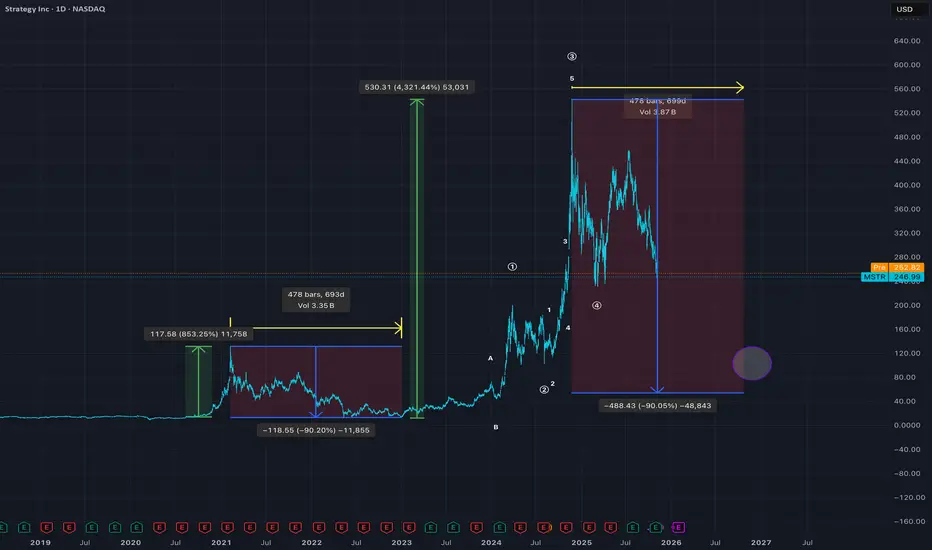
If this looks bullish.. you got another thing coming History doesn't repeat itself, but it often rhymes. So far 1:1.
I reckon the next 356 days will test out Saylors holders
Has Crypto Bottomed? Cycle AnalysisBTC has swept some key areas and looking to form a bottom. Back testing a key break out area.
We technically pierced the daily 200 MA a few days ago but never confirmed below the key area.
The near term chart looks like we should maintain a positive bounce back to 111,500.
We need to be mindful that the last failed double top breakout that occurred in dec 2024 / Jan 2025 - we saw a 30% decline from peak to trough.
As long as the crypto market cap remains above the weekly chart neckline - a bull upside target can be calculated.
We nibbles on some MSTR shares on Friday.
These crypto positions need to be monitored closely.

MSTR Hidden Leverage: What Happens When the Cycle Turns?When a company builds its balance sheet around Bitcoin, it becomes more than a software firm — it turns into a leveraged bet on BTC itself.
That’s exactly what MicroStrategy (MSTR) has done. And while this strategy paid off massively during Bitcoin’s uptrend, the same dynamic could become a serious liability when the cycle shifts.
1. The Amplified Correlation
MicroStrategy’s market cap is now deeply tied to the value of its Bitcoin holdings.
As BTC rallies, MSTR tends to outperform — sometimes doubling the percentage moves of Bitcoin itself.
But this also means that during downtrends, the drawdowns can be brutal.
In previous cycles, MSTR lost more than 80% of its value as BTC corrected.
2. The Nature of Hidden Leverage
Unlike traditional leverage through debt or derivatives, MSTR’s “leverage” comes from balance-sheet exposure.
The company has repeatedly issued convertible debt and used the proceeds to buy more Bitcoin.
In other words, the stock is effectively a leveraged vehicle on BTC — but with all the operational and financing risks of a public company layered on top.
3. When Sentiment Shifts
During bull markets, investors pile into MSTR as a regulated way to gain exposure to Bitcoin.
But when risk appetite fades, the same crowd exits just as fast.
That double pressure — falling BTC and capital rotation out of crypto — can trigger violent selloffs.
MSTR’s liquidity amplifies this volatility even further.
4. The Structural Risk
At current levels, MSTR’s valuation is heavily dependent on BTC maintaining or expanding its price range.
If Bitcoin consolidates or enters a deeper correction, the company’s debt-fueled exposure could start to weigh heavily.
This is where the “hidden leverage” shows its downside.
Leverage without leverage only works… until the market reminds you that it’s still leverage.
MSTR- Double Bottom Forming at Key Support–Bullish Setup in PlayPrice is once again testing a major support zone ($292–$297), where it is also forming a double bottom pattern — a strong technical reversal signal. This confluence of structure and pattern typically suggests that bulls may soon regain control, setting the stage for a potential move higher.
💡 Trade Idea: Long Spot Entry
Entry Zone: $292–$297
Take Profit Levels:
TP1: $345–$365
TP2: $395–$420
Stop Loss: Just below $285
MSTR: Trend ContinuesSince our last update, MSTR extended its sell-off. We still expect the low of this wave to form above the support level at $153.49. Once wave 2 is complete, we anticipate a strong wave 3 rally pushing above resistance at $674.18. Our alternative scenario assumes a different wave count: in this case, price may currently be developing the magenta wave alt. to the upside (probability: 30%). This count would be confirmed by a direct move above resistance at $430.50.

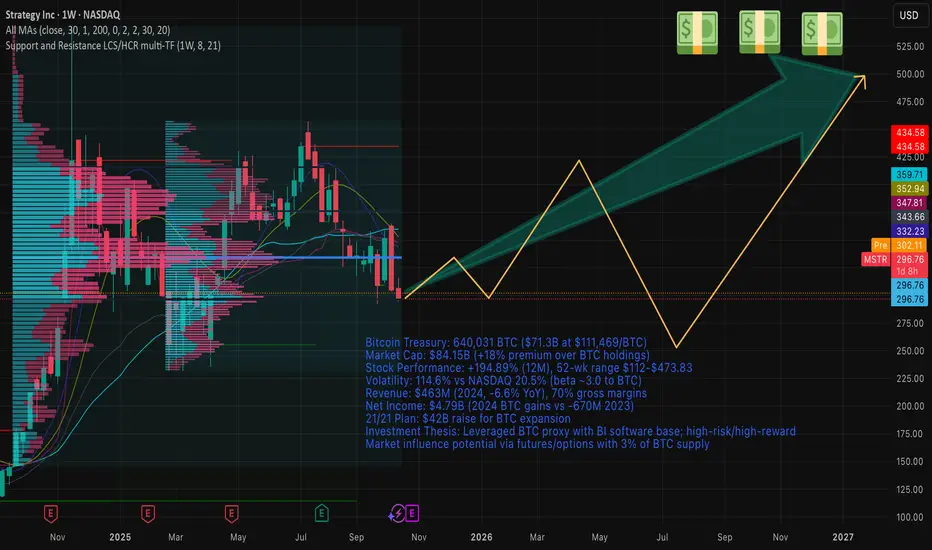
Strategy Inc. (NASDAQ: MSTR) - Financial ReportDate: October 16, 2025
Current Market Context:
As of October 16, 2025, Bitcoin trades at approximately $111,469 USD, reflecting a volatile yet upward trajectory influenced by institutional adoption and macroeconomic factors.
Strategy Inc., formerly MicroStrategy, holds 640,031 BTC, valued at $71.3 billion USD as of today.
The company's market capitalization stands at $84.15 billion USD, representing an 18% premium over its Bitcoin reserve value.
This premium accounts for operational assets, including fixed costs, employee salaries, and intellectual property, while underscoring the market's perception of MSTR as a leveraged Bitcoin proxy.
Notably, the company's substantial BTC holdings enable potential market influence through strategies involving futures and options, allowing for amplified exposure to cryptocurrency volatility.
1. Company Overview
Strategy Inc. (MSTR) is a leading provider of AI-powered enterprise analytics software and services, operating in the business intelligence (BI) and software sector. Founded in 1989 by Michael J. Saylor and Sanju Bansal in Wilmington, Delaware, the company initially focused on data mining and BI tools inspired by systems-dynamics theory from their MIT studies.
It secured its first major client, McDonald's, with a $10 million contract in 1992, driving 100% annual revenue growth from 1990 to 1996. By 1994, the firm relocated to Tysons Corner, Virginia, expanding to 50 employees.
The company went public in 1998 and evolved into a pioneer in BI platforms, offering products like MicroStrategy ONE for non-technical insights and HyperIntelligence for contextual overlays. In August 2020, under Saylor's leadership, Strategy adopted Bitcoin as its primary treasury reserve asset, purchasing 21,454 BTC for $250 million—a move that transformed it into the world's largest corporate Bitcoin holder.
This pivot positioned MSTR as a "Bitcoin spot leveraged ETF" proxy, blending software revenue with cryptocurrency exposure.
In February 2025, it rebranded from MicroStrategy to Strategy Inc. to emphasize its dual focus on analytics and Bitcoin innovation. Today, it serves industries including finance, healthcare, retail, and government, with a global presence across North America, EMEA, LATAM, and APAC.
Strategic Objectives and Corporate Vision
Strategy's vision is to empower organizations with AI-driven analytics while leveraging Bitcoin as a superior store of value against inflation and currency devaluation. Core objectives include:
- Expanding market share in BI through innovative technologies like cloud-native platforms and partnerships.
- Executing the "21/21 Plan": Raising $21 billion in equity and $21 billion in fixed-income instruments over three years to acquire more BTC, enhancing treasury value.
- Balancing software growth (e.g., via Strategy Mosaic for data governance) with Bitcoin strategy for long-term value creation.
Saylor, the Executive Chairman, focuses on Bitcoin acquisitions, while CEO Phong Le oversees operations. The company holds 340 patents, emphasizing innovation in BI and blockchain applications.
2. Financial Analysis
Consolidated Balance Sheet: Last Three Years
Strategy's financials reflect modest BI revenue growth overshadowed by Bitcoin impairments and gains. Data is in USD millions, sourced from annual reports.
| Metric | 2024 | 2023 | 2022 |
|--------------------|---------|---------|---------|
| Total Revenue | 463.0 | 496.0 | 496.0 |
| Cost of Revenue | 138.9 | 148.0 | 152.0 |
| Gross Profit | 324.1 | 348.0 | 344.0 |
| Operating Expenses | -6,660 | 450.0 | 500.0 |
| Operating Income | 6,660 | -102.0 | -156.0 |
| Net Income | 4,790 | -670.8 | -1,470 |
| Gross Margin (%) | 70.1 | 70.2 | 69.4 |
| Net Margin (%) | 1,036.6 | -135.3 | -296.4 |
Volatility stems from Bitcoin fair-value adjustments: 2024 gains drove net income surge, while prior years saw impairments. Revenue declined 6.6% YoY in 2024 due to subscription shifts, but gross margins remain robust at ~70%.
Cash Flow Analysis
Cash flows highlight Bitcoin-driven investing outflows, offset by financing inflows. Data in USD millions.
| Category | 2024 | 2023 | 2022 |
|-------------------------|-------- |---------|---------|
| Operating Cash Flow | 50.1 | 65.0 | 45.0 |
| Investing Cash Flow | -35,630 | -2,100 | -500.0 |
| Financing Cash Flow | 35,500 | 2,050 | 450.0 |
| Net Change in Cash | -80 | 15.0 | -5.0 |
| Free Cash Flow Growth (%) | -1,069 | N/A | N/A |
Operating cash flow remains positive but modest (~$50M in 2024), supporting software operations. Investing activities reflect massive BTC purchases ($35.6B in 2024 via debt/equity raises), while financing provides liquidity through convertible notes and ATM offerings. This structure amplifies BTC exposure but increases dilution risk.
Key Performance Indicators
Financial ratios reveal efficiency in equity utilization but asset strain from BTC leverage.
| Ratio | 2024 | 2023 | 2022 | Interpretation |
|--------------- --|----------|----------|--------|----------------|
| ROE (%) | 18.01 | -25.0 | -40.0 | Strong recovery via BTC gains; measures profitability per equity dollar. |
| ROA (%) | 12.75 | -5.0 | -8.0 | Improved asset efficiency; net income/total assets. |
| ROI (%) | 12.75 | -4.5 | -7.5 | Aligns with ROA; return on invested capital in BTC/software. |
| Debt/Equity | 0.16 | 0.25 | 0.30 | Low leverage; supports BTC strategy without excessive risk. |
| Interest Coverage | 5.2 | 1.5 | 0.8 | Adequate coverage post-2024 gains; EBIT/interest expense. |
ROE surged in 2024 due to unrealized BTC appreciation, calculated as Net Income / Average Shareholders' Equity. ROA = Net Income / Total Assets, highlighting BTC's role in boosting returns despite flat software assets.
Debt Analysis
Total debt stands at $8.21 billion (2024), primarily convertible notes for BTC buys. Debt/Equity ratio of 0.16 indicates conservative leverage, with current ratio at 0.68 signaling short-term liquidity pressure from BTC focus. Interest coverage improved to 5.2x in 2024, mitigating default risk amid rising rates. Strategies include ATM equity sales to repay debt.
3. Market Analysis
Stock Performance: Last 12 Months
MSTR delivered 43.55% returns over the past 12 months (October 2024–October 2025), far outpacing benchmarks. 52-week high: $473.83 (November 2024); low: $112.00 (October 2024). Current price: ~$296.76, with YTD loss of -1.12%.
Volatility and Benchmark Comparison
Annualized volatility: 114.6% (MSTR) vs. 20.5% (NASDAQ) and 15.2% (S&P 500), driven by BTC correlation (beta ~3.0 to BTC). MSTR outperformed S&P 500 (+71% vs. +16%) and NASDAQ over 12 months, but with 7x the volatility.
Sharpe ratio: 1.82 (MSTR) vs. 0.92 (S&P 500), indicating superior risk-adjusted returns.
Competitors and Market Position
In Business Intelligence software, Strategy holds ~1.19% market share, trailing Microsoft Power BI (19.85%) and Tableau (16.11%).
Key competitors: Tableau (Salesforce), Qlik, IBM Cognos, Oracle BI, and Power BI. Strengths include scalability and mobile BI; weaknesses are higher complexity vs. user-friendly rivals.
As a BTC holder, it leads corporates (e.g., vs. Tesla's ~11,000 BTC), positioning MSTR as a unique hybrid: BI challenger with crypto dominance (~3% of BTC supply).
4. Future Outlook
Growth Forecasts: 2025–2028
Analysts project 5–10% annual BI revenue growth to $550M by 2028, driven by AI integrations. BTC holdings could reach 1M+ via 21/21 Plan, implying 20–50% stock upside if BTC hits $150K (base case: $400–$600/share by 2028). EPS growth: 1557% in 2025, stabilizing at 15% CAGR. Overall revenue: $500M–$600M by 2028, with net income tied to BTC (projected $10B+ if holdings appreciate 30% annually).
Expansion Plans, Acquisitions, and Initiatives
- 21/21 Plan: $42B raise for BTC buys; recent $2B preferred stock offering targets Q1 2026.
- Acquisitions: Potential in blockchain/BI (e.g., mobile analytics firms); no major 2025 deals announced.
- Initiatives: Launch of Bitcoin-linked securities; expansion into APAC BI markets; AI enhancements like Strategy One for predictive analytics.
Potential Risks and Mitigation
- Risks: BTC volatility (80% drawdown potential); dilution from equity raises; regulatory scrutiny on crypto holdings; BI competition eroding 1–2% share annually.
- Mitigation: Diversified revenue (BTC as 90% value driver but software as stabilizer); debt refinancing via ATM sales; hedging via futures/options with its BTC hoard for market influence.
Scenario analysis: Base (BTC +20%/yr) yields 25% IRR; bear (BTC -30%) limits downside to 15% via operational cash.
5. Conclusion
Overall Assessment and Investment Potential
Strategy Inc. exemplifies a high-conviction, transformative play: a BI stalwart amplified by Bitcoin's asymmetric upside. With $84.15B market cap trading at an 18% premium to its $71.3B BTC holdings—factoring in ~$500M annual fixed costs, salaries for 1,530 employees, and BI IP—the firm offers leveraged exposure without direct crypto custody risks. Historical 1,620% returns since 2020 validate Saylor's vision, outperforming S&P 500 by 22x. Potential is strong for 2025–2028 if BTC adoption accelerates, with ROE/ROA signaling efficient capital deployment.
Investor Recommendations
Buy/Hold for Growth-Oriented Portfolios: Target $400–$500 by end-2026 (20–50% upside) on BTC momentum; allocate 5–10% for high-risk tolerance.
Strengths: BTC treasury (market influence via derivatives); resilient 70% margins; innovation (340 patents).
Weaknesses: Revenue stagnation (-3.2% CAGR); volatility (114% vs. 20% benchmarks); dilution risk (74% YTD BTC yield via shares).
Conservative investors: Monitor Q4 2025 earnings (Oct 30) for BTC yield updates; diversify with S&P 500 ETFs.
This is not financial advice—consult professionals.
$MSTR Swing Trade Setup: Layered Short Entries on Breakout📉 MSTR "STRATEGY INC" STOCK – Bearish Thief Plan (Swing/Scalp Setup)
⚡ Trade Setup (Bearish Pending Order Plan)
Asset: NASDAQ:MSTR (MicroStrategy Inc.)
Plan: Bearish (waiting for support breakout confirmation).
Entry Zone:
Pending breakout entry @ 320.00 ⚡
Layered “Thief” Strategy (scaling entries):
Sell Limit Layers: 340.00 / 330.00 / 320.00
You may add or adjust layers based on your own risk tolerance.
🔔 Set TradingView alerts at breakout levels to track price action.
Stop Loss (Thief Style):
Protective SL @ 360.00 (after breakout confirmation).
Adjust per your strategy & risk management.
Target Zone (Exit):
Police barricade support @ 290.00
Note: Take profit is discretionary — escape with profits at your own chosen level 🚪💰.
🔑 Why This Plan? (Thief Strategy Context)
The Thief Plan = using multiple layered limit entries after a breakout for better risk/reward.
Scaling entries gives flexibility while reducing FOMO and chasing.
Exit early at support barricades or oversold traps.
📊 MicroStrategy (MSTR) Market Data Report
As of September 7, 2025
1. Retail & Institutional Sentiment 🤝
Retail: Mixed / cautious (crypto exposure volatility).
Institutional: Neutral → slightly bearish (Bitcoin correlation + regulatory risk).
Estimated Sentiment: 55% Neutral / 30% Bearish / 15% Bullish.
2. Fear & Greed Index 😨😋
Current level: Neutral ~50/100
Suggests balanced emotions → no extreme greed or fear.
3. Fundamental & Macro Scores 📈📉
Fundamental ~60/100: MSTR tied to Bitcoin trends, highly volatile.
Macro ~55/100: Pressures include crypto regulation, tech volatility, interest rates.
Bitcoin remains the key driver.
4. Market Outlook 🐂🐻
Bull Case: BTC rally → MSTR boost, institutional adoption helps.
Bear Case: Regulatory clampdowns, BTC volatility → downside pressure.
Overall: Neutral → Slightly Bearish (short-term caution).
🚀 Key Takeaways
NASDAQ:MSTR moves in sync with Bitcoin → monitor BTC charts closely.
Sentiment is not strongly bullish → short setups have edge here.
Thief layering strategy aligns with volatility.
Always respect SL & manage risk 🔐.
🔗 Related Pairs to Watch
BITSTAMP:BTCUSD
NASDAQ:COIN (Coinbase)
NASDAQ:RIOT (Riot Platforms)
NASDAQ:MARA (Marathon Digital)
SP:SPX / NASDAQ:NDX (macro impact on tech/crypto plays)
✨ “If you find value in my analysis, a 👍 and 🚀 boost is much appreciated — it helps me share more setups with the community!”
#MSTR #MicroStrategy #Stocks #SwingTrade #Scalping #BearishSetup #CryptoStocks #LayeredStrategy #ThiefPlan #BitcoinCorrelation #TradingViewIdea
