STRATEGY The collapse continues..Strategy (MSTR) completely lost its 1W MA200 (orange trend-line) last week, making its losses at more than -80% from its November 2024 All Time High (ATH), continuing to outperform even Bitcoin in losses. Given that the Bear Cycle on stocks hasn't started yet, this can only get (much) worse, something we've been calling out for since last year.
The last two major market bottoms have both been made after (marginally) breaching the 1M MA200 (red trend-line) in 2022 and 2020. This was close to the Higher Lows trend-line that started on the November 2008 bottom of the U.S. Housing Crisis. The stocks recent Highs since 2021 of course represent its strategic shift to Bitcoin reserves.
In any case, this shows that as long as Bitcoin continues to fall (should do so up until September 2026 at least), Strategy should target its 1M MA200 again and based on its current trajectory has high probabilities of making contact at $50.00.
A highly likely Bear Cycle on the stock market however, has the potential to accelerate the correction inside the Higher Lows Zone even.
---
** Please LIKE 👍, FOLLOW ✅, SHARE 🙌 and COMMENT ✍ if you enjoy this idea! Also share your ideas and charts in the comments section below! This is best way to keep it relevant, support us, keep the content here free and allow the idea to reach as many people as possible. **
---
💸💸💸💸💸💸
👇 👇 👇 👇 👇 👇
Mstrsignals

Strategy Inc (NASDAQ: $MSTR) Might Be Gearing For A BreakoutStrategy Inc (NASDAQ: NASDAQ:MSTR ) shares might be set for a bullish move albeit market drawback. With the RSI at 49 NASDAQ:MSTR needs to break the 61.8% Fib level to accentuate the next levels for $MSTR.
Since the month of June 2025, the asset has lost 66% of its value moving in tandem with CRYPTOCAP:BTC 's momentum.
In recent news, Index provider MSCI late Tuesday said it would not boot publicly traded companies with big holdings of digital assets such as bitcoin from its indexes—for now. Fans of Strategy (MSTR), the company made famous for stockpiling cryptocurrency, applauded the decision: Its stock was recently up about 4%, a bit off earlier highs.
The news removed, or at least delayed, an overhang from Strategy's shares. MSCI last fall proposed removing digital asset treasury companies, or DATCOs, from its indexes following a proliferation of firms of that ilk, saying they resemble investment funds, which aren't eligible for inclusion. That spooked investors, as analysts estimated the move could spur other index providers to follow suit and cost the company billions in outflows.
Analyst Summary
According to 15 analysts, the average rating for MSTR stock is "Strong Buy." The 12-month stock price target is $485.86, which is an increase of 200.23% from the latest price.
About MSTR
Strategy Inc, together with its subsidiaries, operates as a bitcoin treasury company in the United States, Europe, the Middle East, Africa, and internationally. The company offers investors varying degrees of economic exposure to Bitcoin by offering a range of securities, including equity and fixed income instruments. It also provides AI-powered enterprise analytics software, including Strategy One.

STRATEGY Is this a 2000 Dotcom crash all over?Strategy (MSTR) has been on a strong sell-off since its November 2024 All Time High (ATH). A little more than 1 year of downtrend is classified as a Bear Cycle and it may be no coincidence that this ATH was priced marginally above Strategy's previous ATH of March 2000.
That was at the peak of the infamous Dotcom Bubble and its subsequent collapse. So are we having a 2000 crash all over again? Well, with Strategy's core business being exclusively Bitcoin related, we are poised to have a big one (since it follows BTC's Cycle to a certain extent) but not just as enormous as 2000's, which exceeded -99%, dropping the company to the brink of extinction.
Technically, we can have a correction of -90% though, which is the decline that the previous Bear Cycle in 2022 suffered. After all the dominant multi-decade pattern since the Dotcom bottom, has been a Channel Up, with the recent ATH testing its top and the 1M MA200 (orange trend-line) marking its Lows, hence the best buy opportunities in the last 10 years.
As a result, our long-term Target on MSTR remains $60.00, which would be a -90% correction from the Top, while also making direct contact with the 1M MA200. P.S. Notice also the similarities between the 1M RSI sequences.
---
** Please LIKE 👍, FOLLOW ✅, SHARE 🙌 and COMMENT ✍ if you enjoy this idea! Also share your ideas and charts in the comments section below! This is best way to keep it relevant, support us, keep the content here free and allow the idea to reach as many people as possible. **
---
💸💸💸💸💸💸
👇 👇 👇 👇 👇 👇

LOOK OUT FOR BITCOIN NEXT HIGH PROBABILITY MOVES SOON!!!🚨BTC HIGH PROBABILITY SETUPS 🚨
* Here We Can See Clearly The Next Potential Moves For BTCUSD Coming Hours/Days.
* Keep Your Eyes Close On Your Trading Positions.
* Happy PIP Hunting Traders.
FXKILLA.

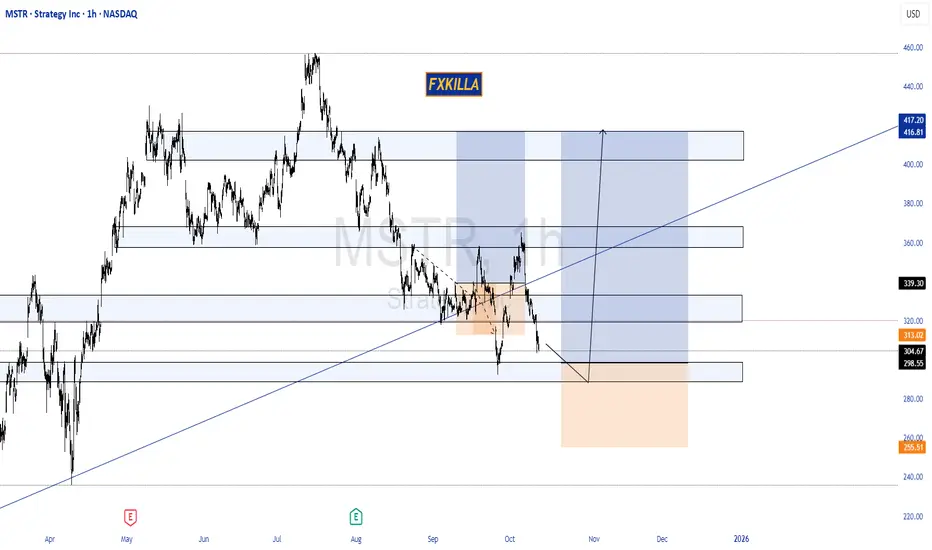
WATCH FOR MSTR HIGH PROBABILITY LONG SETUP SOON!!!🚨 MSTR HIGH PROBABILITY BUY SETUP 🚨
* Here We Can See Clearly The Next Potential Moves For MSTR Coming Hours/Days.
* Keep Your Eyes Close On Your Trading Positions.
* Happy PIP Hunting Traders.
FXKILLA.

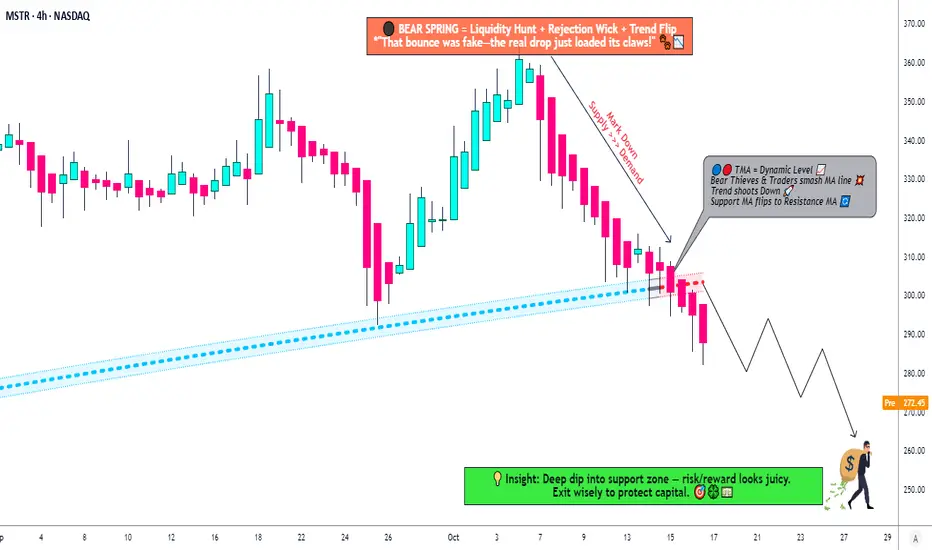
MSTR: Time to Short? Death Cross + Triangle Break Analysis🐻 MSTR "STRATEGY INC." - The Bear's Playground | Thief's Multi-Layer Setup 💰
📊 MARKET SNAPSHOT
Asset: NASDAQ:MSTR (Strategy Inc. - formerly MicroStrategy)
Current Price: ~$291.23 (Oct 17, 2025)
Setup Type: Swing/Day Trade - Bearish Confirmation
Strategy Style: "Thief Method" - Layered Limit Orders 🎯
🔍 THE SETUP - Why This Bearish Play Makes Sense
Ladies and Gentlemen, welcome to the Thief's playbook! 👋 MSTR just gave us a beautiful bearish signal with a triangular moving average breakdown. Here's what the charts are screaming:
🎯 The "Thief" Entry Strategy - Layered Limit Orders
This isn't your typical "buy now" play. We're sneaking in like a thief in the night with MULTIPLE SELL LIMIT LAYERS:
Entry Zones (Layer Your Shorts):
Layer 1: $310 (First resistance retest)
Layer 2: $300 (Psychological level)
Layer 3: $290 (Current consolidation zone)
💡 Pro Tip: Scale into your position! You can add MORE layers based on your risk tolerance (e.g., $305, $295, $285). The "Thief Method" is all about spreading your entries to catch the perfect price zones.
🛑 RISK MANAGEMENT - The Thief's Insurance Policy
Stop Loss: $320 🚨
(This is the Thief's emergency exit - if price breaks above this, the bears lost control)
⚠️ IMPORTANT NOTE:
Dear Thief OG's (Original Gangsters), this is MY stop loss level based on MY analysis. You should set YOUR OWN stop loss based on YOUR risk tolerance. Don't copy blindly - manage YOUR money, take YOUR profits (or losses) at YOUR own risk! This is YOUR trade, not mine. 💯
🎯 PROFIT TARGET - Where the Money's Hiding
Primary Target: $250 🎉
Why $250?
Strong historical support level
Oversold bounce zone (RSI typically rebounds here)
TRAP ALERT: Institutional buyers often accumulate at this level - be ready to ESCAPE with your profits before the bulls wake up! 🐂💤
⚠️ TAKE PROFIT NOTE:
Dear Thief OG's, $250 is MY target based on MY analysis. You can (and should) set YOUR own targets. If you're in profit at $270, $260, or even $280 - TAKE THE MONEY AND RUN! 💰 No shame in banking profits early. Remember: pigs get fat, hogs get slaughtered. This is YOUR trade, YOUR risk, YOUR decision!
🔗 RELATED ASSETS TO WATCH - The Correlation Game
MSTR doesn't trade in a vacuum! Keep your eyes on these correlated assets:
📈 Primary Correlation:
CRYPTOCAP:BTC (Bitcoin): ~$108,625 (Oct 17, 2025) - MSTR holds 640,000+ BTC (3%+ of total supply!)
Correlation Strength: 🔥🔥🔥🔥🔥 ULTRA HIGH
Why It Matters: MSTR is essentially a leveraged Bitcoin play. When BTC sneezes, MSTR catches a cold. Bitcoin's current bearish pressure directly impacts MSTR's valuation.
🔄 Secondary Watchlist:
NASDAQ:COIN (Coinbase): Crypto exchange - sentiment indicator
NASDAQ:RIOT (Riot Platforms): Bitcoin mining stock
NASDAQ:MARA (Marathon Digital): Another BTC-related equity
NASDAQ:CLSK (CleanSpark): Bitcoin mining operations
Key Point: If Bitcoin breaks below $105K support, expect MSTR to accelerate downward. Conversely, if BTC rallies back above $115K, this bearish setup could invalidate. Watch Bitcoin like a hawk! 🦅
📊 THE BIGGER PICTURE - Why MSTR Is Vulnerable Right Now
Bitcoin Pressure: BTC down -2.19% today, testing critical support levels
Institutional Caution: Recent S&P 500 rejection (not included in index) = credibility questions
Valuation Concerns: Trading at significant premium to NAV (Net Asset Value)
Technical Breakdown: Multiple MA crosses + trend reversal signals
Macro Headwinds: Risk-off sentiment in crypto markets (3-day consecutive decline)
🎓 THE THIEF'S WISDOM - Final Thoughts
This setup combines:
✅ Technical confirmation (MA breakout)
✅ Layered entry strategy (better average price)
✅ Clear risk management (defined stop loss)
✅ Realistic profit targets (strong support zone)
✅ Correlated asset monitoring (BTC relationship)
Remember: The market doesn't care about your opinion. Respect the charts, manage your risk, and don't get greedy. The "Thief Method" is about stealing profits intelligently, not gambling recklessly! 🎰❌
💬 TRADE SMART, NOT HARD!
This is a BEARISH SETUP with defined entries, exits, and risk parameters. Whether you're swing trading or day trading, the key is DISCIPLINE. Stick to your plan, don't chase, and protect your capital.
Questions? Thoughts? Drop them below! 👇
Let's build a community of smart traders who help each other win! 🤝
✨ If you find value in my analysis, a 👍 and 🚀 boost is much appreciated — it helps me share more setups with the community!
#MSTR #Bitcoin #BTC #TradingView #SwingTrading #DayTrading #BearishSetup #ShortSetup #CryptoStocks #TechnicalAnalysis #MovingAverages #LayeredEntry #RiskManagement #ProfitTarget #StrategyInc #MicroStrategy #ThiefMethod #TradingStrategy #StockMarket #NASDAQ
STRATEGY Mirror crash with 2022 to $60 has started.Michael Saylor won't like this. But the chart is what it is and that's an objective dynamic.
** The 5-year Channel Up and Bear Cycle **
Strategy (MSTR) has been trading within almost a 5-year Channel Up since the February 2021 Top of its previous Cycle. Within this lines, it has had its latest top (Higher High) on the week of November 18 2024 and since then it has been on a structured strong decline.
This decline has gotten even stronger once the price broke below its 1W MA50 (blue trend-line). So far, the 2025 correction is mirroring the 2021 one, which was the start of a 2-year (2021/21) Bear Cycle.
** The three Stages **
Based on that, we have valid reasons to expect that 2026 will also mirror the past Bear Cycle. What stands out on this analysis is that we have classified the whole Bear Cycle into three Stages. Based on that, we have now already entered Stage 2 as the price has broken below its 1W MA50 (and should stay as the Resistance for the remainder of the Cycle) and almost touched its 1W MA200 (orange trend-line). When that happened in January 2022, the market rebounded towards the 1W MA50 where it was rejected and when it broke below the 1W MA200 as well, Stage 3 started. This Stage made the Bear Cycle bottom on the 1M MA250 (red trend-line) after a -90% decline in total. It was completed when the price broke above the 1W MA50 again, essentially confirming the start of the new Bull Cycle.
** Where is the bottom now? **
As a result, we may now see a short-term rebound, limited by the 1W MA50, which after it gets rejected and breaks below the 1W MA200, Stage 3 may start. If this Bear Cycle also crashes by -90%, we should then be expecting a bottom at $60 (at least), supported by the 1M MA250 again.
Notice also the striking symmetry among the 1W RSI patterns of the two Cycle fractals. The 1W RSI has currently hit the 30.00 oversold barrier (similar to Jan 2022) and it was a second break and then a Higher Lows Bullish Divergence that confirmed the bottom of the Bear Cycle, essentially turning Strategy Inc. into a long-term buy opportunity again.
---
** Please LIKE 👍, FOLLOW ✅, SHARE 🙌 and COMMENT ✍ if you enjoy this idea! Also share your ideas and charts in the comments section below! This is best way to keep it relevant, support us, keep the content here free and allow the idea to reach as many people as possible. **
---
💸💸💸💸💸💸
👇 👇 👇 👇 👇 👇

MSTR HIGH PROBABILITY LONG SETUP SOON!!!🚨 MSTR HIGH PROBABILITY BUY SETUP 🚨
* Here We Can See Clearly The Next Potential Moves For MSTR Coming Hours/Days.
* Keep Your Eyes Close On Your Trading Positions.
* Happy PIP Hunting Traders.
FXKILLA.

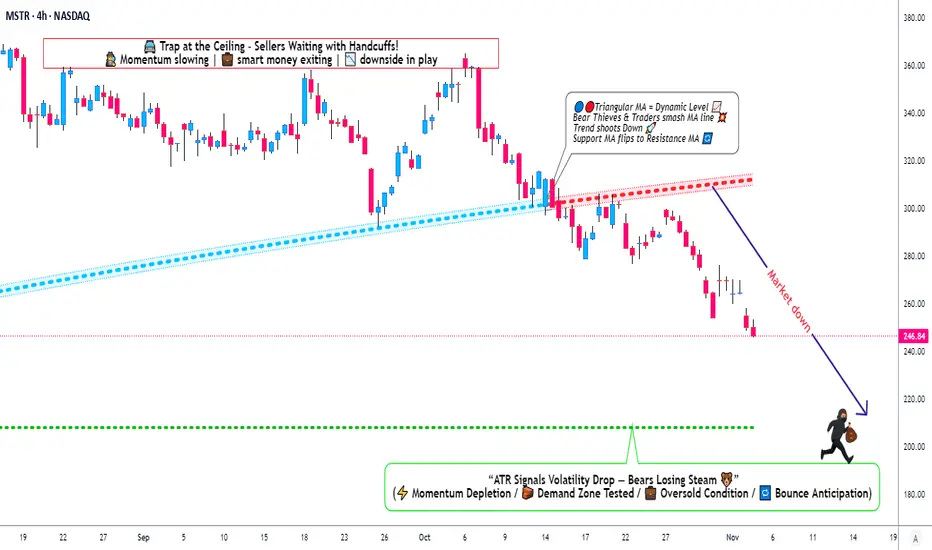
MicroStrategy Under Pressure: Bearish Playbook in Action🎯 MSTR: The "Thief's Playbook" - Strategic Bear Trap Setup! 💰🔥
📊 Asset Overview
MicroStrategy Inc. (MSTR) - Bitcoin's Proxy Play in the Stock Market
🎭 The Setup: When Bears Come to Party
Alright folks, gather 'round! We've got ourselves a textbook triangular moving average breakdown on MSTR that's screaming "short opportunity" louder than my portfolio after a bad trade week! 😅
Current Market Sentiment: 🐻 BEARISH CONFIRMED
The technicals are aligning like planets before a lunar eclipse - and trust me, this eclipse might cast some shadows on those long positions!
🎯 The "Thief Strategy" Game Plan
🚪 Entry Zones - The Layering Approach
Here's where it gets spicy! 🌶️ Instead of going all-in like a degen at a casino, we're using the "Thief Layering Method" - multiple limit sell orders to scale into this position:
Suggested Entry Layers:
🥇 Layer 1: $300
🥈 Layer 2: $290
🥉 Layer 3: $280
💎 Layer 4: $270
🔥 Layer 5: $260
Pro Tip: You can add MORE layers based on your risk appetite and account size. More layers = Better average entry = Smoother sleep at night! 😴
🛡️ Risk Management - The "Oh Sh*t" Line
Stop Loss: 🚨 $320
⚠️ IMPORTANT NOTICE: Dear Thief OGs, Ladies & Gentlemen! This SL is MY line in the sand. YOU need to decide YOUR own risk tolerance. Trade at your own risk, manage your own money, and don't blame me if things go sideways! This ain't financial advice - it's entertainment with charts! 🎪
🎁 Target Zone - Where We Cash Out
Take Profit Target: 🎯 $210
Why $210?
💪 Strong historical support level
📉 Oversold territory expected
Classic bull trap zone where longs get liquidated
⚠️ ANOTHER IMPORTANT NOTICE: Thief OGs! This is MY target. You do YOU! If you see profits earlier and want to secure the bag - DO IT! Don't be greedy. Take profits when YOU feel comfortable. Your account, your rules, your responsibility! 💼
🔗 Related Assets to Watch - The Correlation Game
Keep your eyes on these bad boys for confirmation:
📈 Direct Correlations:
NASDAQ:MARA (Marathon Digital) - Bitcoin miner, moves with crypto sentiment
NASDAQ:RIOT (Riot Platforms) - Another BTC miner, similar volatility pattern
NASDAQ:COIN (Coinbase) - Crypto exchange, sentiment indicator
CRYPTOCAP:BTC (Bitcoin spot) - The godfather! MSTR holds massive BTC, direct correlation
🧠 Key Points:
MSTR trades with ~1.5x-2x Bitcoin beta (more volatile than BTC itself)
When Bitcoin dumps, MSTR often dumps HARDER 📉
Watch BTC support at $60K - if it breaks, MSTR likely follows to our target zone
Tech sector weakness ( NASDAQ:QQQ , AMEX:SPY ) adds bearish pressure
⚡ Trading Psychology - The "Thief Mindset"
Look, this setup requires PATIENCE! 🧘♂️ Don't FOMO in at market price. Layer in like a professional thief planning a heist - calculated, methodical, strategic! This isn't gambling; it's probability management with a side of humor! 😎
🎪 Final Word from Your Friendly Neighborhood Chart Thief
Remember: Markets are wild, unpredictable, and don't care about your feelings OR your bills! This analysis is for educational and entertainment purposes ONLY. The "Thief Strategy" is MY trading style - it's risky, it's aggressive, and it's definitely NOT for everyone!
Do your own research. Manage your own risk. Trade what you can afford to lose. And for the love of all that's holy, don't mortgage your house based on some random internet chart analysis! 🏠❌
✨ If you find value in my analysis, a 👍 and 🚀 boost is much appreciated — it helps me share more setups with the community!
🏷️ #MSTR #MicroStrategy #ShortSetup #BearishBreakdown #SwingTrade #DayTrade #ThiefStrategy #BitcoinStocks #TechnicalAnalysis #MovingAverageCrossover #LayeringStrategy #RiskManagement #StockMarket #TradingIdeas #BTC #CryptoStocks #BearTrap #SupportAndResistance #ChartAnalysis #TradeSmart
🎯 Trade smart, layer in, manage risk, and may the profits be ever in your favor! 💰🚀
MSTR HIGH PROBABILITY BIG BULL MOVE SOON!!!🚨 MSTR HIGH PROBABILITY BUY SETUP 🚨
* Here We Can See Clearly The Next Potential Moves For MSTR Coming Hours/Days.
* Keep Your Eyes Close On Your Trading Positions.
* Happy PIP Hunting Traders.
FXKILLA.

$MSTR Swing Trade Setup: Layered Short Entries on Breakout📉 MSTR "STRATEGY INC" STOCK – Bearish Thief Plan (Swing/Scalp Setup)
⚡ Trade Setup (Bearish Pending Order Plan)
Asset: NASDAQ:MSTR (MicroStrategy Inc.)
Plan: Bearish (waiting for support breakout confirmation).
Entry Zone:
Pending breakout entry @ 320.00 ⚡
Layered “Thief” Strategy (scaling entries):
Sell Limit Layers: 340.00 / 330.00 / 320.00
You may add or adjust layers based on your own risk tolerance.
🔔 Set TradingView alerts at breakout levels to track price action.
Stop Loss (Thief Style):
Protective SL @ 360.00 (after breakout confirmation).
Adjust per your strategy & risk management.
Target Zone (Exit):
Police barricade support @ 290.00
Note: Take profit is discretionary — escape with profits at your own chosen level 🚪💰.
🔑 Why This Plan? (Thief Strategy Context)
The Thief Plan = using multiple layered limit entries after a breakout for better risk/reward.
Scaling entries gives flexibility while reducing FOMO and chasing.
Exit early at support barricades or oversold traps.
📊 MicroStrategy (MSTR) Market Data Report
As of September 7, 2025
1. Retail & Institutional Sentiment 🤝
Retail: Mixed / cautious (crypto exposure volatility).
Institutional: Neutral → slightly bearish (Bitcoin correlation + regulatory risk).
Estimated Sentiment: 55% Neutral / 30% Bearish / 15% Bullish.
2. Fear & Greed Index 😨😋
Current level: Neutral ~50/100
Suggests balanced emotions → no extreme greed or fear.
3. Fundamental & Macro Scores 📈📉
Fundamental ~60/100: MSTR tied to Bitcoin trends, highly volatile.
Macro ~55/100: Pressures include crypto regulation, tech volatility, interest rates.
Bitcoin remains the key driver.
4. Market Outlook 🐂🐻
Bull Case: BTC rally → MSTR boost, institutional adoption helps.
Bear Case: Regulatory clampdowns, BTC volatility → downside pressure.
Overall: Neutral → Slightly Bearish (short-term caution).
🚀 Key Takeaways
NASDAQ:MSTR moves in sync with Bitcoin → monitor BTC charts closely.
Sentiment is not strongly bullish → short setups have edge here.
Thief layering strategy aligns with volatility.
Always respect SL & manage risk 🔐.
🔗 Related Pairs to Watch
BITSTAMP:BTCUSD
NASDAQ:COIN (Coinbase)
NASDAQ:RIOT (Riot Platforms)
NASDAQ:MARA (Marathon Digital)
SP:SPX / NASDAQ:NDX (macro impact on tech/crypto plays)
✨ “If you find value in my analysis, a 👍 and 🚀 boost is much appreciated — it helps me share more setups with the community!”
#MSTR #MicroStrategy #Stocks #SwingTrade #Scalping #BearishSetup #CryptoStocks #LayeredStrategy #ThiefPlan #BitcoinCorrelation #TradingViewIdea

MSTR HIGH PROBABILITY SETUP SOON!!!🚨 MSTR HIGH PROBABILITY BUY SETUP 🚨
* Here We Can See Clearly The Next Potential Move For MSTR Coming Hours/Days.
* Keep Your Eyes Close On Your Trading Positions.
* Happy PIP Hunting Traders.
FXKILLA.
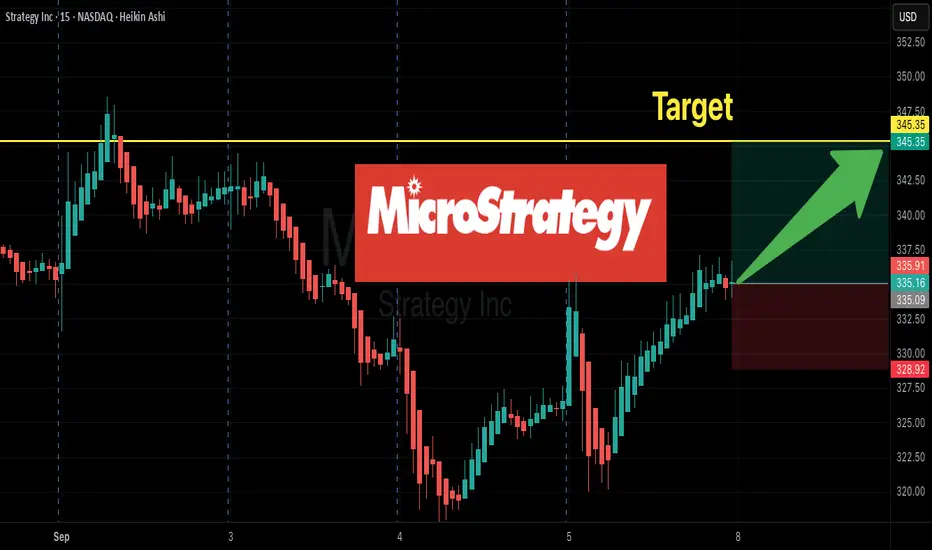
MSTR Options Flow Screams Bullish — Can $345C Print This Week?
# ⚡ MSTR Weekly Trade Setup (2025-09-07)
**Bias:** 🎯 Mixed → speculative bullish bounce
**Conviction:** ⭐⭐⭐ (60%)
---
### 📊 Key Takeaways
* ✅ **Options flow:** Strongly bullish (C/P = 2.21)
* ❌ **Trend:** Still bearish (-16.45% monthly, RSI weak)
* ⚠️ **Volume:** Flat (1.0x avg) → no institutional conviction
* 🌐 **Volatility:** Low (VIX \~15) → cheap calls
* 🧱 **OI Walls:** \$340C & \$345C = resistance / gamma levels
---
### 🎯 Trade Plan (Speculative Play)
* **Instrument:** \ NASDAQ:MSTR
* **Direction:** CALL (naked)
* **Strike:** \$345.00
* **Expiry:** 2025-09-12 (weekly)
* **Entry Price:** \$8.60 (ask)
* **Profit Target:** \$12.90 (≈1.5×)
* **Stop Loss:** \$5.59 (\~35% risk)
* **Size:** 1 contract (small, punt-sized)
* **Entry Timing:** Open (prefer limit near ask)
---
### 🧠 Rationale
* Flow is unambiguously bullish, but **price trend & RSI weak** → treat as a bounce, not reversal.
* \$345C offers liquidity (OI 14,439) + better risk balance than \$340C.
* 5 DTE = **theta risk**, so trade is **binary/speculative**.
---
### ⚠️ Key Risks
* 📉 Trend is down → bounce may fail quickly.
* ⏳ Time decay fast with only 5 DTE.
* 🧱 Gamma/OI walls may cap upside near \$345.
* 📰 Macro/news can swamp bullish flow.
---
## 📌 TRADE DETAILS (JSON)
```json
{
"instrument": "MSTR",
"direction": "call",
"strike": 345.0,
"expiry": "2025-09-12",
"confidence": 0.60,
"profit_target": 12.90,
"stop_loss": 5.59,
"size": 1,
"entry_price": 8.60,
"entry_timing": "open",
"signal_publish_time": "2025-09-07 07:45:34 EDT"
}
```
---
🔥 **Summary:**
This is a **flow-driven speculative call punt** — risk small, size small, exit fast.
If flow + price action confirm, \ NASDAQ:MSTR \$345C has upside.
If not → cut quick.
MSTR Short Alert | Lean Short Bias at $335
# ⚡ MSTR Short Alert | Lean Short Bias (Sep 2, 2025) 🪙📉
📊 **Market Summary:**
* Daily/Intraday: Bearish (Price < daily EMAs, RSI \~35, MACD negative) 🔻
* Weekly: Weakening but not decisively broken (near/above 50-week EMA) 📈
* Volume: Light — low participation on recent declines ⚖️
* Headlines: Neutral; watch BTC correlation & macro events 📰
**Net Bias:** Lean short on daily timeframe; small position recommended 🐻
---
## ✅ Trade Plan
* 🎯 **Instrument:** MSTR
* 🔀 **Direction:** SHORT
* 💵 **Entry Price:** \~335.0 (acceptable 333–336)
* 🛑 **Stop Loss:** 341.13 (daily resistance / pivot)
* 🎯 **Take Profit:** 320.00 (scale 60%), trail remaining 40% to 310.00
* 📊 **Position Size:** 1.5% of portfolio
* 📈 **Confidence:** 60%
* ⏰ **Entry Timing:** Market Open
---
## ⚠️ Key Risks
* Low volume → false break / short-squeeze risk ⚡
* MSTR-BTC correlation or S\&P rumors could gap price higher 🪙
* Weekly support \~322–325 may limit downside 🛑
---
## 💡 Trade Rationale
* Daily + 30m confluence: short-term bounce attempts stalling under intraday resistances (336–339)
* Weekly momentum weakening → controlled small-size short
* Stop above 341.13 → disciplined risk management
---
\#️⃣ **Tags / Hashtags:**
\#MSTR #ShortTrade #StockTrading #SwingTrade #CryptoCorrelation #DailyRSI #TradingSignal #RiskManagement 🐻🔥

MSTR WEEKLY OPTIONS SETUP (2025-07-28)
### 🔻 MSTR WEEKLY OPTIONS SETUP (2025-07-28)
**Bearish Divergence with High Confidence — Time to Strike with a PUT?**
---
📊 **Momentum Recap:**
* **RSI:** Bearish 📉
* **Volume:** Weak (institutional exit risk)
* **Options Flow:** Mixed (calls > puts, but no alignment with price)
* **Sentiment Models:** Split 4:1 → **Only Claude/Anthropic** goes bearish with conviction
🧠 **Model Consensus:**
> “Momentum is weak, volume fading, and no upside confirmation = bearish edge.”
---
### ✅ SETUP OVERVIEW
* 🔍 **Trend:** Bearish (declining RSI)
* 📉 **Volume:** Weak = reduced institutional conviction
* 💬 **Options Flow:** Bullish bias, but **contradicts price trend**
* ⚙️ **Volatility:** Elevated, potential reward for directional plays
**Overall Bias:** 🔴 *Moderately Bearish*
---
### 💥 TRADE IDEA: MSTR \$400P
* 🎯 **Strategy:** Long Weekly Put
* 🔻 **Strike:** 400.00
* 📆 **Expiry:** Aug 1, 2025
* 💸 **Entry Price:** \$8.65
* ✅ **Profit Target:** \$12.50
* 🛑 **Stop Loss:** \$4.00
* 📈 **Confidence Level:** 72% (backed by Claude model)
* 📉 **Breakdown Trigger:** Below \$405 confirms bearish flow
* ⚠️ **Invalidation:** Break above \$415 → exit early
---
### 📦 TRADE\_DETAILS (Backtest/Algo Ready JSON)
```json
{
"instrument": "MSTR",
"direction": "put",
"strike": 400.0,
"expiry": "2025-08-01",
"confidence": 0.72,
"profit_target": 12.50,
"stop_loss": 4.00,
"size": 1,
"entry_price": 8.65,
"entry_timing": "open",
"signal_publish_time": "2025-07-31 09:30:00 UTC-04:00"
}
```
---
### 🧠 TRADE INSIGHTS
* 🟥 4/5 models say **no trade** due to signal divergence
* 🧠 **Claude’s bearish thesis = cleanest directional setup**
* 🚨 Volume + RSI combo = downside confirmation
* 🧭 Watch key price reaction zones: **\$400–\$405 (support)** / **\$415 (resistance cap)**
---
**#MSTR #PutOptions #WeeklyTrade #BearishSetup #OptionsFlow #QuantTrading #ClaudeModel #MarketMomentum**

Navigating MSTR’s Price Swings: A Smart Options ApproachOverview
MicroStrategy (MSTR) has continued to capture market attention due to its aggressive Bitcoin strategy and significant stock price volatility. In 2025, MSTR surged 41% in one quarter but also reported a massive $4.22 billion net loss in Q1, raising concerns about long-term financial stability. Analysts remain divided, setting price targets ranging from $200 to $650, largely dependent on Bitcoin’s performance and broader market conditions.
Key Developments Impacting MSTR
✔ Bitcoin Exposure: MSTR maintains a large Bitcoin position, making its stock highly correlated to BTC’s price movements.
✔ AI Integration: The company is investing in AI-driven products, which could provide diversification outside of Bitcoin.
✔ Institutional View: Analysts remain split on MicroStrategy’s valuation due to its uncertain revenue model.
✔ Macro Volatility: Market-wide sentiment, interest rates, and crypto regulations will influence MSTR’s trajectory.
Options Strategy for the Week
🚀 Iron Condor Setup for June 6 Expiration
To capitalize on MSTR’s volatility while managing risk, an Iron Condor strategy is structured within a controlled range:
- Inner Range: Sell Calls at 395 and Puts at 335
- Coverage: Buy Calls at 415 and Puts at 315
✅ Objective: Profiting from sideways price movement while minimizing exposure to extreme volatility.
✅ Risk Management: If MSTR breaks above 415 or below 315, the long positions hedge against excessive losses.

MSTR Weekly Options Trade Plan 2025-05-24MSTR Weekly Analysis Summary (2025-05-24)
Summary of Each Model’s Key Points
Grok/xAI Report
Technicals: Short-term and daily charts show bearish momentum but oversold conditions (5-min RSI ~22, price near lower Bollinger Band) hint at a bounce. Sentiment: Elevated VIX (22.29), negative Bitcoin-bet headlines, insider sell-offs; max pain at $400 may cap upside. Direction: Moderately Bearish with potential for a relief rally. Trade: Buy $370 call at $13.00, aiming for +25% ($16.25), stop at 20% loss ($10.40), 65% confidence.
Claude/Anthropic Report
Technicals: Deep bearish momentum below all EMAs; M5 RSI oversold, daily RSI near oversold. Sentiment: Rising VIX, mixed Bitcoin headlines, heavy put open interest at $350–$360. Direction: Moderately Bearish but conflicting bounce signals. Trade: No trade—confidence only 45%.
Llama/Meta Report
Technicals: Bearish trend on both timeframes; oversold M5 RSI. Sentiment: Elevated volatility; mixed news; max pain theory. Direction: Moderately Bearish. Trade: Buy $367.50 put (ask $12.30–bid $11.85), profit +20%, stop 50%, 70% confidence.
Gemini/Google Report
Technicals: Overwhelming bearish across EMAs, RSI, MACD, price breaks on high volume. Sentiment: VIX rising, negative news, skewed options flow. Direction: Strongly Bearish. Trade: Buy weekly $310 put (est. ask ~$0.70), target 100–200% gains, stop at $0.35, 65% confidence.
DeepSeek Report
Technicals: Bearish on both charts but oversold; mixed reversal vs. continuation signals. Sentiment: VIX up, mixed news, distant max pain. Direction: Neutral/Unclear. Trade: No trade—confidence 55%. Areas of Agreement and Disagreement
Agreement
Broadly bearish technical setup: price under EMAs, negative MACD, RSI oversold short term. Elevated volatility (VIX ~22) supporting larger swings. Weekly expiry options, with traders positioned for downside (heavy put OI).
Disagreement
Trade bias: Grok favors a call bounce; Llama and Gemini prefer deep-OTM puts; Claude and DeepSeek opt out. Strike choice: Ranges from near-the-money calls ($370) to far-OTM puts ($310). Confidence thresholds and risk/reward preferences differ, leading to divergent trade/no-trade conclusions. Conclusion and Recommendation
Overall Market Direction Consensus: Bearish (various intensities from moderate to strong).
Recommended Trade: Buy a naked weekly put.
• Strike Selection: $355 put offers a balance of liquidity (OI 2,042), premium ($7.45 ask), and proximity to current price (downside leverage without needing an extreme move). • Expiry: 2025-05-30 weekly. • Premium: $7.45 (within or near preferred risk range). • Entry Timing: At market open. • Profit Target: +25% (~$9.31). • Stop Loss: –20% (~$5.96). • Position Size: 1 contract. • Confidence Level: 65%.
Key Risks and Considerations
A short-term bounce could spike implied vol and lift call skew, hurting put value. Support at $362 may hold, capping downside. Elevated volatility could widen spreads; ensure limit orders. Maintain strict stop-loss to prevent outsized premium decay losses.
TRADE_DETAILS (JSON Format)
{ "instrument": "MSTR", "direction": "put", "strike": 355.0, "expiry": "2025-05-30", "confidence": 0.65, "profit_target": 9.31, "stop_loss": 5.96, "size": 1, "entry_price": 7.45, "entry_timing": "open", "signal_publish_time": "2025-05-25 09:30:00 UTC-04:00" } 📊 TRADE DETAILS 📊 🎯 Instrument: MSTR 🔀 Direction: PUT (SHORT) 🎯 Strike: 355.00 💵 Entry Price: 7.45 🎯 Profit Target: 9.31 🛑 Stop Loss: 5.96 📅 Expiry: 2025-05-30 📏 Size: 1 📈 Confidence: 65% ⏰ Entry Timing: open 🕒 Signal Time: 2025-05-24 14:57:32 EDT
Disclaimer: This newsletter is not trading or investment advice but for general informational purposes only. This newsletter represents my personal opinions based on proprietary research which I am sharing publicly as my personal blog. Futures, stocks, and options trading of any kind involves a lot of risk. No guarantee of any profit whatsoever is made. In fact, you may lose everything you have. So be very careful. I guarantee no profit whatsoever, You assume the entire cost and risk of any trading or investing activities you choose to undertake. You are solely responsible for making your own investment decisions. Owners/authors of this newsletter, its representatives, its principals, its moderators, and its members, are NOT registered as securities broker-dealers or investment advisors either with the U.S. Securities and Exchange Commission, CFTC, or with any other securities/regulatory authority. Consult with a registered investment advisor, broker-dealer, and/or financial advisor. By reading and using this newsletter or any of my publications, you are agreeing to these terms. Any screenshots used here are courtesy of TradingView. I am just an end user with no affiliations with them. Information and quotes shared in this blog can be 100% wrong. Markets are risky and can go to 0 at any time. Furthermore, you will not share or copy any content in this blog as it is the authors' IP. By reading this blog, you accept these terms of conditions and acknowledge I am sharing this blog as my personal trading journal, nothing more.

Market Close Update: MSTR Long PlayMSTR had a strong bounce off the $300 Price Levels of Support in it's last trading session, with it contiinuing to push higher going into the Pre-Market Session/Intraday Session, gaining another $29.24/share by Market Close at $379.09. A total of $33+ at it's Intraday High. $378.40 was a previous Level of Support so really interested to see how it reacts to those levels going into to Tomorrow's Market Open. Looking to see if that previous support turns into resistance, providing another opportunity to buy-in on a potential buy-in around the $349.99 Levels. With Bitcoin is back above $100K, sitting at $102,054 but potentially retesting $100K again, could also encourage another opportunity to get in on MSTR. Buy Limit set with a Stop Loss of $347.38 on this trade and a Price Target of $415.68.
Follow us to stay tuned for even more at MyMI Wallet! @MyMIWallet #MyMIWallet

MICROSTRATEGY Top of the Channel. Time for a shortterm pullback?MicroStrategy Inc. (MSTR) has been trading inside a logarithmic Channel Up on the 1D time-frame since the December 30 2022 bottom. The price is currently at the very top (Higher Highs trend-line) of the pattern and that is a technical bearish signal on its own.
It gets increasingly relevant though if we consider the 1D RSI which is overbought and at its highest level since November 13 2023 and more importantly, the remarkable symmetry among the phases of the Channel Up.
As you ca see the price action from the October 04 2023 Higher Low until today is very similar with the price action from the December 30 2022 bottom until (so far) the April 14 2023 High. Both started on a +136.17% rise then -40% correction and a Channel Up rebound for a new Higher High. The symmetry is evident among the 1D RSI sequences as well.
If this continues to hold, we should be expecting a -22.88% pull-back followed by a +77.48% rally that will break above the long-term Channel Up, which would inevitably do at some point since the stock price is so positively correlated to Bitcoin's price.
-------------------------------------------------------------------------------
** Please LIKE 👍, FOLLOW ✅, SHARE 🙌 and COMMENT ✍ if you enjoy this idea! Also share your ideas and charts in the comments section below! This is best way to keep it relevant, support us, keep the content here free and allow the idea to reach as many people as possible. **
-------------------------------------------------------------------------------
💸💸💸💸💸💸
👇 👇 👇 👇 👇 👇
