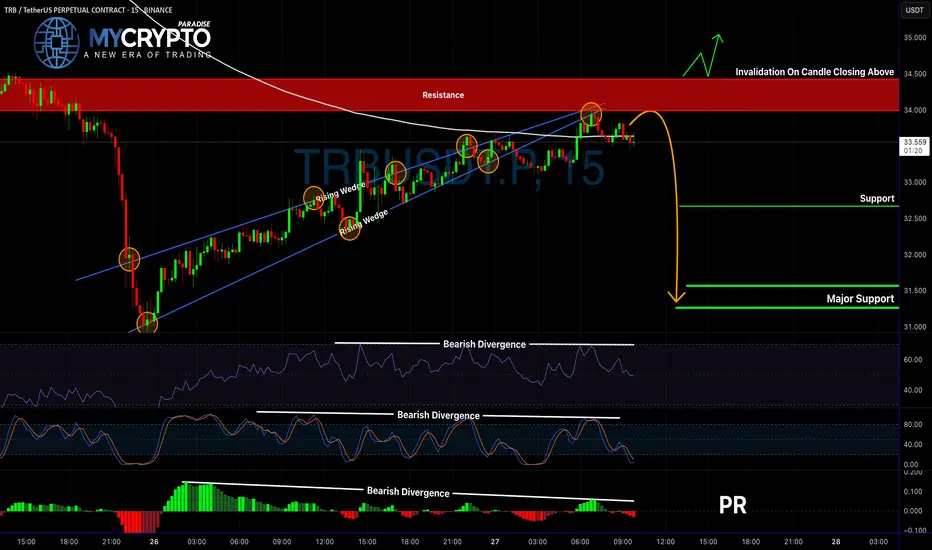
TRBUSDT Danger Zone: Bears Taking ControlYello Paradisers, are you ready for the next big move on TRB? This chart is flashing some serious warning signs that most traders will completely ignore until it’s too late. Let’s break it down before the market makes its move.
💎TRBUSDT has broken down from a rising wedge pattern and retested the resistance zone near the 200 EMA. At the same time, there are bearish divergences showing on the Stoch RSI, RSI, and the MACD histogram. When these signals align, the probability of a bearish move increases significantly, and traders need to be extra cautious.
💎Aggressive traders could already be thinking about entering from the current levels. However, this setup only offers a 1:1 risk-to-reward ratio, which is not ideal for long-term consistent profitability. Entering too early without a solid edge often leads to frustration and unnecessary losses.
💎For those aiming to trade more safely, it is better to wait for a pullback followed by confirmation from a bearish candle. This will provide a stronger risk-to-reward profile and also help maintain discipline in the long run. Protecting capital and choosing only high-quality setups is what separates professionals from amateurs.
💎That being said, if the price breaks out and closes above the invalidation level, then the bearish outlook will be completely invalidated. In that case, flexibility is key, and adjusting to what the market gives us is the only way to stay ahead.
🎖Patience and discipline remain the foundation of trading success. Avoid the temptation of low-probability trades, think strategically, and always protect your capital. This is the only way to last long enough in the market to reap the real rewards.
MyCryptoParadise
iFeel the success🌴
Mycryptoparadise
BITCOIN MASSIVE CRASH TOWARDS $44K JUST STARTED!!!? (warning) Yello Paradisers!
In this video, I'm sharing with you the CME futures gap that we have created and what needs to be done to close it. On the ultra-high time frame, I'm sharing with you the bearish cross. We are shifting our focus afterward to the high time frame where I'm seeing the bullish divergence. I'm telling you where the daily candle cannot close.
Then, we move our focus to the medium time frame, where I'm sharing with you the RSI bullish divergence plus the support. On the lower time frame, we will look in the next video.
Paradisers! Keep in mind to trade only with a proper professional trading strategy. Wait for confirmations. Play with tactics. This is the only way you can be long-term profitable.
Remember, don’t trade without confirmations. Wait for them before creating a trade. Be disciplined, patient, and emotionally controlled. Only trade the highest probability setups with the greatest risk to reward ratio. This will ensure that you become a long-term profitable professional trader.
Don't be a gambler. Don't try to get rich quick. Make sure that your trading is professionally based on proper strategies and trade tactics.

Can #BAND Bulls Maintain this Momentum or Will Bears Win? Yello, Paradisers! Is #BANDProtocol breakout from the falling wedge legit—or are bulls walking straight into a trap? Let's dig into the latest setup of #BANDUSDT:
💎After trading for weeks inside a falling wedge, #BAND has finally broken out with solid momentum. The breakout above the resistance trendline at around $0.66 has already occurred, and the price is currently hovering near the $0.72 zone. While this move is promising, it’s now all about whether this breakout can hold or fake out.
💎The structure here is clear: #BANDUSD reclaimed the demand zone between $0.60–$0.66 after bouncing off strong support at $0.504. This zone now becomes the most important area to watch in the short term. A retest of this level would offer a high-probability continuation setup, especially since the 50EMA is now acting as dynamic support beneath the price.
💎If bulls can maintain control, we have a clear path toward the moderate resistance at $0.992. That’s where the next wave of selling pressure is expected. But the real prize is the strong resistance zone near $1.180. That’s the level where major distribution could occur, and it's where we’ll be watching closely for profit-taking signs.
💎However, the bullish thesis breaks down completely if the price drops back below the $0.60–$0.66 demand zone. In that case, our invalidation point sits firmly at $0.504. A close below that support would indicate bears are back in control, and we’d shift to a defensive stance, targeting lower re-entry zones.
Stay patient, Paradisers. Let the breakout confirm, and only then do we strike with conviction.
MyCryptoParadise
iFeel the success🌴

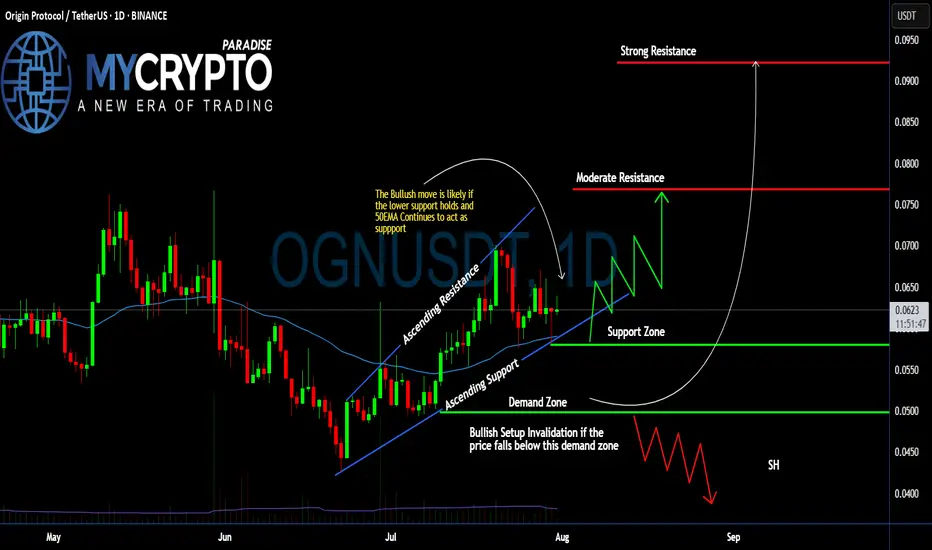
#OGN Ready For a Massive Bullish Move | Must Watch For BullsYello, Paradisers! Is #OriginProtocol about to explode to the upside, or is this a bull trap in disguise waiting to liquidate the impatient? Let’s break down what’s brewing on #OGNUSDT:
💎After forming a clean ascending channel, #OGN has been respecting both the ascending resistance and ascending support levels. Price is currently trading just above the 50 EMA, which has been acting as a dynamic support line since early July. This structure shows clear buyer interest around the $0.058–$0.062 zone—an area that aligns with volume cluster support.
💎The bullish scenario remains valid as long as #OGNUSD holds above the demand zone between $0.0499–$0.0580, and especially if it stays above the 50 EMA. As long as this structure is maintained, we could see a bounce toward the moderate resistance level at $0.076, where previous sellers stepped in and price stalled.
💎If buyers can break through that moderate resistance with strength and rising volume, the next key target lies at $0.092, which aligns with a strong resistance level and high-volume node on the visible range. This area is likely to trigger a reaction, so traders should remain agile.
💎However, if price breaks down below the demand zone, this would invalidate the current bullish setup and open the door for a potential move back toward the $0.045–$0.040 area. A broader shakeout would likely accompany this and could trap many late long entries.
Stay patient, Paradisers. Let the breakout confirm, and only then do we strike with conviction.
MyCryptoParadise
iFeel the success🌴
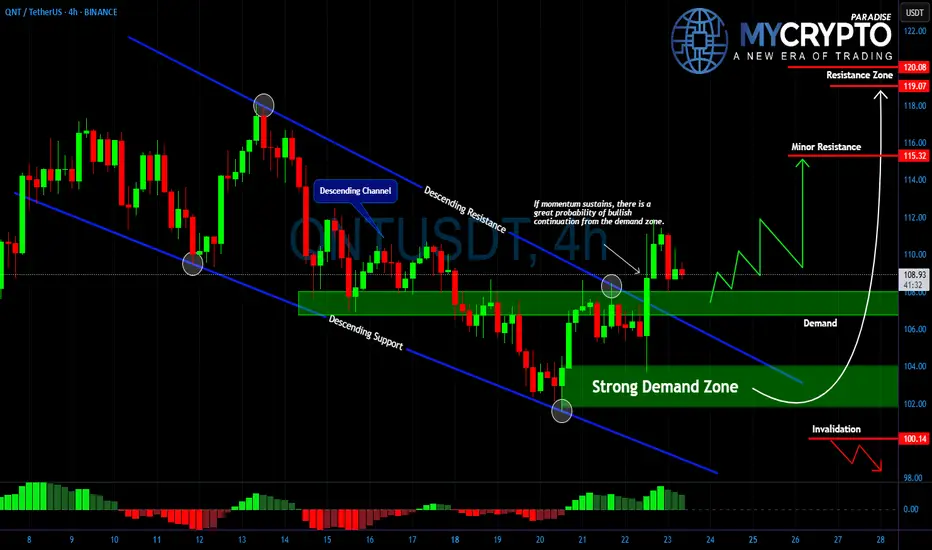
QNT at Demand Zone – Breakout or Breakdown Ahead?Yello traders, #QNTUSDT is now testing a critical demand zone that has repeatedly acted as strong support between 102 and 105. After weeks of moving inside a descending channel, buyers have managed to defend this level, and the market is once again attempting a bullish continuation.
💎Momentum remains fragile, and the immediate test lies ahead at 115, which stands as minor resistance. A clean break and hold above this level could unlock a push toward the stronger resistance zone at 119–120, where sellers are likely to become more aggressive.
💎On the other side, a failure to sustain above the demand zone would quickly shift the structure bearish again. If price breaks below 100, the bullish scenario would be invalidated and deeper downside could follow.
💎This is a decisive moment for #QNT. Patience and discipline are key, as the next move will either confirm a strong breakout or trap late buyers before reversing. Strive for consistency, not quick profits. The market is designed to punish the impatient and reward those who wait for confirmation at key levels.
MyCryptoParadise
iFeel the success🌴
PEPE at the Edge of Disaster or the Start of a Monster Reversal?Yello Paradisers, is PEPE about to break free from its falling wedge or are we staring at another brutal sell-off? After weeks of pressure to the downside, price is now testing the $100–$105 demand zone. This level has been the battleground where bulls and bears repeatedly clash, and the move from here could decide the next big trend.
💎A confirmed breakout above descending resistance would validate the wedge pattern and open the path higher. The first target sits at $1184, with possible continuation into the $1240–$1271 supply zone as momentum builds. This would mark the beginning of a powerful shift in market structure.
💎On the other hand, failure to hold demand and a breakdown below $947 would invalidate the bullish setup completely. In that scenario, selling pressure would accelerate as trapped longs get forced out, driving price into deeper lows.
💎This is a textbook example of why patience is crucial. Jumping in too early means risking a trap, while waiting for confirmation allows you to act only on the highest-probability setups. The market is coiling for a big move, but only those who stay disciplined will come out on the winning side.
Trade smart, Paradisers. Consistency and patience always beat emotions. The winner circle is reserved only for those who know how to wait.
MyCryptoParadise
iFeel the success🌴

BITCOIN PREDICTION: PUMP TO $135K STARTING???! (Buy Now?) Yello Paradisers! In this video, I'm sharing with you the high time frame chart, the double shooting star candlestick pattern, double top formation, bearish divergence that needs to be confirmed, and its channel that we are trying to break to the downside. High time frame chart, I'm sharing with you the ABC zigzag and the potentiality of that C move being already finished. If not, the previous low needs to hold, and we are looking at things on a medium time frame. The bullish things on a medium time frame are the bullish divergence, and on a low time frame chart, the Elliott wave count that seems to be completed to the downside. If the previous low is going to hold, we are starting a new impulse towards $129,000 as a higher degree third wave. Then we will have a fourth wave, and the final fifth wave will take us towards $135,000. Watch the video where I'm explaining all the confirmations and the price action dynamics, and how we will be developing with the highest probability.
Paradisers! Keep in mind to trade only with a proper professional trading strategy. Wait for confirmations. Play with tactics. This is the only way you can be long-term profitable.
Remember, don’t trade without confirmations. Wait for them before creating a trade. Be disciplined, patient, and emotionally controlled. Only trade the highest probability setups with the greatest risk to reward ratio. This will ensure that you become a long-term profitable professional trader.
Don't be a gambler. Don't try to get rich quick. Make sure that your trading is professionally based on proper strategies and trade tactics.

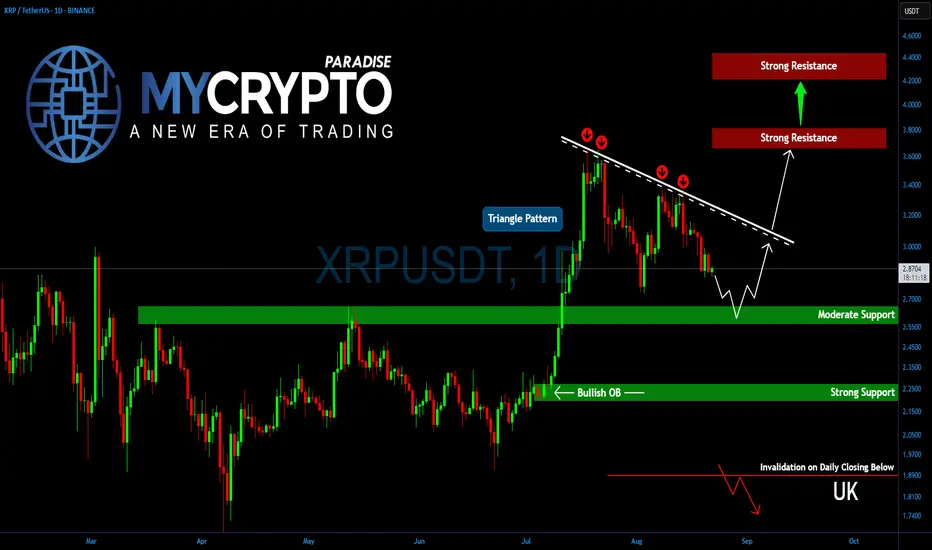
Triangle or Trap? XRP’s Next Move Could Shock TradersYello, Paradisers! Is #XRP quietly preparing for its second explosive leg? The chart is tightening fast, and the next move will decide everything.
💎XRP has been one of the strongest altcoins in this rally, holding momentum after July’s major leg up. Price action is now consolidating inside a triangle formation, which often signals continuation before the next move. This consolidation is also beginning to resemble a potential bull flag, a strong bullish setup.
💎For #XRPUSDT, the key to confirmation lies at $3.15. A breakout above the descending resistance with strong volume would trigger the second bullish leg, sending XRP toward $3.70–$3.85. If momentum carries through, the move could even extend to $4.20–$4.40, which aligns with the 161.8% Fibonacci extension.
💎On the downside, solid support sits between $2.65–$2.55. The longer price holds above this range, the stronger the base bulls will have to push higher. In the case of aggressive profit-taking, XRP could retest $2.25–$2.20, a strong support zone that is expected to withstand any deeper breakdown attempts.
Paradisers, strive for consistency, not quick profits. Treat the market as a businessman, not as a gambler.
MyCryptoParadise
iFeel the success🌴
BITCOIN PREDICTION: HERE IS WHERE THE CRASH WILL STOP!!! (deep) Yello Paradisers! In this video, I'm sharing with you an Ultra High Time Frame: the double-top shooting star candlestick pattern formation plus bearish divergence, plus that we are trying to break below our channel.
On a high timeframe chart, I'm sharing with you the ABC zigzag, explaining that right now we are in the C wave, which is a motive mode wave. That means five waves to the upside, and with the highest probability, right now we are in the secondary wave that on its primary waves is creating a zigzag formation.
The 0.786 Fibonacci retracement level needs to hold, and the channel can't be reclaimed. I'm sharing with you the kind of confirmations for both short and long positions we are waiting for with the ParadiseTeam.
On a medium timeframe, we are seeing the first bullish signs and a bullish divergence, where we need to wait for confirmations before taking action. We are also looking at the Fibonacci support that is supporting the finishing of Wave 2.
On the low timeframe chart, we are analyzing the higher degree secondary wave, which is a zigzag. A and C waves are motive mode waves, so we are waiting for the completion of the five-moonstone downside inside of the C wave. This might perfectly confluence with the 0.618 Fibonacci's extension of Wave A, which is usually where the C Wave ends.
Paradisers! Keep in mind to trade only with a proper professional trading strategy. Wait for confirmations. Play with tactics. This is the only way you can be long-term profitable.
Remember, don’t trade without confirmations. Wait for them before creating a trade. Be disciplined, patient, and emotionally controlled. Only trade the highest probability setups with the greatest risk to reward ratio. This will ensure that you become a long-term profitable professional trader.
Don't be a gambler. Don't try to get rich quick. Make sure that your trading is professionally based on proper strategies and trade tactics.

BITCOIN PREDICTION: BIGGER CRASH INCOMING!?? (warning) Yello Paradisers! In today's video, I'm revealing the truth to you. I'm sharing the Ultrahigh timeframe chart, which includes the shooting star double top formation, plus bearish divergence and the channel. And I'm revealing the Elliot wave theory on the Ultrahigh timeframe.
On the high timeframe chart, I'm revealing to you the ABC zigzag and the possibility that we have already concluded the five moves to the upside. I'm sharing with you the bearish divergence and the confirmation that is needed, and what needs to happen for us to go down to $108,000.
On a medium timeframe, we are seeing the triangle reclaim on low volume, but we are also checking the bullish divergence where we are waiting for confirmation. If the Elliott Wave breaks below $112,000, we will go lower toward $108,000. Then, the structure from an Elliott Wave perspective is going to turn bearish, and we will be treating the market as bearish and looking for short opportunities. But if you are able to reclaim it, we are looking for buying opportunities if you are able to defend the low. I'm sharing with you what kind of confirmations I'm waiting for so you can tactically also approach the market.
On the low timeframe chart, we are concluding the wave structure and waiting for its next move.
Paradisers! Keep in mind to trade only with a proper professional trading strategy. Wait for confirmations. Play with tactics. This is the only way you can be long-term profitable.
Remember, don’t trade without confirmations. Wait for them before creating a trade. Be disciplined, patient, and emotionally controlled. Only trade the highest probability setups with the greatest risk to reward ratio. This will ensure that you become a long-term profitable professional trader.
Don't be a gambler. Don't try to get rich quick. Make sure that your trading is professionally based on proper strategies and trade tactics.

Is #VET Ready for Massive Bullish Rebound or Not? Watch CloselyYello, Paradisers! Is #VET setting up for a breakout play, or are we about to witness another classic bull trap unfold? Let’s dig into what the chart is telling us on #VeChain:
💎After climbing steadily inside an ascending channel, #VETUSDT is now approaching a major resistance zone around $0.02–$0.02. A confirmed breakout above this area would significantly boost the probability of a bullish continuation, especially with the 50EMA providing dynamic support from below.
💎The immediate support zone to watch is between $0.020–$0.022, which aligns with the channel’s lower boundary and a visible demand zone. This is the key level where bulls are expected to step in if #VETUSD pulls back.
💎If buyers defend this zone successfully and price breaks above the current resistance, the next upside target lies at the moderate resistance of $0.031. Beyond that, the strong resistance level at $0.038 will be the real decision point for any sustained move higher.
💎On the flip side, a breakdown below $0.020 would send it to the lower demand zone at $0.016. It would invalidate the bullish setup and open the door for a deeper selloff, potentially forming a new swing low as shown on the chart.
Stay patient, Paradisers. Let the breakout confirm, and only then do we strike with conviction.
MyCryptoParadise
iFeel the success🌴

HBAR Bull Flag Is Ready to Explode, But Only If One Level FallsYello, Paradisers! Is #HBAR quietly setting up for its biggest breakout of the year? The chart is heating up fast, and the next move will be decisive.
💎Since forming a double bottom around $0.128, HBAR has bounced sharply, showing clear strength. The price action is now shaping into a potential bullish flag pattern, but the bulls are stuck at a critical barrier.
💎The $0.285–$0.30 zone is proving to be a major challenge, as it combines both horizontal resistance and the 61.8% Fibonacci retracement. Since mid-July, not a single daily candle has been able to close convincingly above this level, a clear sign of just how important this wall is.
💎For #HBARUSDT, a strong breakout and close above $0.30 with real volume would open the doors to a major bullish move, targeting the $0.380–$0.410 zone. This range not only marks the next strong resistance but also aligns with HBAR’s 52-week high.
💎On the downside, solid support lies between $0.235–$0.22, a zone that has held firm since mid-July within a converging triangle formation. As long as HBAR stays above this range, the bullish setup remains valid, and the breakout pressure continues to build.
Paradisers, strive for consistency, not quick profits. Treat the market as a businessman, not as a gambler.
MyCryptoParadise
iFeel the success🌴

ADAUSDT: Bullish Breakout Loading or Painful Trap Ahead?Yello Paradisers, are we about to witness ADAUSDT explode to the upside, or is this just the market luring in impatient traders before the real move? The current setup is looking dangerous — in a good way for those who know how to play it.
💎ADAUSDT has broken out of a descending channel and found support at the 200 EMA. On top of that, we have bullish divergence showing on both the RSI and Stoch RSI — a rare alignment that significantly increases the probability of a bullish push.
💎If ADAUSDT pulls back, it could provide entry opportunity with even better RR, while aggressive entries remain risky — especially for beginners.
💎But here’s the key: if price breaks down and closes candle below our invalidation level, the bullish outlook is completely off the table. In that case, patience will be our best weapon, waiting for cleaner price action before making any moves.
🎖Strive for consistency, not quick profits. Treat the market as a businessman, not as a gambler.
MyCryptoParadise
iFeel the success🌴

BITCOIN PREDICTION: CRITICAL UPDATE (warning) Yello Paradisers! In this video, we are going through high-timeframe, medium-timeframe, and lower-timeframe analysis. This multi-timeframe analysis is important for us to understand the whole context of the market, and that is how we are able to make the best trading decisions as professional traders.
I'm explaining to you that we are on the high-timeframe chart, trading inside of a channel ABC zigzag formation. From an Elliott Wave perspective, we are currently in the C wave, which is a motive wave, and we are creating the smaller secondary wave. We can see a bullish divergence confirmed, and we are waiting for RSI to have a successful bullish reclaim.
I'm updating you about the 0.61 Fibonacci retracement level and all of the confluences at around $116,000 and $117,000. From a medium-timeframe perspective, we are updating the Elliott Wave price action development count. I'm sharing with you the contracting triangle. The deviation that happened during the E wave, the confluence of the $116,000 and $117,000, and truly sharing with you how important this demand zone area really is.
Then we are moving our attention to low time frame analysis where I share with you the most probable price action development in the upcoming days, weeks, and months.
Paradisers! Keep in mind to trade only with a proper professional trading strategy. Wait for confirmations. Play with tactics. This is the only way you can be long-term profitable.
Remember, don’t trade without confirmations. Wait for them before creating a trade. Be disciplined, patient, and emotionally controlled. Only trade the highest probability setups with the greatest risk to reward ratio. This will ensure that you become a long-term profitable professional trader.
Don't be a gambler. Don't try to get rich quick. Make sure that your trading is professionally based on proper strategies and trade tactics.

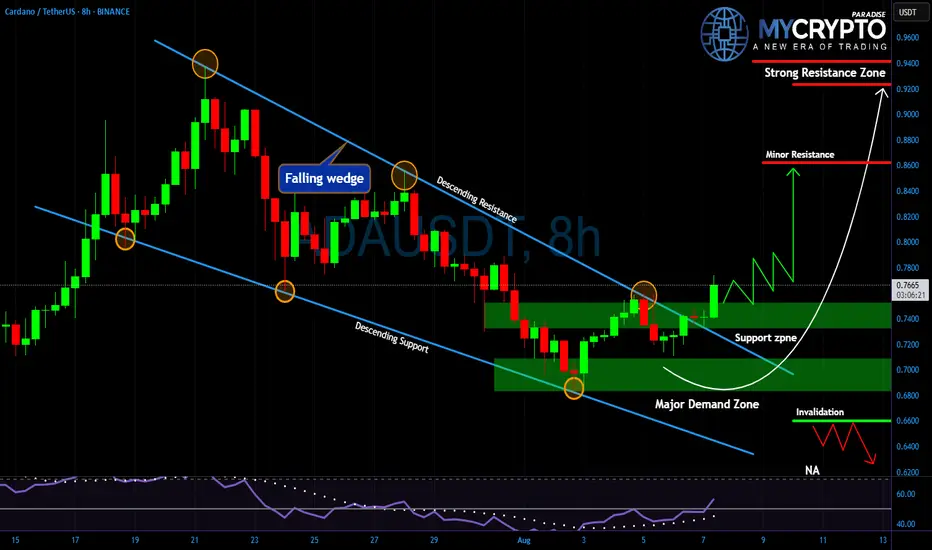
ADA Just Broke Out... But Will It Hold or Collapse From Here?Yello Paradisers, are you ready for what Cardano is about to do next? After weeks of being trapped in a falling wedge, #ADA has finally broken out and this move could either be the start of something big or just another fakeout to trap late buyers.
💎Price has now closed above the descending resistance, confirming the breakout of the falling wedge structure. The 0.7300–0.7450 zone is currently acting as the first area of support. This level needs to hold in order to maintain bullish momentum, or the entire setup could be invalidated. Below that, the major demand zone between 0.6700 and 0.7100 remains critical if #Cardano slips into that range, we’ll be watching for either a bounce or signs of a deeper breakdown.
💎On the upside, the first short-term target sits at 0.8600 where minor resistance is expected, but the real battle will take place between 0.9300 and 0.9500 a strong resistance zone where many traders will be looking to take profits or re-enter shorts. Momentum indicators are showing early strength, with RSI recovering and confirming renewed buyer interest.
💎If bulls can maintain control above the breakout zone, #ADA could enter a healthy consolidation phase before launching into the next leg up. However, a drop below 0.6600 would completely invalidate the current structure and shift the bias back to the downside so risk management remains essential here.
🎖Strive for consistency, not quick profits. Treat the market as a businessman, not as a gambler.
MyCryptoParadise
iFeel the success🌴
Will FETUSDT Trap the Bulls Before a Brutal Drop?Yello Paradisers — is FETUSDT setting up the perfect bull trap before a sharp sell-off? The current market structure suggests danger ahead, and ignoring it could be costly.
💎FETUSDT remains in a clear bearish market structure. After taking inducement, price is now moving toward a key resistance zone while following an ascending channel — a combination that typically increases the probability of a downside reversal.
💎If price reaches this resistance zone and begins showing bearish reversal patterns — such as a double top or head-and-shoulders — the odds of a strong move down will rise significantly. For aggressive traders, an early entry could be taken on a confirmed breakdown of the ascending channel, but this is not the safest play, as the risk-to-reward would be poor.
💎However, if FETUSDT breaks and closes above the invalidation level, our bearish idea will be completely off the table. In that scenario, the smarter move is to wait patiently for a fresh setup with cleaner price action before committing capital.
🎖Strive for consistency, not quick profits. Treat the market as a businessman, not as a gambler.
MyCryptoParadise
iFeel the success🌴

Is #XTZ Ready For a Major Breakout or Another Trap Ahead?Yello Paradisers! Are you prepared for what might be one of the sneakiest reversals brewing quietly on #XTZUSDT? Let's see the current setup of #Tezos:
💎#XTZ is trying to break out of a descending broadening wedge formation, a setup that typically signals the end of a corrective structure and the potential beginning of a major impulsive move. We’re likely witnessing the very first wave of this new impulse, and what happens next will depend entirely on how the price reacts to the overhead dynamic resistance.
💎The 1st impulsive wave appears to be nearing completion, and based on structure and current momentum, a minor pullback is both expected and healthy. This retracement will likely serve as a reset before the next leg higher begins, offering a potential entry for those who missed the breakout. However, we do not expect this correction to break below the origin of the first wave — doing so would undermine the integrity of the new trend.
💎Currently, the #XTZUSD is facing strong resistance from the EMA, which it must convincingly break and reclaim. This EMA level has repeatedly acted as a lid on price action, and until it’s cleared, any upside move remains tentative. However, if buyers step in with real volume, we could see a rapid acceleration toward the mid-term resistance at $0.916. That level has historically marked a shift in market control. And beyond it, the next major resistance lies at $1.134, a key supply zone that could trigger heavy distribution.
💎On the downside, the structure remains clean. The $0.491 – $0.516 zone is now our major support, and it must hold. If the price falls below this support and closes with weakness, it will invalidate the current bullish thesis and likely lead to a deeper correction.
Play it safe, respect the structure, and let the market come to you!
MyCryptoParadise
iFeel the success🌴

BITCOIN BULLS ARE GONNA DO THIS NOW!!!! (Fakeout Wick) Yello Paradisers! In this video, I've been updating Bitcoin price action and the Elliot Wave theory. I've been doing lots of advanced technical stuff. We've been going through channeling and updating ourselves about the most important support and resistance levels. We've been taking a look at the MACD histogram, the RSI, and the stochastic RSI. We've been professionally analyzing the volume; we've understood who is in power right now and what's going to happen next with the highest probability.
We've also been taking a look at what kind of confirmations we are waiting for in order for us to be able to open long or short positions.
Paradisers, make sure that you are trading with a professional trading strategy. Wait for confirmations, play tactically, and focus on long-term profitability, not on getting rich quick.
Remember, don’t trade without confirmations. Wait for them before creating a trade. Be disciplined, patient, and emotionally controlled. Only trade the highest probability setups with the greatest risk to reward ratio. This will ensure that you become a long-term profitable professional trader.
Don't be a gambler. Don't try to get rich quick. Make sure that your trading is professionally based on proper strategies and trade tactics.

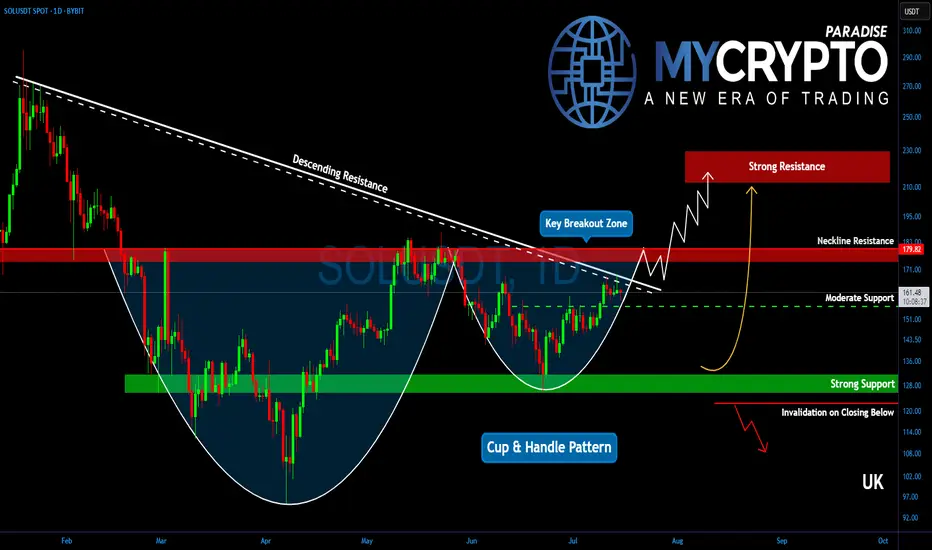
Will Solana Explode? This Important Zone Could Trigger a MoveYello, Paradisers! Is #Solana about to break free into a new bullish wave? After months of struggling under key resistance, the bulls are finally making a serious push… but only one zone stands between SOL and a potential explosion.
💎After peaking in January, Solana has remained suppressed under a descending trendline. But now, that trendline is being challenged aggressively, and the price structure is starting to form a reversal pattern that demands attention.
💎Right now, the most important level on the chart is the descending channel resistance at $167. Bulls are actively testing this zone, and if they manage to flip it into support, it could trigger a significant shift in momentum. But just above, at $180, sits an even more critical barrier, the neckline of the current reversal pattern. This entire region between $167 and $180 is the true battleground.
💎#SOLUSDT's confirmed breakout above $180 would be a major technical signal. It would likely send Solana toward the $210 to $225 zone, which marks a significant resistance area. This isn’t just psychological; it also aligns with the 61.8% Fibonacci retracement, a level where institutional players often begin offloading positions
💎As for the downside, support remains solid between $155 and $160. This region is protected by both horizontal demand and dynamic support from key moving averages, offering bulls a stable base to defend. Adding to the bullish case is a potential golden cross formation between the EMA-50 and EMA-200, a signal that, if confirmed, could inject even more confidence into Solana’s price action.
Paradisers, strive for consistency, not quick profits. Treat the market as a businessman, not as a gambler.
MyCryptoParadise
iFeel the success🌴
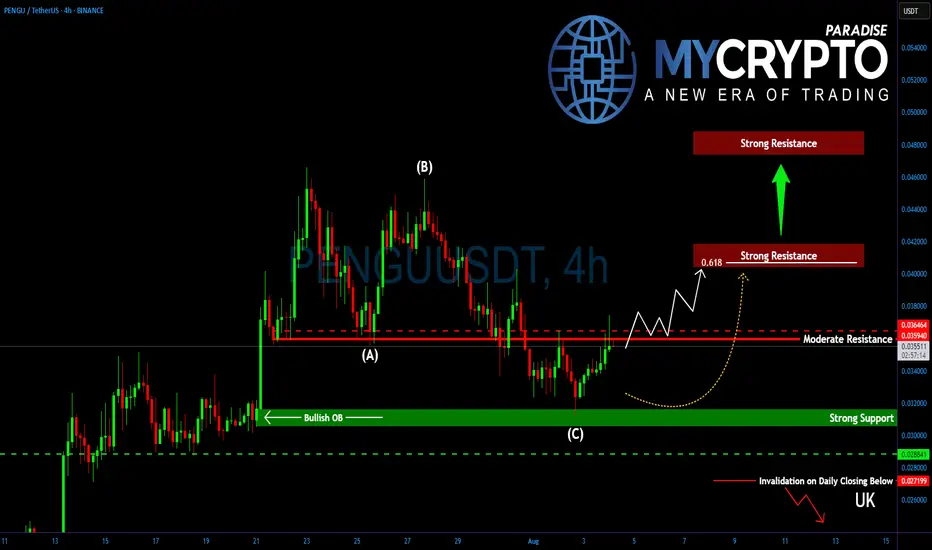
Is PENGU About to Explode or Fake Out Everyone Again?Yello, Paradisers! Have you been watching #PENGUUSDT after its recent dip? Because if you haven’t, you might be missing out on a potentially explosive setup forming right now…
💎After placing a major high around $0.0460, PENGU entered a textbook ABC corrective wave. But that correction looks to be over now, and what’s emerging could be the beginning of a powerful bottoming structure.
💎#PENGU is currently facing a critical short-term resistance at $0.0360–$0.0364, a level that bulls must flip to ignite a stronger recovery. If they succeed, all eyes shift toward the 61.8% Fibonacci retracement at $0.0405, a major confluence level that aligns with a key horizontal resistance between $0.0405 and $0.0415. Expect heavy action here. Bulls will likely face real pressure at this zone.
💎However, and this is where it gets interesting, if PENGU breaks above $0.0415 with strength, then momentum could pick up fast, paving the way for a fresh rally towards new yearly highs between $0.0480–$0.0494.
💎On the flip side, support remains solid between $0.0312 and $0.0302. This zone isn’t just an ordinary support, it also holds a bullish order block (OB), offering extra protection and confluence. This is where the market is quietly showing signs of strength while the majority are distracted elsewhere.
Paradisers, strive for consistency, not quick profits. Treat the market as a businessman, not as a gambler.
MyCryptoParadise
iFeel the success🌴
BITCOIN PREDICTION: THIS FIBONACCI SPIRAL WILL BLOW YOUR MIND!! Yello Paradisers! I've revealed to you the secret Fibonacci spiral target. We have been going through multi-timeframe analysis as professional traders. We have been going through the high timeframe chart. We have understood that we are trading inside of that ABC zigzag. Right now, we are in the C wave and we are creating the five moves that are upside. That might take us towards $135,000.
We are right now in the first wave of that fifth wave. We are having bullish divergences on the high timeframe chart. All important indicators like stochastic RSI, RSI, and MACD are having bullish signs, and we have successfully reclaimed the volume profile point of control from resistance into support.
Then, we are turning our focus on the medium timeframe. We are again going through the Elliot wave. We are taking a look at the contracting triangle; the deviation there happened, we are seeing the bullish divergence, and we are updating the Fibonacci spiral. Then we are moving our focus to the low timeframe where we are concluding the Elliot wave count of smaller waves and understanding that the fifth one might be extended.
Paradisers! Keep in mind to trade only with a proper professional trading strategy. Wait for confirmations. Play with tactics. This is the only way you can be long-term profitable.
Remember, don’t trade without confirmations. Wait for them before creating a trade. Be disciplined, patient, and emotionally controlled. Only trade the highest probability setups with the greatest risk to reward ratio. This will ensure that you become a long-term profitable professional trader.
Don't be a gambler. Don't try to get rich quick. Make sure that your trading is professionally based on proper strategies and trade tactics.

#ONDO Ready to Make a Bullish Move | Must Watch For BullsYello, Paradisers! Is #ONDO getting ready for a powerful breakout, or are we about to witness yet another bull trap? Let’s break down the real picture on #ONDOUSDT:
💎After steadily climbing inside an ascending wedge, #ONDOUSD is now pressing against a key resistance area around $1.05–$1.07. A breakout above this zone would significantly boost the probability of a bullish continuation, especially with the 50EMA providing underlying support.
💎The immediate support zone to watch is between $0.84–$0.85, aligning with the lower boundary of the channel and overlapping with a visible demand area. This is where we expect buyers to defend the trend if any pullback occurs.
💎If bulls manage to hold this zone and break through the current resistance, our next upside target is the moderate resistance level at $1.34. From there, the strong resistance sits at $1.72, which will be the key decision point for any further upside momentum.
💎On the flip side, a breakdown below $0.72, our bullish invalidation level, would nullify this setup entirely and open the door for a deeper drop, where sellers are likely to step in aggressively.
Stay patient, Paradisers. Let the breakout confirm, and only then do we strike with conviction.
MyCryptoParadise
iFeel the success🌴

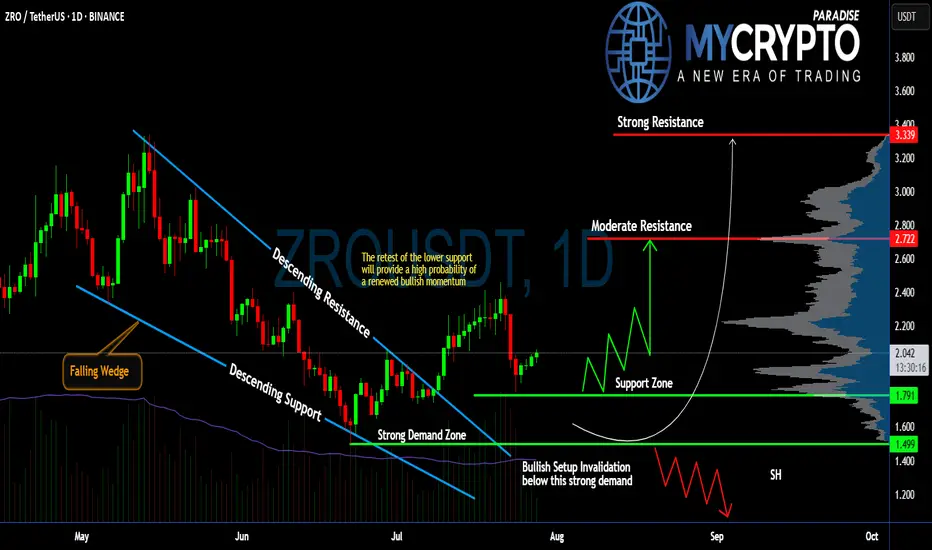
Will #ZRO Continue to Climb or Not? Must Watch For BullsYello, Paradisers! Are we witnessing the beginning of a powerful bullish reversal on #ZROUSDT, or is this just a fakeout setup? Let’s dissect this setup of #LayerZero:
💎After weeks of consistent bleeding, #ZRO has printed a classic falling wedge pattern, often a precursor to bullish reversals. This wedge has now been broken to the upside, with price currently trading around $2.037, suggesting renewed buyer interest following the breakout from descending resistance.
💎What’s crucial here is the retest of the wedge’s descending support, which aligns perfectly with a strong demand zone between $1.499 and $1.791. As long as #ZROUSD respects this zone, the probability of a bullish continuation remains high. This zone also serves as a clear invalidator for the setup—if price closes below $1.499, the bullish thesis will be off the table.
💎From here, if bulls can maintain control, we’re eyeing a potential move toward the moderate resistance at $2.722. That’s the first real hurdle where profit-taking or short interest could spike. A clean break above that level would open the path to the strong resistance around $3.339, where a heavy supply zone is likely to cap further upside.
💎Until then, we expect a series of zigzag corrections above the support zone before any sustained push higher. However, be cautious, losing the $1.499 support turns the structure bearish and could drag the price toward the $1.20 region, or lower.
Stay patient, Paradisers. Let the breakout confirm, and only then do we strike with conviction.
MyCryptoParadise
iFeel the success🌴