QBTS mid-term TAD-wave is in consolidation phase with some bullish volumes accumulation ongoing, it's not fully bullish setup yet but it's improving. The long-term uptrend remains intact and there's a good chance for the mid-term uptrend continuation.
N-WAVE

Gold - Counting the WavesThe gold chart is highly technical, and its structure can be broken down into both smaller and larger wave formations.
Since late October 2022, gold has completed a classic five-wave advance.
Looking ahead, this is not the full extent of the long-term move — gold still has room to grow.
However, before that, the market needs to correct the upward structure that has already been formed.
First, we need to correct the fifth wave. This process has already begun, and price should dip once more below the 3,900 level.
After that, the entire five-wave structure will also require a broader correction
---
Please subscribe and leave a comment.
You’ll get new information faster than anyone else.
---

CAD/JPY: Bullish Continuation Setup - Buy Above 111.33The CAD/JPY pair has completed a bullish wave structure and is now showing a healthy pullback, creating a high-probability continuation setup.
WAVE STRUCTURE ANALYSIS:
✅ Completed bullish wave formation
✅ Pullback has traded below Structure 4
✅ Continuation remains valid above Structure 2 (110.96)
TRADE SETUP:
📍 Entry: Buy above 111.33 (signals uptrend resumption)
🛑 Stop Loss: 110.96 (Structure 2 invalidation point)
🎯 Target 1: 112.46 (Fibonacci key ratio projection)
🎯 Target 2: 112.97 (Extended Fibonacci target)
FIBONACCI ANALYSIS:
Using key ratio Fibonacci measurement from the complete wave structure low to high, we've identified clear target zones for profit-taking.
RISK MANAGEMENT:
Price must hold above 110.96 for bullish bias to remain valid
Entry above 111.33 confirms momentum resumption
KEY LEVELS TO WATCH:
📌 Critical Support: 110.96
📌 Entry Trigger: 111.33
📌 Resistance 1: 112.46
📌 Resistance 2: 112.97
METHODOLOGY: WavesOfSuccess Price Behaviour Analysis

Hellena | EUR/USD (4H): SHORT to the MIN of wave "3" 1.14647.We continue to monitor the decline in downward momentum. In the last forecast the target was almost reached, but the correction turned out to be stronger than we thought, which does not cancel the forecast, but just gives us an opportunity to enter a short position once again quite favorably.
I expect that the small wave “b” is either over or almost over and the price is about to start its decline to the support area at 1.14647.
This movement should be a confirmation of the completion of the large correction (red) “ABC”.
Manage your capital correctly and competently! Only enter trades based on reliable patterns!

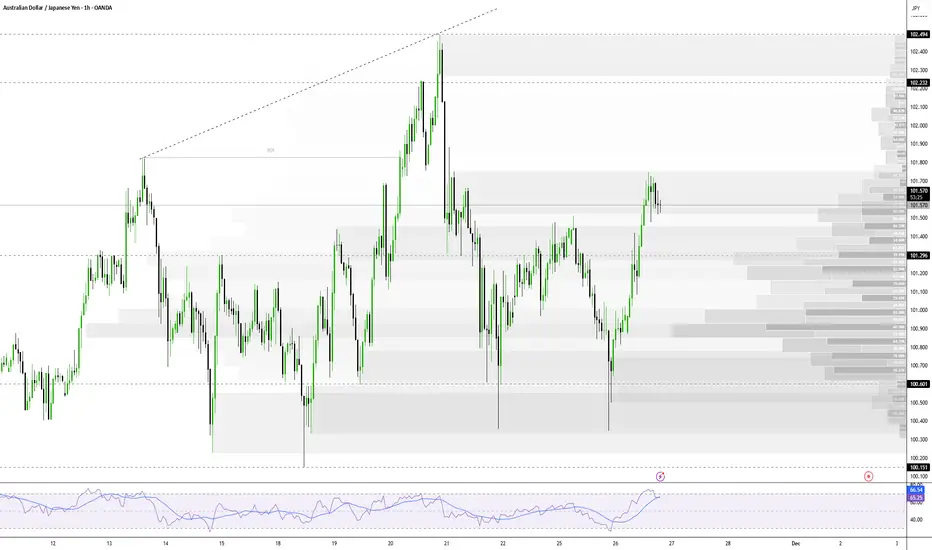
AUD/JPY | Bullish Momentum After Australian CPI Data ReleaseThe AUD/JPY pair gained a strong bullish boost after higher-than-expected Australian consumer inflation data, which dampened speculation of an interest rate cut by the Reserve Bank of Australia (RBA). Currently, the price is at a new weekly high and awaits confirmation of a breakout.
1. Market Fundamental Factors (Drivers of the Upside)
Higher Australian Inflation: The hotter (higher) Australian consumer inflation figures dampened market bets for further interest rate cuts by the RBA.
Impact: This significantly boosted the Australian Dollar (AUD), lifting the AUD/JPY pair to the 101.70 area (a new weekly high).
2. Technical Analysis and Indicators
Long-Term Bias: The 100-day Simple Moving Average (SMA) is rising steadily, and the price is holding above it, reinforcing the bullish bias.
Trend Conditions: Trend conditions will remain favorable as long as the price is above the rising SMA, which is currently below 98.00.
3. Bullish Scenario ⬆️
Strong Upside Trigger: Bulls await a breakout through the nearly three-week-old trading range (currently around 101.70). A decisive MACD push into positive territory would strengthen this case.
Next Target: A move will head towards the 102.45-102.50 region, or the highest level since July 2024, touched last week.
4. Bearish Scenario ⬇️
Initial Key Support: Weakness below the 101.40 area is likely to find decent support near the 101.00 round number.
Trading Range Support: A break below 101.00 could retest the trading range support around the 100.40-100.35 region.
Bias Reversal: A convincing break below 100.35 could trigger technical selling and drag the price below the psychological 100.00 mark, towards the next relevant support near the 99.65 - 99.60 region.
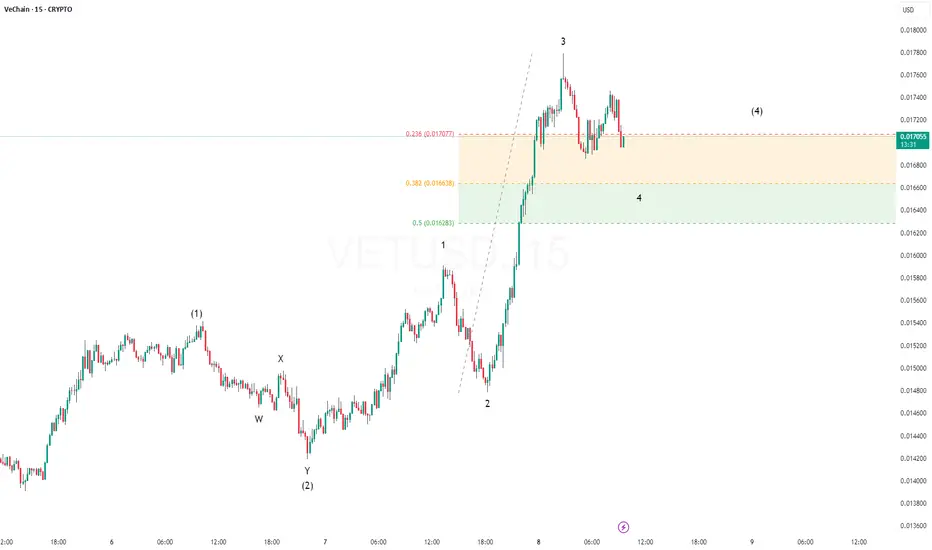
4th wave correction on going 5th to comestill a little possible upside in minor wave 4 then expecting minor wave 5, then wave 4 and wave 5 again to finish the uptrend
also minor wave 4 can be a flat or a triangle
US100: Breakout signals a strong second bullish leg🧩 Market Context
On the 30-minute chart, SKILLING:US100 index shows renewed bullish momentum after a phase of sideways consolidation. Following a deep correction, price action has started forming higher highs and higher lows, suggesting that buyers are gradually regaining control.
🔍 Price Structure and Breakout
Price has recently broken out above a short-term consolidation zone and a rising trendline.
This breakout reinforces the short-term bullish bias and could mark the start of a second upward leg in the current recovery.
Statistically, when a breakout happens after tight accumulation, the next bullish leg often becomes equal to or larger than the previous one, as momentum builds and buyers gain confidence.
📈 Key Price Levels
• Resistance 1: 24,914 – prior rejection zone in the last upward move.
• Resistance 2: 25,074 – distribution area before the previous drop.
• Support: 24,700 – 24,750 (former resistance now acting as potential support).
⚙️ Trading Scenarios (for observation only)
• After the breakout, price may retest the previous resistance zone (around 24,700–24,750) before continuing higher.
• If buyers defend this level, the second bullish leg could extend toward 24,914 and possibly 25,074.
• Conversely, a close back below 24,700 may trigger a deeper pullback before any continuation attempt.
🧠 Summary
The technical structure on US100 favors a short-term bullish outlook. A successful retest of the breakout zone could pave the way for a second upward leg, potentially matching or exceeding the size of the previous rally.
______________________________________
📌 This analysis is for educational and technical purposes only. It does not constitute financial advice or a recommendation to buy or sell any asset.
Please like and comment below to support our traders. Your reactions will motivate us to do more analysis in the future 🙏✨
Harry Andrew @ ZuperView

LiamTrading – Risk of adjustment before hitting the $4000 mark?LiamTrading – GOLD: Risk of adjustment before hitting the $4000 mark? ⚠️
Hello everyone,
Gold is approaching the psychological price zone of $4000/oz, but before reaching this historic milestone, the market may be preparing for a short-term adjustment.
According to Bank of America's technical strategist – Paul Ciana, gold's upward momentum is “overheated,” and a mid-cycle adjustment may occur soon.
📉 Technical Analysis (Chart H1 – Wolfe Waves Formation)
Observing the chart, a Wolfe Waves pattern is clearly forming:
The Sell zone 3988–3990 is the convergence point of wave number 5 – a potential short-term reversal area.
The Buy zone 3963–3965 is a local support retest point, where sellers tend to take short-term profits.
The Wolfe trendline indicates that the price may take liquidity above the peak area before a corrective drop appears.
If an adjustment occurs, the 3940–3955 area will be the first reaction zone, where strong buying support is present.
🎯 Trading Scenario
Buy retest:
📍 3963–3965
🛑 SL: 3960
🎯 TP: 3972 – 3985 – 4000
Sell following Wolfe waves:
📍 3988–3990
🛑 SL: 3995
🎯 TP: 3972 – 3955 – 3945
🧭 Medium-term Outlook
Although the upward trend remains dominant, momentum is gradually decreasing, and the market needs to “cool down” to create a new accumulation phase.
Dense liquidity zones around POC 3957–3960 may trigger a short-term pullback before gold gains momentum towards the ATH $4000 zone in the late-week sessions.
📌 Conclusion
Gold remains in a medium-term uptrend, but a short adjustment is necessary to maintain a sustainable upward structure.
Traders should prioritize flexible scalping, observing reactions at Fibo – Volume Profile zones – and especially the developing Wolfe Waves pattern.
I will continue to update the latest scenario details for XAUUSD daily.
👉 Follow me to not miss important wave movements!

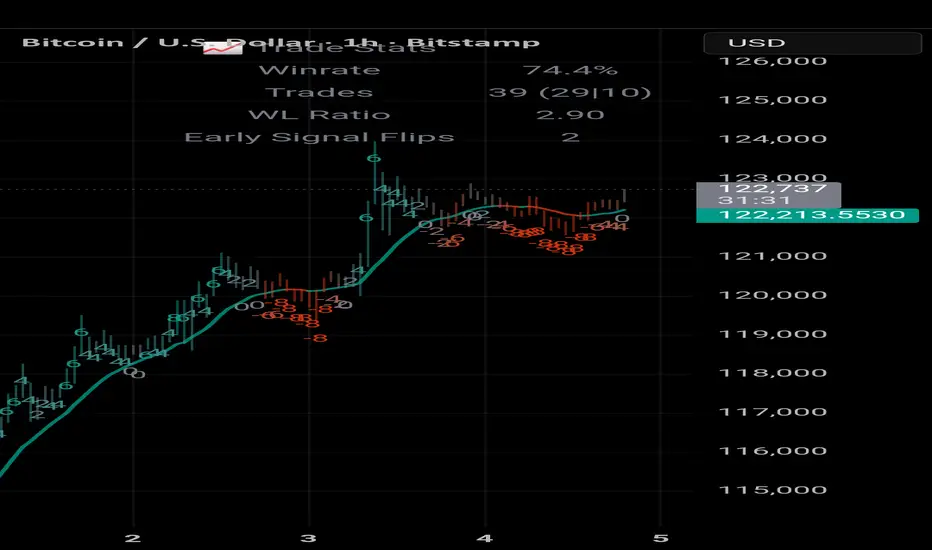
Update on my purchase of bitcoinMy super AI program gave me a buy signal last week on ##Bitcoin.
I was planning on staying out. But it has been so accurate I am not legally allowed to tell anyone.
Checking the price it was $1235000.
I am just following my signals.
Long AplleJust Buy / This is new wave .
According to the chart we are in a new Rally.
so clear to goal.

QNT AWAKENED! Elliott Wave Analysis! Zoom into LTFs. Bullish!!4 hour TF shows QNT making good progress towards the 1st wave in teal. As shown in the image included with this post, we have recently finished a wave 4 running triangle correction to the downside. Next, wave 5 should press onwards, if my wave 5 extends beyond $106.82 / the red 1:1 fib ratio of wave 3, it will invalidate this leg of the impulse and i will have to rework the wave count on this 3rd wave in aqua green color.

#GOLD #NEW_forcast #XAUUSD#XAUUSD pulled back hitting the 3790 resistance but continues to respect the upward trend line and channel structure.

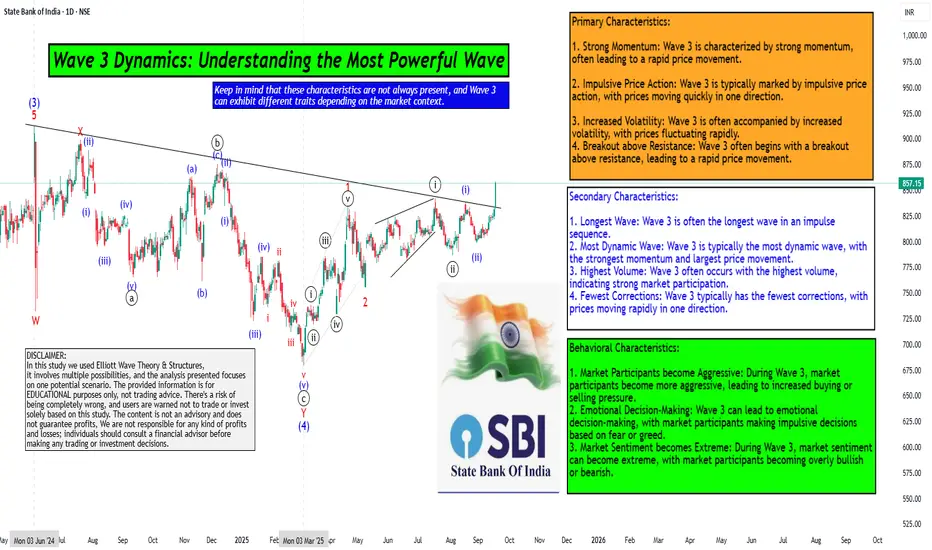
Wave 3 Dynamics: Understanding the Most Powerful WaveHello Friends, Welcome to RK_Chaarts,
For Learning and Practicing chart Analyzing, Today we are trying to Analyse the State Bank of India (SBIN) chart from an Elliott Wave perspective, we can see that the intermediate-degree Wave (3) completed at the June 2024 high. This was followed by a complex correction that ended at the March 2025 low, marking the completion of Wave (4).
We are currently unfolding Wave (5), which will complete the higher-degree Wave ((3)) of Primary degree in black. Within Wave (5), we have five minor-degree subdivisions, which we can see unfolding.
The first minor-degree Wave 1 completed at the 22nd April 2025 high, followed by a Wave 2 correction that ended at the May 9, 2025 low. We are currently in Wave 3, which is a dynamic wave with strong momentum.
Within Wave 3, we have five minute-degree subdivisions, which are unfolding. The first two subdivisions are complete, and we are currently in the third subdivision.
The characteristics of Wave ((iii)) of 3 are evident in the price action, with a strong breakout above the resistance trend line and good intensity of volumes. The Moving Convergence Divergence (MACD) is also positive, and the Relative Strength Index (RSI) is above 60, indicating strong momentum.
The daily Exponential moving averages (50 and 200) are also aligned in favor of the trend. All these parameters support our view, and we can see an inverted head-and-shoulders pattern or a double rounding bottom pattern unfolding.
Overall, the breakout looks promising, and we can expect further upside in SBIN as per Elliott wave theory.
Detailed wave counts on chart
Primary Characteristics:
1. Strong Momentum: Wave 3 is characterized by strong momentum, often leading to a rapid price movement.
2. Impulsive Price Action: Wave 3 is typically marked by impulsive price action, with prices moving quickly in one direction.
3. Increased Volatility: Wave 3 is often accompanied by increased volatility, with prices fluctuating rapidly.
4. Breakout above Resistance: Wave 3 often begins with a breakout above resistance, leading to a rapid price movement.
Secondary Characteristics:
1. Longest Wave: Wave 3 is often the longest wave in an impulse sequence.
2. Most Dynamic Wave: Wave 3 is typically the most dynamic wave, with the strongest momentum and largest price movement.
3. Highest Volume: Wave 3 often occurs with the highest volume, indicating strong market participation.
4. Fewest Corrections: Wave 3 typically has the fewest corrections, with prices moving rapidly in one direction.
Behavioral Characteristics:
1. Market Participants become Aggressive: During Wave 3, market participants become more aggressive, leading to increased buying or selling pressure.
2. Emotional Decision-Making: Wave 3 can lead to emotional decision-making, with market participants making impulsive decisions based on fear or greed.
3. Market Sentiment becomes Extreme: During Wave 3, market sentiment can become extreme, with market participants becoming overly bullish or bearish.
Keep in mind that these characteristics are not always present, and Wave 3 can exhibit different traits depending on the market context.
Here are some snapshots shared below to understand the concept & example
Largest wave among wave 1-3-5
Strong Momentum like 90 degree move, Vertical move, Rapid move & Dynamic move
Breakout with good volumes
Price trading above 50, 100 & 200 Day Exponential Moving Average
RSI Breakout on Daily
RSI Breakout on Weekly
MACD weekly
MACD Daily
Pattern Repeating
I am not Sebi registered analyst. My studies are for educational purpose only.
Please Consult your financial advisor before trading or investing.
I am not responsible for any kinds of your profits and your losses.
Most investors treat trading as a hobby because they have a full-time job doing something else.
However, If you treat trading like a business, it will pay you like a business.
If you treat like a hobby, hobbies don't pay, they cost you...!
Hope this post is helpful to community
Thanks
RK💕
Disclaimer and Risk Warning.
The analysis and discussion provided on in.tradingview.com is intended for educational purposes only and should not be relied upon for trading decisions. RK_Chaarts is not an investment adviser and the information provided here should not be taken as professional investment advice. Before buying or selling any investments, securities, or precious metals, it is recommended that you conduct your own due diligence. RK_Chaarts does not share in your profits and will not take responsibility for any losses you may incur. So Please Consult your financial advisor before trading or investing.
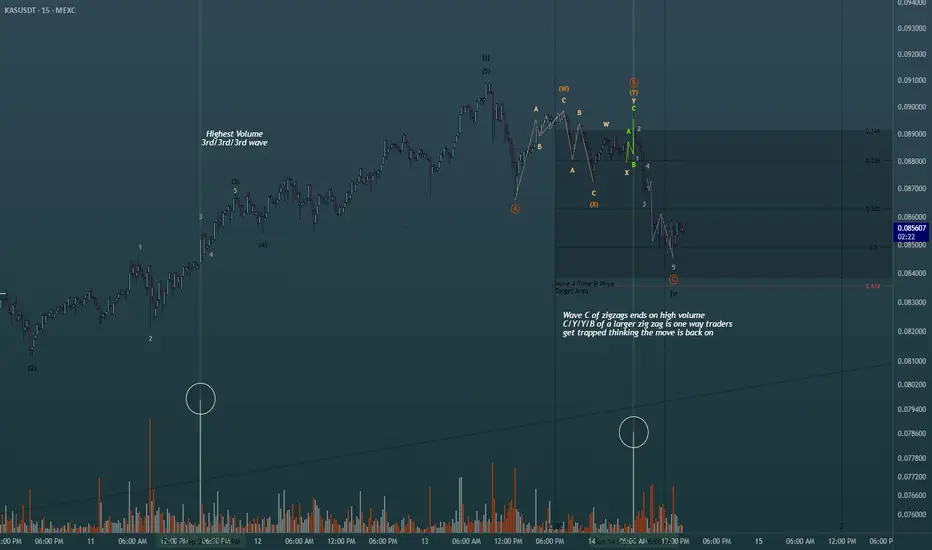
Using simple volume for added confluence in Elliott Wave Theory!Shown on the chart is 2 of the ways you can use the highest volume spikes on the chart to find out where you are in the wave count. Easiest way is to find the highest volume with the steepest slope of trend to label as your third wave. Same concept whether its bearish bars printing or bullish bars. The highest volume shown is actually part of the retracement, albeit in one of the actionary waves (moving with trend), alot of buying happened at the termination of the wave C of the zig zag shown in green. Perfect scenario to rake in buy orders from retail then dump on them to finish out the WXY pattern. This is just 2 of the many scenarios in which you can find help from the volume oscillator to give you a directional bias in Elliott Waves. Happy Trading
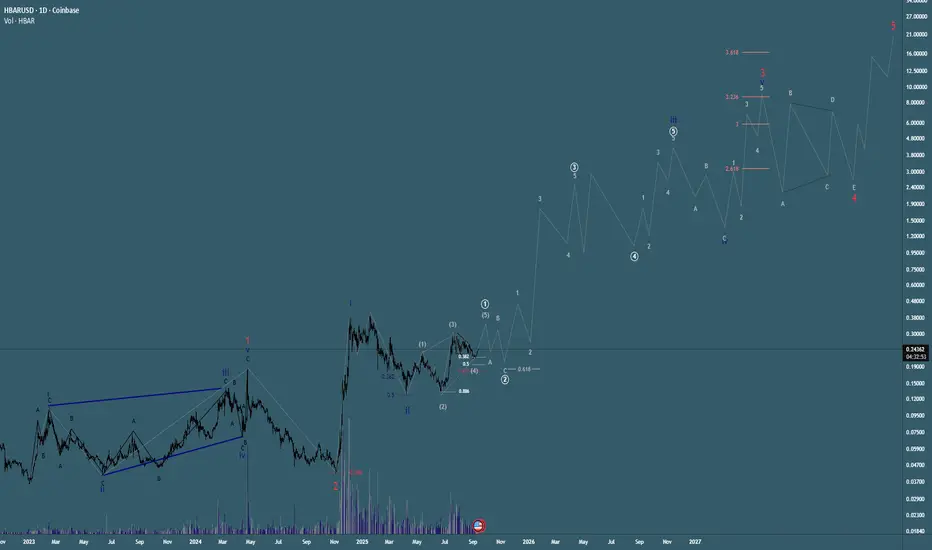
HTF Elliott Wave Count on HBAR! Super Bullish!!Here is the macro bullish outlook on HBAR using the Elliott Wave Theory. Currently we are making progress to the upside to complete the grey wave 5 to finish the leading diagonal in white. Next expect a retracement between .21 (extreme of wave 4) - .18 (.618 of diagonal), it could retrace deeper as is common with a wave 2, although the extreme bullish nature of this impulsive structure makes me think it could be a shallow retracement (38.2% - 50%) before blasting off on everyone looking for their entry to be hit. Exciting times ahead for HBAR i believe. Happy Trading
TAO triple 1,2 impulse to the upside!Super bullish pattern forming in this bullish scenario on TAO. HTF 1,2 in black finished with a deep retracement. Second 1,2 in light blue finished with a retracement to the 0.5. The third micro 1,2 in green finished with a deep retracement to .886 Fib. Since then we chopped around the bottom with our LTF lower degree 1,2 structures to form the base of the extended wave 3 thats coming (or here now!). It could be counted as such that this wave 3 has already formed its own double 1,2 structure which gives more confluence to a massive rally. Several alts are showing similar patterns. Is alt season yet? xD Happy Trading

USDJPY STRONG SIGNAL FOR BUYINGThe price face buying pressure
and it want to form head and shoulder
and it now on second shoulder
and reflect from order block and support so i think in buying

BTC Elliott Wave medium term analysisCRYPTOCAP:BTC is still consolidating, as shown on the charts.
The structure is shaping up like a classic Elliott Wave 1–2–3–4–5 pattern, with the 4th wave now in play.
This could mean another retest of $110,500 before launching into the final, larger 5th wave 🚀.
The 4th wave might present a solid long entry opportunity heading into the 5th.
📊 DYOR – trade safe.

BTC ready to DUMPAre you ready for Bitcoin Dump ?
As you can see, BTC break the lower band of channel and finished it's pullback to it.
Not it's ready to go Down

$BTC Eliot Wave last step + Golden cross.The entire crypto market is on fire — Golden Crosses everywhere across altcoins. 🔥
BTC looks to be in the 5th wave of an Elliott Wave pattern and has just printed its own Golden Cross. Bullish momentum is clear in the price action.
But how long can this run last?
We may be in a parabolic phase, yet there’s heavy liquidity sitting around $115k.
The logical play: a drop to grab that liquidity, then a push to $120k+.
In the end… only the market makers know. 🎯
DYOR

bulish on gold 3389currently no momentom downward.
breakout 3315 more potential riding on sell mode.

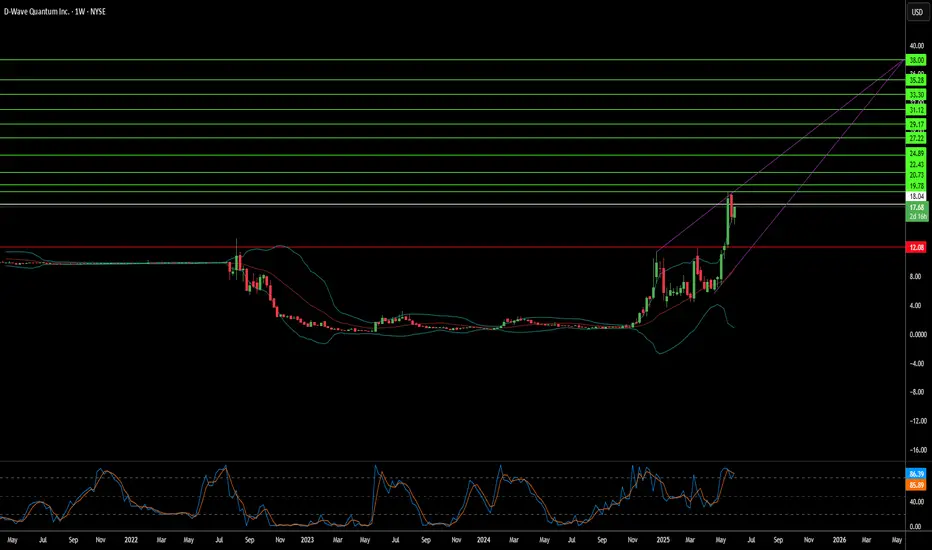
Beyond Bits: Is D-Wave Quantum the Unseen Power?D-Wave Quantum is rapidly solidifying its position as a transformative force in the burgeoning field of quantum computing. The company recently achieved a significant milestone with its Advantage2 system, demonstrating "beyond-classical computation." This breakthrough involved solving a complex simulation problem for magnetic materials in minutes, a task that would have required nearly a million years and the equivalent of the world's annual electricity consumption from the most powerful classical supercomputers. This distinct achievement, rooted in D-Wave's specialized quantum annealing approach, sets it apart from other industry players, including Google, which primarily focuses on gate-model quantum architectures.
D-Wave's unique technological focus translates into a formidable commercial advantage. It stands as the sole provider of commercially available quantum computers, which excel at solving intricate optimization problems—a substantial segment of the overall quantum computing market. While competitors grapple with the long-term development of universal gate-model systems, D-Wave's annealing technology delivers immediate, practical applications. This strategic differentiation allows D-Wave to capture and expand its market share within an industry poised for exponential growth.
Beyond its commercial prowess, D-Wave plays a critical role in national security. The company maintains deep ties with elite U.S. national security entities, notably through its backing by In-Q-Tel, the CIA's venture capital arm. Recent installations, such as the Advantage2 system at Davidson Technologies for defense applications, underscore D-Wave's strategic importance in addressing complex national security challenges. Despite its groundbreaking technology and strategic partnerships, D-Wave's stock experiences considerable volatility. This reflects both the speculative nature of a nascent, complex industry and potential market manipulations by investment houses with conflicting interests, highlighting the intricate dynamics surrounding disruptive technological advancements.
Hellena | GOLD (4H): LONG to resistance area of 3439.37.Colleagues, Last time, I suggested that the five-wave movement was not yet complete. It seems that this is indeed the case.
Wave "5" of the higher degree is unfolding, and I expect the price to reach the resistance area around 3439.37, which marks the top of wave "X".
Within the smaller five-wave structure, I believe wave "3" is currently in progress.
A correction toward the 3248.38 area is possible.
Manage your capital correctly and competently! Only enter trades based on reliable patterns!
