From Stocks to BTC. How Rotation Is Funding the Next Leg Higher📉 Stocks Look Tired
The S&P 500 and Nasdaq are both rolling over.
Daily candles show rejection and lower momentum, while Nasdaq makes lower lows, signaling that stock indices are losing strength and upside is fading for now.
When this happens, capital often rotates out of broad equities, not just out of tech, and looks for a new place where the upside is cleaner and the narrative is stronger.
📈 Why Capital Is Rotating Into Bitcoin
Bitcoin is pushing into resistance with a clear series of higher lows and an attempted breakout.
This suggests that while stocks stall, BTC is still attracting fresh demand and becoming the next main risk‑on vehicle.
Fundamental reasons support this shift:
- ETF and institutional flows are building a structural bid under Bitcoin, absorbing supply on pullbacks.
- In a world of policy uncertainty and long‑term inflation risk, investors see BTC as digital hard money and a diversification away from traditional equity exposure.
So when stock exposure feels crowded and fragile, rotating some capital into Bitcoin offers a different return profile with strong macro and structural narratives.
🔁 Where Rotation Can Go After BTC
Rotation usually doesn’t stop at BTC:
1. Stocks → Bitcoin: first leg, equities weaken while BTC pushes higher.
2. Bitcoin → large‑cap crypto: once BTC breaks out and trends, flows often spread into ETH and other major L1s/L2s.
3. Majors → high‑beta alts: later in the cycle, liquidity and risk appetite spill into DeFi, infrastructure, and narrative‑driven altcoins.
If stocks correct enough and macro fears ease later, some of that capital can eventually rotate back into undervalued equities, but only after the crypto leg has matured.
🎯 Simple Trading Framing
- Broad stocks are weakening, suggesting reduced reward for new equity risk here.
- BTC is the current recipient of rotation, backed by ETF flows, post‑halving supply dynamics, and the “digital hard asset” narrative.
- After a confirmed BTC leg higher, watch for the next rotation wave into ETH and large‑cap alts, then into selected higher‑beta sectors as the cycle extends.
Nasdaq

USNAS100 | Breakout vs Correction ZoneUSNAS100 | Overview
The price pushed higher from the support zone and the broader structure remains bullish.
However, while trading below 25720, the market may experience a short-term bearish correction toward 25500.
A confirmed 1H candle close above 25835 will reactivate bullish momentum, opening the way toward 26170.
Market Structure
Below 25720: Short-term bearish/corrective move toward 25500
Above 25835: Bullish continuation toward 26170
Key Levels
Pivot Line: 25720
Resistance: 25835 – 25985 – 26170
Support: 25510 – 25370 – 25250

Nasdaq crashes but recovering: Buy the dip or sell the break?The NASDAQ has taken a serious hit, dropping 1.6% to test 25,280 after failing to break the double top at 25,900. The market is caught in a crossfire of 25% AI chip tariffs, China export bans, and tensions in Iran. But technically, we might be forming an ascending triangle that suggests a breakout to 27,500 is still possible.
Read as we analyse the clash between bearish headlines—US-China escalation and the Iran crisis—and bullish technicals. We break down the ascending triangle pattern with higher lows at 23,860, 24,660, and now 25,170, and explain why the 50 RSI reset on the daily chart could signal a perfect "buy the dip" opportunity.
Key topics covered:
Trade war escalation: How 25% tariffs on AI chips and China’s retaliatory bans on dual-use items and cybersecurity companies are hitting tech giants.
Iran tensions: The impact of Trump's remarks and their effect on investor confidence and "risk-off" sentiment.
Technical setup: The critical ascending triangle formation. A hold at 25,200 keeps the bullish bias alive for a measured move to 27,500 (100% Fib extension).
Two scenarios:
Bullish : De-escalation in Iran/trade war + triangle hold = breakout to 26,500 and 27,500.
Bearish : Escalation + break below 25,200 = failure of the triangle, targeting 24,650 and lower.
Are you buying the triangle dip or shorting the double top? Let us know in the comments!
This content is not directed to residents of the EU or UK. Any opinions, news, research, analyses, prices or other information contained on this website is provided as general market commentary and does not constitute investment advice. ThinkMarkets will not accept liability for any loss or damage including, without limitation, to any loss of profit which may arise directly or indirectly from use of or reliance on such information.

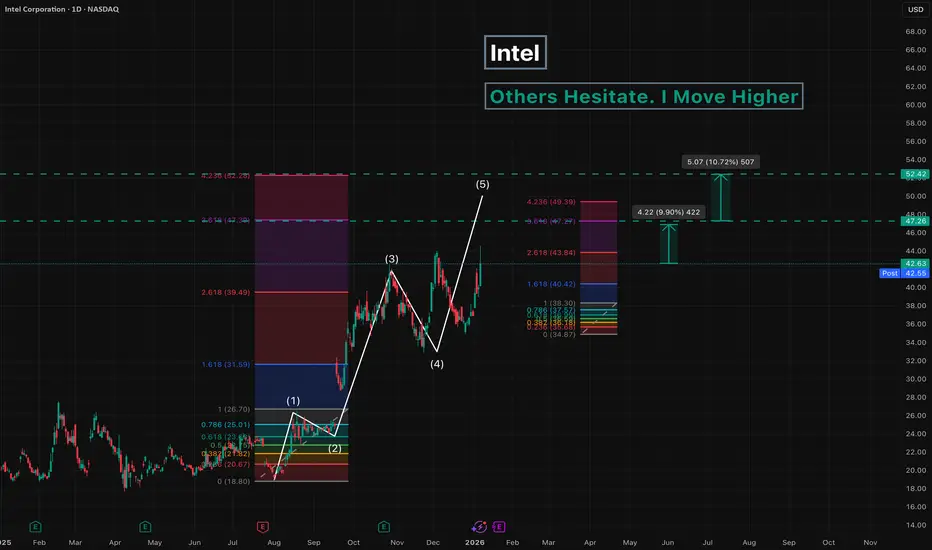
Intel - Others Hesitate. I Move HigherSince August 2025, Intel has been in an uptrend.
Only the final fifth wave remains to be completed.
The upside potential is estimated at 10-23% .
Key targets:
47
52
---
Please subscribe and leave a comment.
You’ll get new information faster than anyone else.
---
US100 Short From Resistance!
HI,Traders !
#US100 made a retest
Of the horizontal resistance
Of 25725.0 from where we
Are already seeing a local
Bearish reaction so a further
Move down is to be expected !
Comment and subscribe to help us grow !

NQ / NASDAQ / US100 | 15m | LongFundamentals Context
Upcoming News: PPI Nov delayed release tomorrow (exp soft after CPI core miss), Fed speakers (sticky inflation watch).
Impacted News: CPI core undershoot (2.6% YoY) eased rate pressure short-term → supports risk-on / growth/tech rotation.
Geopolitical: US Venezuela/Iran + EU-China tensions still in background, but no new escalation tonight → less immediate risk-off.
Economic: US growth resilient (1.8–2.0% 2026 est.) + debt cycle/fiscal stimulus favors AI/tech over defensives longer-term.
Why Long Makes Sense Now
The 25,500 break is a clean technical signal—former resistance flipped to support, momentum indicators turning up, and CPI relief still in play.
Short-term risk-reward skewed positive: if holds 25,500, upside to 26,000+ (range top) is ~200–400 points with tight stop below flip zone.
Downside risk: If fails and re-enters range hard (drops below 25,400–25,500), invalidates long—quick exit, no big damage.
Overall: Good spot for tactical long if you took it—trail stops (move to breakeven at +100 points, then trail on 1H MA20 or recent swing lows). Watch PPI/Fed tomorrow for next leg.
If it pushes 26,030 with volume, bias flips stronger bullish (AI story + risk-on).
* Not a financial advice. Just for educational purpose. DYOR!
Let me know your thoughts. As I've got many different opinion. Please, support! Thank you!

LULU Bullish Swing Setup! Structure + Momentum AlignNASDAQ:LULU Swing Playbook 📈 | Bullish Layered Entry + Macro & Fundamental Edge 🚀
🧠 Trade Idea Summary — LULULEMON ATHLETICA INC. (NASDAQ: LULU)
💎 Bias: Bullish Swing Trade
📍 Market Structure: Price showing accumulation and support convergence area
🔥 Strategy: Layered limit entries (“Thief Layers”) to scale in with risk control
📊 Timeframe: 4H / Daily
📌 Entry Plan (Layered Limit Entries)
Use multi-layer limit entries to improve execution and reduce risk:
🟢 Layer 1: 200.00
🟡 Layer 2: 205.00
🟠 Layer 3: 210.00
🔵 Layer 4: 215.00
➡️ You may add additional layers above if price shows strong demand — adjust spacing based on volatility.
📊 This layered approach helps you average in strategically and manage pullbacks more effectively.
🎯 Target / Take Profit Zone
⭐ Primary Target: 250.00
💡 Why?
Price approaching major moving average resistance / dynamic supply zone on Daily/4H
RSI showing overbought potential + trap risk at higher levels
➡️ Consider partial profit taking before resistance clusters to lock gains.
❌ Stop Loss
🚫 Thief SL: 190.00
💡 Place your SL below structural support and recent demand zone — keeps risk controlled.
📈 Correlated Watchlist
Keep tabs on retail & discretionary peers to confirm sector strength:
🔹 NYSE:NKE (Nike) — consumer demand strength
🔹 OTC:ADDYY (Adidas ADR) — global apparel trend
🔹 TSXV:GPS (Gap) — discretionary spend proxy
🔹 NYSE:VFC (VF Corp) — broader outdoor/athleisure trend
👉 If these tickers show strength at key support, LULU’s bullish thesis strengthens.
🔎 Fundamental + Macro Context (REAL-TIME)
📊 Recent Headlines & Earnings Updates (Impacting LULU):
🗞️ LULU raised Q4 revenue & EPS guidance after strong holiday sales 👍 — bullish sentiment trigger.
🗞️ However, shares have faced pressure from tariff costs, consumer demand softness, and revised outlooks in prior quarters.
🗞️ Leadership change with CEO stepping down adds volatility + catalyst potential.
🗞️ Activist investor involvement (Elliott) hints at possible strategic upside or re-rating if execution improves.
📉 Macro Tailwinds / Headwinds:
📌 Consumer Spending: Retail discretionary stocks tied to U.S. consumer confidence and disposable income — bearish if confidence drops.
📌 Tariffs / Trade Policy: Elevated tariffs & removal of de minimis exemption have squeezed margins but may normalize later.
📌 Global Retail Trends: International sales growth remains a bright spot — diversification benefit.
📉 Technical Risk Signals to Watch
⚠️ Downside Correlation Break may hit if NASDAQ:LULU closes decisively below 190.00
⚠️ Watch macro CPI / retail sales prints — strong beats could keep discretionary names buoyant.
📊 Why This Setup is High-Engagement
✅ Clear layered entries — easier for followers to implement
✅ Fast stats + rationale — appeals to both technical & fundamental traders
✅ Tickers to watch correlation — encourages users to expand their watchlist
✅ Economic factors included — adds depth & realism
✨ “If you find value in my analysis, a 👍 and 🚀 boost is much appreciated — it helps me share more setups with the community!”
📌 Disclaimer: this is thief style trading strategy just for fun.

Sell-Side Liquidity Was the ObjectiveCAPITALCOM:US100 Yesterday’s analysis played out clean and technical, with price respecting higher timeframe supply and failing to hold premium levels.
As i have shared on monday this week, the short side idea remains valid as long as price stays capped below key resistance.
📌 Higher Timeframe Context VANTAGE:NAS100 (Daily)
• Price remains inside a daily premium supply zone
• No daily acceptance above resistance
• Overall structure still range to bearish
• Recent upside move shows weak continuation characteristics
➡️ Daily Bias: Bearish below 26,000
📉 Intraday Structure (1H)
• Clear failure at equal highs
• Distribution forming below resistance
• Price rejected from mid-range equilibrium (BB / balance area)
• Discount PD array below remains unfilled
Liquidity has been taken on the upside, and price is now rotating back into range.
🔴 Short Scenario (Primary)
• Sell zone: 25,750 – 25,900
• Conditions:
• Price remains below resistance
• No strong bullish displacement
• Targets:
• 25,650 (range low)
• 25,400 (discount / liquidity)
• Extended: 25,250
This aligns with the short idea shared earlier this week and remains the higher probability path.
🟢 Long Scenario (Secondary / Conditional)
• Valid only if price reclaims and accepts above 25,900
• Requires:
• Strong bullish displacement
• Holding above prior highs
• Upside targets:
• 26,000
• 26,050+
⚠️ No conviction longs while price trades below supply.
❌ Cancellation / Invalidation Levels
• Short bias invalidated if:
• 1H close above 26,050
• Acceptance above daily supply
• Long bias invalidated if:
• 1H close below 25,600
🎯 Final Expectation
Market continues to respect premium supply, confirming that patience at higher prices pays.
As long as price remains below daily resistance, Sell-Side reactions are favored , with liquidity resting lower.
Patience at premium. Execution at reaction.
Not financial advice.
Risk management is mandatory.

1/14 Pre-Market Read - Game plan Pre-market POIs / Game Plan (MNQ 15m)
Key context from the chart:
• We mapped the session range + prior levels and stacked POIs to create a clean “ladder” for targets.
• Important nearby references on your screenshot: Asia High ~25926, Asia Low ~25852.50, London High ~25878.75, London Low ~25701, PDL ~25803.25, and upside POIs.
My POI Ladder (targets)
Upside
• POI 1: 25,871.25
• POI 2: 25,920.50
• POI 3: 26,006.00
• POI 4: 26,083.50
• POI 5: 26,106.25
Downside
• Bear POI 1: 25,738.75
• Bear POI 2: 25,652.75
• Bear POI 3: 25,615.50
How I’m trading it today (simple rules)
Bullish idea
• If price reclaims/holds POI 1 (25,871) and starts holding above POI 2 (25,920) → I’m looking for step-ups into POI 3 (26,006) then POI 4/5.
• Best entries: retest/hold of POI after a breakout candle (confirmation > guessing).
Bearish idea
• If price loses PDL (~25,803) and can’t reclaim, that’s a warning.
• Break + hold below POI 1 (25,871) opens the door to Bear POI 1 (25,738) then Bear POI 2 (25,652).
What to watch at open
• Reaction at POI 1 / POI 2 (they’re your “decision levels”).
• Sweeps into a POI then immediate reclaim = reversal trigger.
• Clean hold above POI = continuation trigger.
Not financial advice — just my plan + levels from my system.

Options Blueprint Series [Intermediate]: Breakout With A Buffer1. Market Context: Strength at the Surface, Fragility Underneath
The NASDAQ-100 futures market currently occupies a rare and structurally important zone. Price is trading above a prior all-time high, yet remains below the most recent all-time high, with only a relatively modest distance separating current price from historical extremes.
From a purely technical standpoint, this positioning can be interpreted as constructive. Markets that hold above former highs often retain the potential to transition into renewed expansion and price discovery. However, context matters. This strength exists alongside broader signals of vulnerability across U.S. equity markets—signals that have been explored in prior work and that suggest upside continuation is not guaranteed.
This creates a dual-risk environment:
Upside risk: missing participation if the NASDAQ resumes trending higher.
Downside risk: absorbing full exposure if price fails near historical extremes.
In such conditions, directional certainty is low, but volatility risk is high. This is where outright futures exposure may be less efficient, and where options structures can offer a more robust framework.
2. The Problem With Linear Exposure at Elevated Levels
Holding NASDAQ-100 futures outright implies linear exposure:
Every point higher benefits the position.
Every point lower damages it.
Near historical highs, that symmetry becomes problematic. A trader must be correct not only on direction, but also on timing. Even a structurally bullish thesis can fail if volatility expands or if price retraces before resuming higher.
Linear exposure forces a binary outcome:
Be early and absorb drawdowns.
Be late and miss opportunity.
The goal of this blueprint is to avoid that binary trap by reshaping exposure, not eliminating it.
3. Why Options Are Better Suited for This Environment
Options allow traders to separate direction from risk. Rather than committing capital to a single path, options structures can be designed to:
Define maximum loss in advance
Shift break-even points away from current price
Allow time and volatility to work in favor of the position
Importantly, this blueprint does not rely on forecasting. It assumes uncertainty and builds around it.
The objective is not to predict whether the NASDAQ will break higher or fail lower. The objective is to remain functional across multiple outcomes.
4. Instruments Used: NQ and MNQ Options
This structure applies to:
NASDAQ-100 E-mini futures options (NQ)
NASDAQ-100 Micro E-mini futures options (MNQ)
The logic is identical across both contracts. The difference lies in scale:
NQ offers larger notional exposure and fewer contracts.
MNQ allows finer position sizing, particularly useful when structuring multi-leg options strategies.
Both instruments support the same conceptual framework.
5. Introducing the “Breakout With A Buffer” Concept
The core idea behind this blueprint is simple:
Do not chase price near highs
Do not stand aside entirely
Create a buffer below price while retaining upside access
This is achieved by combining:
A bull put spread placed well below current price
A long call positioned above current price
Together, these components transform uncertainty into a structured payoff.
6. Strategy Construction: Step by Step
The structure consists of three legs:
Short put at approximately 22,000
Long put at approximately 21,000
Long call at approximately 28,750
The bull put spread generates a net credit. That credit is then used to fund the long call.
This matters. Rather than paying outright for upside exposure, the structure monetizes downside stability to finance it.
7. Why a Bull Put Spread and Not a Naked Put
Selling naked puts would introduce undefined downside risk, which contradicts the purpose of this blueprint.
The long put:
Caps downside exposure
Converts the position into a defined-risk structure
Clarifies the maximum loss from the outset
This is not about maximizing credit. It is about controlling tail risk.
8. Strike Selection: Structural, Not Arbitrary
The selected put strikes align with:
The prior all-time high region
A visible concentration of UFOs (UnFilled Orders) acting as structural support
UnFilled Orders represent areas where institutional activity previously absorbed selling pressure. Positioning the put spread near such zones introduces a structural buffer, rather than relying on random distance.
The call strike, by contrast, is intentionally placed far above current price. This avoids overpaying for near-term momentum and instead positions for a regime where price transitions into sustained expansion.
9. Why This Is Not a Collar or a Covered Strategy
It is important to distinguish this blueprint from more common approaches:
Collars require long underlying exposure.
Covered calls cap upside and remain fully exposed to downside.
Outright calls depend heavily on timing and volatility expansion.
This structure does none of those things. It:
Does not require owning futures
Does not cap upside
Does not rely on immediate directional movement
Instead, it converts time and uncertainty into functional components of the trade.
10. Risk Profile: Defined, Asymmetric, Intentional
The resulting payoff has several key characteristics:
Maximum risk is limited to the width of the put spread (approximately 1,000 NASDAQ points), adjusted for net credit.
Break-even is pushed far below current price, near the 22,000 area.
Moderate upside benefits from both time decay on the put spread and directional exposure through the call.
Strong upside allows the long call to dominate the payoff.
This asymmetry is intentional. The structure sacrifices linear gains in exchange for survivability.
11. Scenario Analysis
At the time of constructing this case study, NASDAQ-100 futures trade near 25,900.
Possible outcomes:
Gradual advance: The put spread decays, the call gains sensitivity.
Strong breakout: The call drives returns.
Sideways consolidation: Time decay works in favor of the structure.
Moderate decline: The buffer absorbs volatility.
Deep decline below support: The defined maximum loss is realized.
Every outcome is known in advance. That clarity is the edge.
12. Volatility Considerations
This structure is volatility-aware:
Short puts benefit from volatility contraction.
Long calls benefit from volatility expansion during upside moves.
Rather than betting on volatility direction, the structure balances exposure across regimes.
13. NQ vs MNQ Implementation
For NQ:
Fewer contracts
Larger notional exposure
Greater margin efficiency per leg
For MNQ:
More granular sizing
Easier scaling
Reduced psychological pressure per contract
The strategy logic remains unchanged.
14. Contract Specifications
NQ Tick size: 0.25 points = $5
MNQ Tick size: 0.25 points = $0.50
Options multipliers mirror the futures contracts. Margin requirements vary by broker and volatility regime, currently:
NQ margin requirement = $33,500 per contract
MNQ margin requirement = $3,350 per contract
15. Risk Management Is the Strategy
Defined risk does not remove responsibility. This blueprint requires:
Proper sizing
Acceptance of worst-case outcomes
Discipline in structure selection
Options do not eliminate uncertainty. They make it visible.
16. Key Takeaways
Elevated markets demand adaptive exposure.
Options allow participation without blind commitment.
The Breakout With A Buffer blueprint prioritizes risk clarity first, opportunity second.
This framework is reusable whenever markets hover near historical extremes amid conflicting signals.
Data Consideration
When charting futures, the data provided could be delayed. Traders working with the ticker symbols discussed in this idea may prefer to use CME Group real-time data plan on TradingView: www.tradingview.com - This consideration is particularly important for shorter-term traders, whereas it may be less critical for those focused on longer-term trading strategies.
General Disclaimer
The trade ideas presented herein are solely for illustrative purposes forming a part of a case study intended to demonstrate key principles in risk management within the context of the specific market scenarios discussed. These ideas are not to be interpreted as investment recommendations or financial advice. They do not endorse or promote any specific trading strategies, financial products, or services. The information provided is based on data believed to be reliable; however, its accuracy or completeness cannot be guaranteed. Trading in financial markets involves risks, including the potential loss of principal. Each individual should conduct their own research and consult with professional financial advisors before making any investment decisions. The author or publisher of this content bears no responsibility for any actions taken based on the information provided or for any resultant financial or other losses.

Scalp the Flow. Respect the Trend.CAPITALCOM:US100 Price is showing a short-term bullish rebound, but it’s happening inside a higher-timeframe bearish environment. For me this is a classic setup: scalp longs in discount, then fade rallies into premium supply.
📌 Higher Timeframe Context VANTAGE:NAS100 (Daily)
• Price is still capped below the daily premium / supply zone
• Daily structure remains heavy unless we reclaim key resistance
• Buyers are reacting, but HTF control is still bearish below major supply
➡️ Daily Bias: Bearish below 26,000
📈 Intraday Structure (1H)
• Sharp selloff delivered, then price started rebounding
• Short term flow: bullish correction
• Key levels visible:
• Support: ~25,540 – 25,600
• Nearest resistance / sell area: ~25,720 – 25,780
• Higher resistance: 25,900+, then 26,000 zone
🔴 Short Scenario (Primary | With HTF Trend)
• Sell zone 1: 25,720 – 25,780 (first premium reaction area)
• Sell zone 2: 25,900 – 26,000 (major supply / higher premium)
• What I want to see:
• Weak push up + rejection
• Failure to hold above the zone (no clean acceptance)
• Targets:
• 25,600
• 25,540
• Extended: 25,480 → 25,400
This is the main play if price gives us a clean premium reaction.
🟢 Long Scenario (Secondary | Scalp Only)
• Valid while price holds above 25,600
• Best entries are pullbacks into support, not chasing highs
• Upside targets (scalp):
• 25,720 – 25,780 (first take profit zone)
• If acceptance happens: 25,850, then 25,900
⚠️ Longs are counter trend scalps until daily supply is reclaimed.
❌ Cancellation / Invalidation Levels
• Long scalp invalidated if: 1H closes below 25,520
• Short bias invalidated if: 1H accepts above 25,800
• HTF bearish invalidated if: 1H + daily acceptance above 26,000 (strongest flip)
🎯 Final Expectation
Short-term, price can keep pushing up from discount, but I expect rallies to get tested hard at 25,720–25,780 first. If that zone rejects, sell-side continuation remains the higher probability path.
Not financial advice. Risk management is mandatory.

MNQ Premarket Plan (POI Map) — 1/15🚨 MNQ Premarket Plan (POI Map) — 1/15
Bias/Context: We’re pressing the 25,870–25,880 decision zone (POI1 / near PDH). This is where trend day continuation OR rejection can start.
📍 Upside POIs (targets)
• POI1 25,871.25
• POI2 25,920.50
• POI3 26,006.00
• POI4 26,083.50
• POI5 26,106.25
📍 Downside POIs (supports)
• 25,738.75 → 25,652.75 → 25,615.50
• then 25,554.50 / 25,538.00
• deeper: 25,502.25 → 25,450.25 → 25,388.00 → 25,357.75 (FVG mid)
• worst case: 25,295.75
✅ Gameplan
Bull case: Hold/reclaim above 25,871–25,879 → push 25,920.50 then 26,006.00. If momentum stays strong, runner toward 26,083.50–26,106.25.
Bear case: Rejection at 25,871/25,920 → break back under 25,738.75 → target 25,652.75 then 25,615.50. If weakness accelerates, look for the next shelves below.
Rules today: First 15m range + POI retests only. No chasing mid-candle. If spreads/volatility spike → size down.

1/14 Recap – POI Breakdown Day (Bear Trend)
POI map did its job today — market gave us a clear bearish continuation and respected levels like stair-steps.
Key Levels (POIs):
26106.25 / 26083.50 / 26006.00 / 25920.50 / 25871.25
25738.75 / 25652.75 / 25615.50 / 25554.50 / 25538.00
25498.75 / 25464.75 / 25425.25 / 25385.50 / 25356.25 (FVG Mid)
Refs: PDH 26046.25 • PDL 25803.25 • NY AM High 26043 • NY AM Low ~25469.5
How it played:
• Bearish pressure stayed in control → breaks below POIs → retests failed → continuation to next POI.
• Best edge was confirmation + retest, not chasing.
Trades (QQQ 0DTE puts):
1. 618P x2 1.58 → 2.37 (+$158)
2. 617P x1 0.91 → 1.36 (+$45)
3. 614P x1 0.58 → 0.87 (+$29)
4. 613P x1 0.27 → 0.01 (-$26) (late/decay lesson)
Stats: 4 trades | 3W/1L | +$206 | 75% WR
Lesson of the day:
✅ Take the first clean continuation and retest failures at POIs.
❌ Avoid midday/late entries unless there’s a fresh A+ setup (decay eats).
Not financial advice — just journaling + execution review.

Very, Very, BearishThis market selloff is about to get a lot worse if the bulls do not put a floor under this market immediately.
If we close today below $618.50, forget it.
Most of the Mag7 are already broken.
QQQ has been held up by only 1 or 2 stocks trading sideways.
Good luck out there.

US100 M15 HTF FVG Reaction and Intraday Continuation Setup📝 Description
CAPITALCOM:US100 is holding above a short-term demand zone after a corrective pullback. Price is reacting positively from the M15 FVG, suggesting stabilization and potential continuation within the broader intraday structure.
________________________________________
📈 Signal / Analysis
Primary Bias: Bullish while price holds above the M15 FVG base
Preferred Setup:
• Entry: 25,690
• Stop Loss: Below 25,660
• TP1: 25,743
• TP2: 25,782
• TP3: 25,816 (HTF reaction / liquidity draw)
________________________________________
🎯 ICT & SMC Notes
• Reaction from M15 FVG confirms short-term demand
• No bearish BOS on lower timeframes
• Structure favors continuation after shallow pullback
________________________________________
🧩 Summary
As long as price holds above the intraday FVG, upside continuation toward higher liquidity remains the preferred scenario.
________________________________________
🌍 Fundamental Notes / Sentiment
Softer PPI reduces inflation pressure while strong Retail Sales support growth. This mix favors risk-on sentiment, keeping NASDAQ biased to the upside.
________________________________________
⚠️ Risk Disclosure
Trading involves substantial risk and may result in capital loss. This analysis is for educational purposes only and does not constitute financial advice. Always apply proper risk management, predefined stop-loss levels, and disciplined position sizing aligned with your trading plan.

Liquidity Grab into Reversal (PDH / AM High → Sellside Move)1/13 Session Recap — Liquidity Grab into Reversal (PDH / AM High → Sellside Move)
Today’s price action gave a clean, teachable sequence:
Market Structure
• Price pushed into an upside resistance pocket (PDH + upper POI area / AM High zone).
• After the tag, the market showed rejection + displacement down, signaling the reversal was active.
• The rest of the session delivered a sellside expansion into lower levels.
What I looked for
1. Tag of key upside level (PDH / AM High region)
2. Rejection candles / failure to hold above level
3. Shift in momentum → continuation lower
Execution (Options)
I executed the move using QQQ puts and scaled:
• 626P (starter / main)
• 624P and 620P (adds as confirmation strengthened)
Outcome
✅ Clean reversal execution
✅ Scaled entries + profit-taking into the dump
✅ Net: +$165.68
Key takeaway
The edge was NOT predicting — it was waiting for price to reach the level, then reacting to confirmation.
(Educational only, not financial advice.)

Are tech stocks about to surge? Nasdaq New Highs? The market is very close to making a big move.
We believe the market is still bullish and will likely trend higher.
Today crypto was strong when the market was weak. This could be signaling tech is about to capture some bullish liquidity.
Banks got decimated today, which allows lots of capital to rotate back into tech.
The Nasdaq is lagging and the only indices to not make new all time highs.

NASDAQ (NAS100) – 15-Minute Timeframe Tradertilki AnalysisMy friends, greetings,
I have prepared a NASDAQ-NAS100 analysis for you.
My friends, if NAS100 reaches the levels of 25754.54-25731.54 on the 15-minute timeframe, I will open a buy position.
My target will be the 25905.40 level.
My friends, I share these analyses thanks to each like I receive from you. Your likes increase my motivation and encourage me to support you in this way.🙏✨
Thank you to all my friends who support me with their likes.❤️

USNAS100: Consolidation Near 25720 Ahead of CPI & EarningsUSNAS100 | Market Overview
U.S. stock index futures edged lower ahead of key U.S. inflation data and Q4 earnings from JPMorgan Chase, which will kick off the earnings season. Investors remain cautious as both events may significantly influence the interest-rate outlook and short-term market direction.
TECHNICAL VIEW (USNAS100)
Volatility is expected to remain elevated ahead of today’s inflation release.
Price is currently consolidating between 25720 and 25835, awaiting a breakout.
📈 Bullish Scenario
Bullish bias remains valid while trading above 25720
A 1H candle close above 25835 would confirm upside continuation toward:
25985 - 26170
📉 Corrective / Bearish Scenario
A 1H candle close below 25720 would trigger a correction toward:
25510 - 25250
Key Levels
Pivot Line: 25720
Resistance: 25835 – 25985 – 26170
Support: 25510 – 25250

Walmart - Good PotentialCounting waves and assessing technical potential. Here’s what we see:
We are drawing a classic five-wave structure. The move started in November 2015.
November 2015 - April 2022 - Wave 1
June 2022 - February 2025 - Wave 3
April 2025 - present - Wave 5
The upside potential is estimated at 18 - 38 %.
Key targets:
136
156
---
Please subscribe and leave a comment!
You’ll get new information faster than anyone else.
---


MNQ - Ascending Channel Range Play | FVG Zones Holding
Hey TradingView community! 👋
NASDAQ futures are in classic range mode right now. Let me break down what I'm seeing on the 45-minute chart.
The Setup
MNQ1! is trading at 25,941 inside an ascending channel, currently sitting right in the upper FVG zone around 25,880-25,920. Price has been respecting this channel beautifully - bouncing between the upper and lower boundaries like clockwork.
This is a range-bound market. Until we get a decisive breakout, expect more of the same: test resistance, pull back to FVG, bounce, repeat.
Why I'm Neutral Here
Ascending channel intact - but price is RANGING, not trending
Two FVG zones acting as magnets - price keeps retesting them
S&P 500 at record highs but NASDAQ lagging slightly
Fed pressure headlines creating uncertainty (Powell vs Trump drama)
CPI data Tuesday could be the catalyst for breakout
Bank earnings starting this week (JPM Tuesday)
The News Context
Mixed signals keeping the market choppy:
S&P 500 hit record high Friday - but NASDAQ underperforming
Trump vs Powell drama - DOJ threatening Fed Chair over "renovation" testimony
Credit card rate cap proposal hitting bank stocks hard
Soft jobs data (50K vs 60K expected) - but unemployment dropped to 4.4%
Banks pushing back rate cut expectations after jobs report
Walmart joining Nasdaq-100 on Jan 20 - could bring passive fund flows
CPI report Tuesday - this is the big catalyst to watch
Key Levels I'm Watching
Resistance:
26,000 - Psychological level / upper channel
26,280 - Major resistance (near 52-week high)
26,399 - 52-WEEK HIGH
Support:
25,880-25,920 - Upper FVG zone (current)
25,800-25,860 - Lower FVG zone
25,600 - Channel midline support
25,320 - Lower channel support
My Game Plan
Range scenario (MOST LIKELY): Price continues to oscillate within the ascending channel. Expect retests of the FVG zones. Trade the range - buy at lower FVG, sell at upper channel resistance. This is a scalper's market until we get a breakout.
Bullish scenario: If CPI comes in soft and we break above 26,000 with volume, next target is 26,280, then 26,399 (52-week high). Walmart joining Nasdaq-100 on Jan 20 could bring passive buying.
Bearish scenario: If CPI comes in hot or Fed drama escalates, we could break below 25,600 and test 25,320 lower channel support. Watch bank earnings for sentiment.
The Bottom Line
I'm NEUTRAL here. The channel is intact but we're just ranging. No clear trend until we break out. The FVG zones are acting as support/resistance - trade the range or wait for the breakout.
CPI Tuesday is the key. That's likely the catalyst that decides direction.
What do you think? Breakout or more chop? Let me know in the comments! 👇

NASDAQ Testing 1 month Resistance. Break or rejection?Nasdaq (NDX) has been on a Higher Lows uptrend since the November 21 2025 bottom but following the December 05 high, it has failed to break above that 25830 Resistance (1) on 5 tests. Today it is attempting it for the 6th time.
A break and 1D candle closing above Resistance 1 then, will confirm the bullish break-out of that Ascending Triangle and transitioning into a Channel Up. If it maintains a high symmetry with the first one (+4.31%) then we expect to see 26150, falling just below Resistance 2 (26260) and the All Time High.
If however the price gets rejected again on Resistance 1 (close a candle below it), the minimum Target would be the 4H MA200 (orange trend-line) at 25450, falling just above the 0.618 Fibonacci retracement, which is the level that all Higher Lows since November 21 approached.
It has to be noted at this point that the 1D RSI is now hitting the Lower Highs trend-line that started on September 22 2025. If rejected here again, the market will confirm a huge Bearish Divergence that can shift the long-term trend to bearish.
---
** Please LIKE 👍, FOLLOW ✅, SHARE 🙌 and COMMENT ✍ if you enjoy this idea! Also share your ideas and charts in the comments section below! This is best way to keep it relevant, support us, keep the content here free and allow the idea to reach as many people as possible. **
---
💸💸💸💸💸💸
👇 👇 👇 👇 👇 👇
