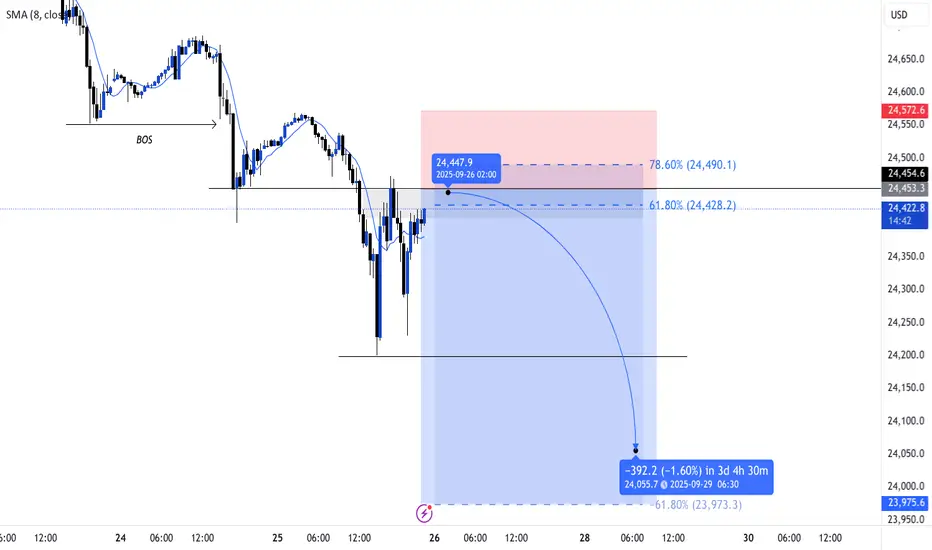
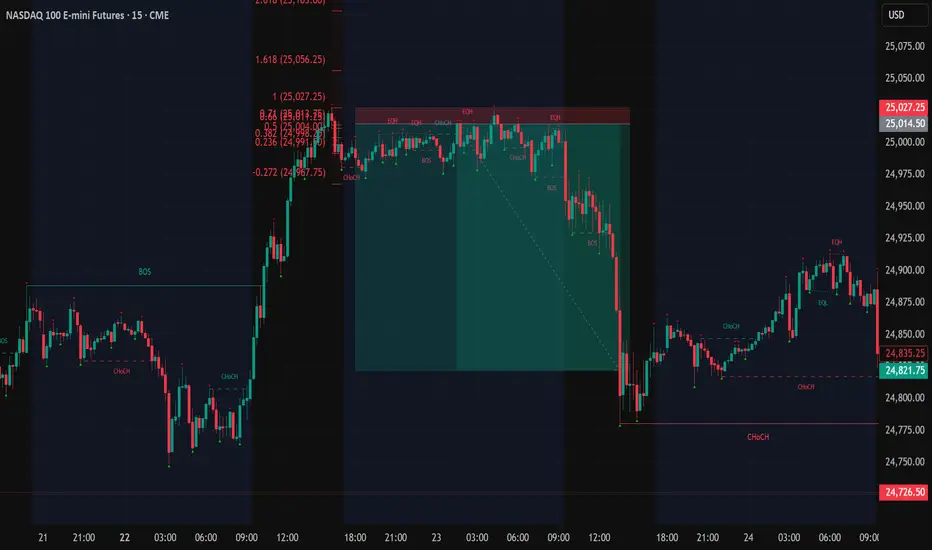
Short Trade Idea for 9/30 | NQI’m anticipating price to either push into the 1H bearish imbalance at 24,894 or reject from the NWOG around the 24,856 range before turning lower toward the 24,640.00 range. My bias is firmly short for now — but I’ll reassess as we approach the open.
Nasdaq

NASDAQ – Decision Point is Now: Breakout or Breakdown?📈🔍 NASDAQ at Key Inflection – Momentum or Meltdown? ⚠️💥
Hey Traders,
The NASDAQ 100 is now standing right at the make-or-break zone: 22,655. This level marks a critical retest of the recent breakout, and what happens here could define the next major move.
🔵 The Setup:
After a strong bounce and sharp rally from below 18K, we've climbed back into the tight ascending structure. But momentum is slowing…
This zone could produce either a bullish continuation to new highs — or a brutal rejection that unwinds the entire move.
📍 Structure Speaks:
Holding above 22,655 = likely continuation
Breakdown = deeper pullback toward 20,000 and lower channel support
Momentum names like NVIDIA are doing the heavy lifting again — but can they sustain the market alone?
📊 What I'm Watching:
Bullish path = measured target ~25,000+
Bearish path = test of the broader trendline near 20,000 or even the 18,200 region
Macro signals still mixed — stay nimble, not married to one bias
⚠️ Stay Sharp:
Just like in crypto, the Nasdaq can punish both bulls and bears when it enters chop mode. Structure and discipline remain your best defense.
I’ve updated the chart — fresh out the oven 🍞 — and more market ideas are following, including BTC, ETH, and BTC Dominance.
One Love,
The FXPROFESSOR 💙
Disclosure: I am happy to be part of the Trade Nation's Influencer program and receive a monthly fee for using their TradingView charts in my analysis. Awesome broker, where the trader really comes first! 🌟🤝📈

Futu Holdings a New ath or time for a correctionIn this video I go over the previous price action and develop a plan of where to look for a future entry if you are accumulating Futu .
I demonstrate using a standard fib pull how price may gravitate back to .786/.886 fib levels over time as well as what to look for in the event we push up for a new Ath .
20 Nov we have earnings and despite the past track record of earnings have surprised the market with positive results I question if the upcoming does the same or will it be the catalyst for the correction .

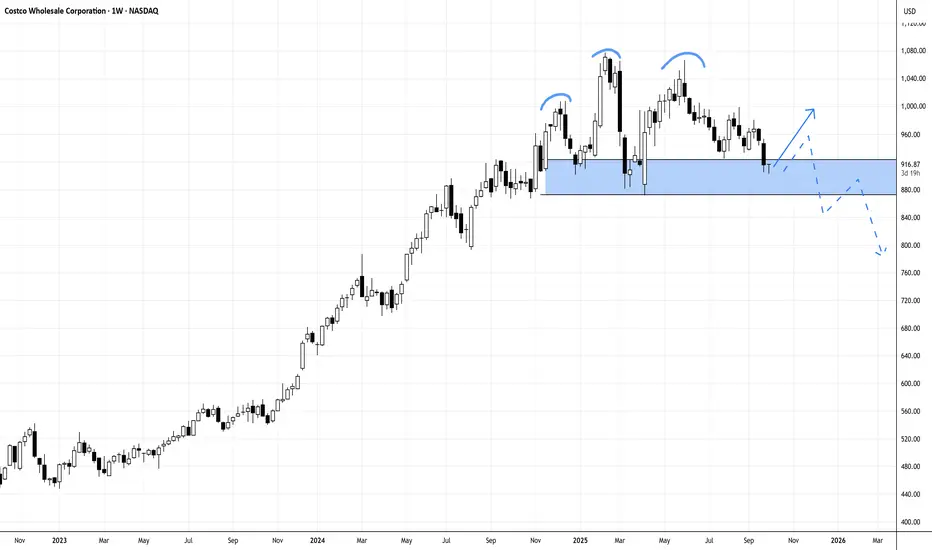
COSTCO NEEDS TO AVOID BREAKING H-n-S TO CONTINUE ITS UPSIDE RALLCostco (COST) has posted another strong fiscal year, with revenue climbing to $86.2B and net income up to $5.49B. However, the weekly chart is showing a developing head-and-shoulders pattern threatens the upside momentum, and price must hold above 871 with a rejection candle this week to avoid a deeper breakdown. A close below that level could confirm bearish continuation, despite Costco’s solid fundamentals.
N.B!
- COST price might not follow the drawn lines . Actual price movements may likely differ from the forecast.
- Let emotions and sentiments work for you
- ALWAYS Use Proper Risk Management In Your Trades
#cost
#nasdaq
#nyse
NQ Shorts re entryAfter the recent win I saw a new clear break above my set levels. And a perfect textbook reversal formed. Entere more shorts.
Setting alerts and waiting patiently is how consistency starts, once you form those small habits over time it becomes simple repition and then profitability flows from there.
I didnt find this consistency until I aligned my trading with Christ.

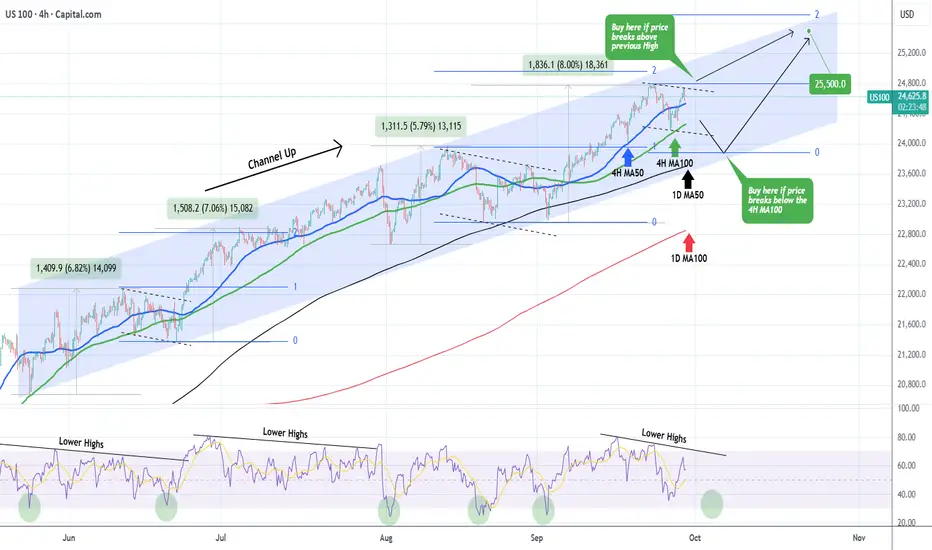
NASDAQ in no action zone. Buy break-out or pull-back.Nasdaq (NDX) has been trading within a 4-month Channel Up and its most recent low has been on its 4H MA100 (green trend-line) 2 days ago.
As long as it holds, it maintains the short-term bullish trend but a confirmed buy signal would be after the price breaks above its previous 24800 High.
Until it does, it might be within a technical Bearish Leg similar to late August's and mid June's that both broke below the 4H MA100 before bottoming on the Higher Lows trend-line of the Channel Up and rebounded. The 4H RSI Lower Highs structure shows that we might be on such a pull-back sequence, which turns into a buy below 33.00 (RSI).
As a result, we will either wait for a 24800 break-out or a 1D MA50 (black trend-line) pull-back before initiating a buy again. In both cases, our Target is 25500 (just below the 2.0 Fibonacci extension).
-------------------------------------------------------------------------------
** Please LIKE 👍, FOLLOW ✅, SHARE 🙌 and COMMENT ✍ if you enjoy this idea! Also share your ideas and charts in the comments section below! This is best way to keep it relevant, support us, keep the content here free and allow the idea to reach as many people as possible. **
-------------------------------------------------------------------------------
💸💸💸💸💸💸
👇 👇 👇 👇 👇 👇
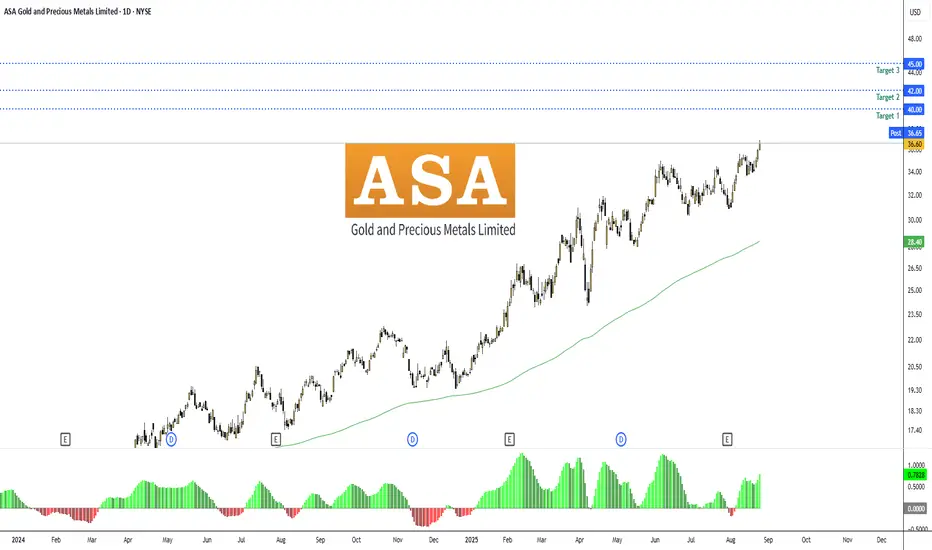
Insider: ASA Gold and Precious Metals LimitedNYSE:ASA #ASA — ASA Gold and Precious Metals Ltd | Financial | Closed-End Fund - Equity | USA | NYSE | August 25, 2025.
Insider Purchase and Company Overview
Recent insider filings for ASA Gold and Precious Metals Limited (NYSE: ASA), a closed-end investment fund focused on companies engaged in the exploration, mining, or processing of gold and other precious metals, reveal aggressive accumulation by major shareholder Saba Capital Management, L.P. As a 10% owner, Saba executed two notable purchases in late August 2025: on August 21, 2025, acquiring 6,710 shares at $35.05 per share for a total value of $231,380, and on August 22, 2025, adding 4,632 shares at $35.97 per share for $166,181.
These transactions, disclosed via SEC Form 4 on August 25, 2025, boosted Saba's total holdings to 4,077,634 shares, representing a significant stake in the fund. This activity is part of a broader pattern of buying by Saba throughout August 2025, including larger acquisitions such as 9,943 shares on August 19 at $33.99, 18,310 shares on August 15 at $34.24, 8,310 shares on August 14 at $33.89, 1,836 shares on August 13 at $35.11, 354,169 shares on August 12 at $35.39, and a substantial buy on August 11 valued at approximately $11.4 million at $35.00 per share.
Saba Capital, led by activist investor Boaz Weinstein, has been increasing its position amid an ongoing proxy battle and governance disputes with ASA's board, signaling strong conviction in the fund's undervaluation relative to its net asset value (NAV) and the bullish outlook for precious metals. No other significant insider purchases from executives or directors were reported in August 2025, but institutional interest is evident, with Sprott Inc. maintaining a $8.45 million stake as of recent filings.
➖ www.nasdaq.com
➖ www.marketbeat.com
News Analysis
August 2025 news for ASA has been dominated by governance changes and activist developments. On August 22, 2025, the company announced the resignation of directors William Donovan and Mary Joan Hoene, alongside the appointment of Karen Caldwell to the board—a move that may reflect ongoing pressure from Saba Capital to refresh leadership and address the fund's persistent discount to NAV (historically trading at 10-20% below its underlying assets).
Earlier in the month, ASA filed an 8-K on August 7, 2025, likely related to operational updates, and released its August Gold Chart Book on August 1, highlighting positive trends in gold mining equities amid rising metal prices. Saba's activism, which includes a dropped lawsuit in July 2025 over expired anti-takeover measures (poison pills) and ongoing proxy proposals to expand the board, underscores their push for value unlocking, such as potential conversions or mergers.
No other major insiders or traders reported buys in August, but Saba's consistent accumulation (totaling over $20 million in value across the month) positions them as the dominant force, with holdings now exceeding 4 million shares. This activist involvement could catalyze premium narrowing or strategic actions, boosting shareholder value.
Charts:
• (1D)
• (3D)
SEC From 4:
www.sec.gov
Forecast:
Replicating Saba's recent buys at an average entry of ~$35.50 (blending the August 21-22 transactions), the setup offers solid upside potential in a precious metals bull market, supported by technical strength and activist catalysts. I estimate a 15-30% growth potential over the next 3-6 months, assuming gold prices remain elevated above $3,364/oz and Saba's activism yields positive outcomes like board expansions or discount-narrowing measures.
Entry Price: $35.50. (current/insider level).
Recommended Exit Targets:
➖ Conservative Target 1: $40.00 (13% profit, +$4.50/share)
➖ Moderate Target 2: $42.00 (18% profit, +$6.50/share)
➖ Aggressive Target 3: $45.00 (27% profit, +$9.50/share)
Stop-Loss: $32.00 (10% downside risk, -$3.50/share) – Below 20-day SMA to guard against pullbacks.
Overall Potential: 15-30% growth, with a risk-reward ratio of ~1:2 at the moderate target.
Risks include gold price volatility, failed activism (e.g., prolonged proxy fights), or broader market corrections in commodities. Position sizing should be 1-3% of portfolio given the fund's sensitivity to metal prices.
NASDAQ-NAS100 4H Analysis: Buy OpportunityHello Guys,
I’ve prepared a 4-hour NAS100 analysis for you.
I’ll be entering a buy position from 24,500.00 with a target set at 24,748.00.
Set your stop level according to your own margin.
Once the markets open, I’ll definitely take my shot on the buy side of NAS100.
Let’s see how this analysis plays out together.
Every like is my biggest motivation to keep sharing these analyses.
Thanks to everyone supporting me!

NQ is twitching the worm - Don't take the bait🎣 Don’t take the bait! 🎣
Just sitting here, watching my pre-market setup.
Now I can see them twitching the worm, trying to lure me in.
NOPE!
This price action’s way too twitchy for me. §8-)
This Chart is a RTH with "Gap-Attached" and gives a perfect catch of the first drop.
So, just casually watching...maybe I can learn even more...
🐟🐠🐡🐟🐠🐡🐟🐠🐡🐟🐠🐡🐟🐠🐡🐟🐠🐡🐟🐠🐡
NASDAQ H1 OUTLOOKLets Nasdaq Sell
Reasons
Bearish Order Block
Who Is With Me Comment Your Opinion
Good Luck Guys
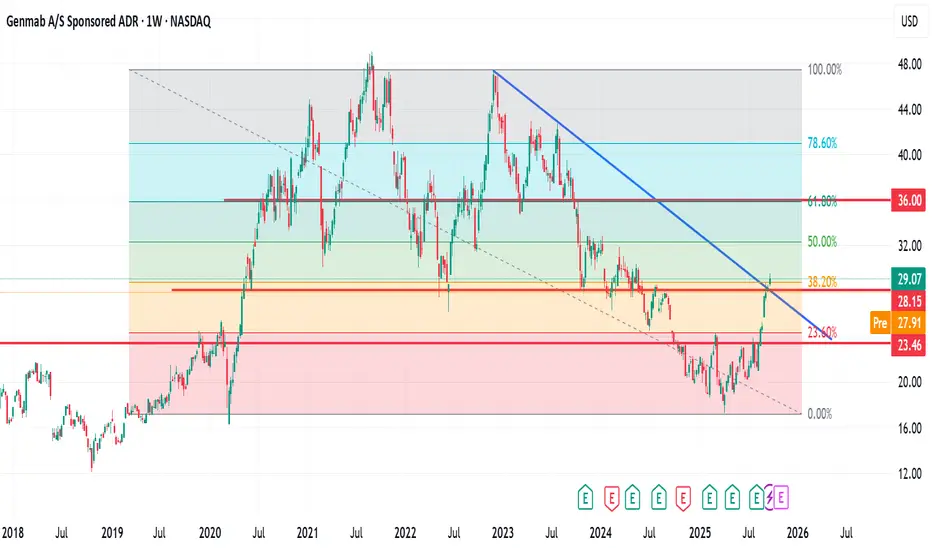
GMAB at a Critical Confluence Zone – Potential UP or down?GMAB at a Critical Confluence Zone – Potential Breakout or Reversal?
GMAB has shown strong recovery momentum since its April 7th, 2025, low. The price is currently testing a significant confluence area formed by a descending trendline and the Fib 38.2% support level.
If price action holds above this zone, there is potential for a continuation move toward the Fib 61.8% level, which would represent an estimated upside of around 28%.
My Trade Plan:
Initial entry at the current market cap.
Second entry after a confirmed breakout above this confluence zone.
As always, apply proper risk management—trade cautiously and according to your strategy.
🔹 Like, comment, and follow for more trade ideas.
🔹 Let’s connect here on TradingView.
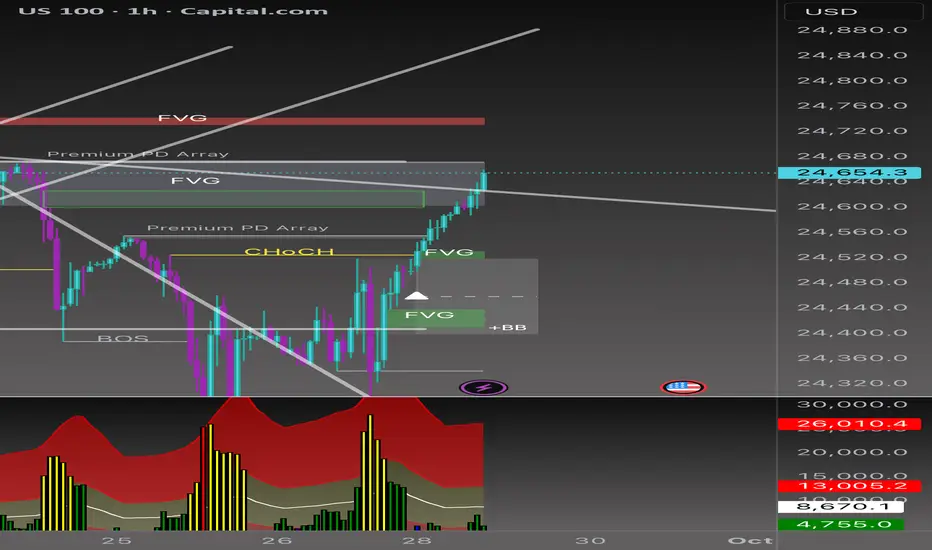
NASDAQ | Diagonal resistance | GTradingmethodGood morning Traders,
I hope everyone has had a winning week so far :)
The US100 is sitting at a pivotal point. Price is currently at all-time highs but also testing two key diagonal resistance levels — one medium-term and one short-term. These resistance lines are intersecting right now, which adds extra weight to this resistance zone.
The big question:
👉 Will the US100 break through resistance and push higher into uncharted territory, or are we about to see a short-term correction from here?
📊 Trade Plan:
Not entering a trade just yet — waiting for confirmation of either a breakout with retest or rejection and reversal.
Very keen to hear what everyone thinks, let me know please :)
Peace
G

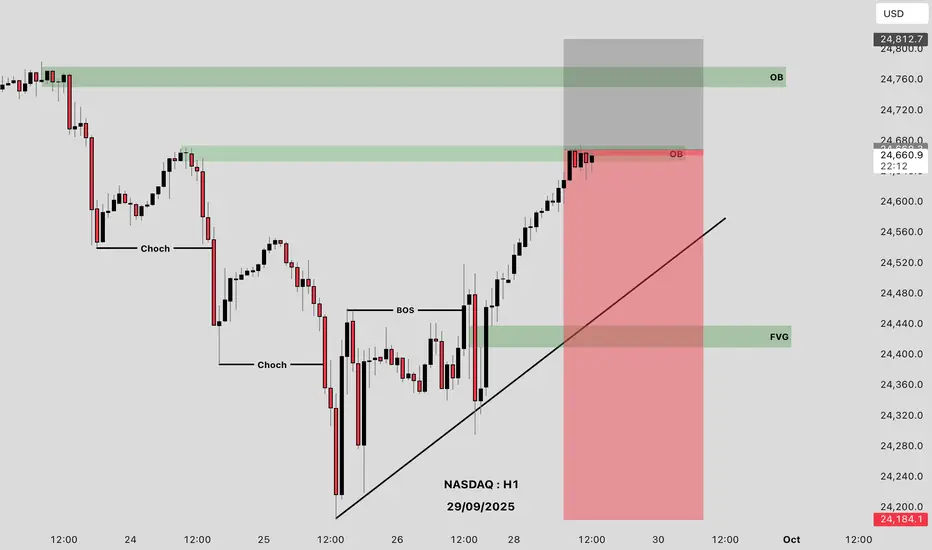
Beyond the Chart - NAS100 Through Technicals & FundamentalsThe trendline I drew last week played out perfectly. Price has carved out a fresh trend on the lower timeframe and is breaking to the upside. But the real confirmation comes only if the FVG is fully filled and we get a strong bullish close above 24,700.
NASDAQ Daily Analysis 📊
👉Hold above 24,500 – 24,520 → BUY targeting 24,700 (upper FVG). Break & hourly close above 24,700 → room to push toward 24,850 – 24,900.
👉24,700 – 24,750 → strong SELL zone (Premium PD Array + FVG overlap). First downside target: 24,400 – 24,350.
⚡️Bottom line:
• Bullish case→ If inflation comes in lower and the Fed takes a softer tone → buyers could step in and push levels higher.
• Bearish case → If data runs hot and the Fed signals more tightening → selling pressure kicks in, and your short levels become key.
NAS100 - Stock Market Awaits Employment Data!The index is above the EMA200 and EMA50 on the four-hour time frame and is in its long-term ascending channel. If the upward momentum decreases, we can expect a correction to the demand range and buy Nasdaq in that range with an appropriate reward for the risk.
According to reports released over the weekend, UBS stated that there is a 93% probability of the U.S. economy entering a recession this year. This figure implicitly suggests that the country may already be in recession, though some analysts remain skeptical of such a direct conclusion. UBS’s projection is based on indicators such as personal income, consumption, industrial production, and employment.
The bank warned that the U.S. economy has reached “historically troubling levels,” though no outright collapse has yet occurred. Analysts at UBS described the economy as “weak, soft, and fragile,” while noting that a definitive declaration of recession has not been made.
In the United States, an official declaration of recession is the responsibility of the Business Cycle Dating Committee at the National Bureau of Economic Research (NBER), which typically makes such calls with a lag of 6 to 18 months after the recession has started. Their assessment relies on revised data covering GDP, employment, income, sales, and production, and they generally avoid premature decisions.
In the meantime, policymakers and markets tend to act on real-time indicators such as GDP estimates, jobs data, yield curve signals, and credit spreads. In practice, traders react more strongly to price movements than to formal definitions of recession.
Separately, Michael Feroli, chief U.S. economist at J.P. Morgan, dismissed Fed board member Steven Miran’s call for cutting rates to 2.5% or lower. The bank has maintained its forecast for gradual 25-basis-point cuts, targeting a range of 3.25% to 3.5% by early next year.
A potential Supreme Court case involving Fed board member Lisa Cook has also emerged as a “wild card,” since a ruling against her could undermine the positions of other members as well. J.P. Morgan has warned that politicization of the Federal Reserve would leave the institution more vulnerable to pressure from a Trump administration on monetary policy.
The U.S. dollar remained relatively strong this week, as investors continued to parse the Fed’s less-dovish stance. While the latest dot plot showed policymakers aligned with the market on two additional rate cuts this year, the median dot for 2026 pointed to only one more 25-basis-point reduction. By contrast, markets still expect as many as three cuts next year.
However, following Chair Jerome Powell’s cautious tone on Tuesday—emphasizing that the Fed must continue balancing the competing risks of elevated inflation and a weakening labor market—investors scaled back some of their bets.
Inflation risks remain significant. The OECD highlighted this week that the full effects of tariff hikes are still unfolding. What supports Powell’s cautious approach is that, despite signs of labor market weakness, the Fed’s own forecasts remain relatively optimistic, with economic activity showing resilience. The Atlanta Fed’s GDPNow model projects 3.3% growth for Q3.
Although last week’s inflation data failed to dampen market optimism for rate cuts—and equities continued their rally—the focus in the coming week will shift back to labor market conditions.
The week begins Monday with pending home sales data. On Tuesday, the JOLTS job openings report and the consumer confidence index will be released. Wednesday brings private-sector employment data from ADP, followed by the ISM Manufacturing PMI. On Thursday, weekly jobless claims will be published as usual.
All of these releases will build up to Friday’s critical nonfarm payrolls (NFP) report, widely seen as the market’s ultimate test.Investors will closely monitor whether recent labor market weakness persists, and whether the Fed can move another step toward a rate cut at the October meeting. Finally, the ISM Services Index will provide a more comprehensive picture of U.S. economic health.
Ahead of the jobs data, traders may also take note of remarks from several Fed officials, including Vice Chair Jefferson, New York Fed President Williams, Atlanta Fed President Bostic, Chicago Fed President Goolsbee, and Dallas Fed President Logan. The ADP and NFP releases on Wednesday will likely provide the first snapshot of September labor market performance.

Nq shorts at the momentI took a short position here and am looking to trail it down for a decent RR.
Glory to Christ!

My past present and Futures with Christ!We have been doing things quite different lately.
One setup is all we do.
It is quite boring.
But it works
and Christ is the center of it all!
Adobe (ADBE) – Double Bottom + EMA50 Breakout PotentialOn the Daily timeframe, NASDAQ:ADBE is showing early signs of strength:
A Double Bottom pattern has formed, often seen as a bullish reversal signal.
RSI divergence was present at the pattern lows, and RSI has broken above its trendline, suggesting momentum shift.
Price closed above the EMA50 , an important technical milestone.
MACD is in positive territory, supporting a potential continuation upward.
Volume has not spiked dramatically, but it is gradually increasing compared to recent history.
Key Levels:
If the downtrend resistance line is broken and price retests neckline/downtrend area successfully, the pattern projects a move at least towards the next local resistance zone.
Confirmation is crucial: a breakout without retest can be a false signal.
Important Note:
This analysis is not a buy/sell signal. It highlights potential upside if key technical levels are broken and confirmed. Patience for breakout + retest may provide a clearer setup.
(For educational purposes only, not financial advice.)

Keurig Dr Pepper (KDP) – Triangle Breakdown with Heavy VolumeOn the Weekly timeframe, KDP has broken down from a Triangle pattern , with price also pushing below the first major support zone while volume increased.
Typically, Triangle patterns project a move equal to the triangle’s widest range. Based on this, the chart suggests a possible continuation towards the $18–20 zone.
There is also a notable gap area around $15, which could act as a magnet for price if selling pressure continues.
RSI is already oversold territory, and MACD is deep in negative momentum. This may result in a short-term bounce or correction upward before continuing the downside move.
However, it’s important to remember that patterns do not always play out fully — sometimes reversals occur before reaching the projected target.
Key Takeaway:
This analysis is not a call to short the stock. It is a cautionary outlook for those considering BUY positions. Given the strong breakdown and technical signals, it may be wiser to remain patient until stronger signs of reversal appear.
(For educational purposes only, not financial advice.)

NAS100: CRITICAL BREAKOUT ZONE! 25K Battle Ahead 🚀 NAS100: CRITICAL BREAKOUT ZONE! 25K Battle Ahead 📊
Current Price: 24,507.1 | Date: Sept 27, 2025 ⏰
📈 INTRADAY TRADING SETUPS (Next 5 Days)
🎯 BULLISH SCENARIO
Entry Zone: 24,480 - 24,520 📍
Stop Loss: 24,420 🛑
Target 1: 24,650 🎯
Target 2: 24,800 🚀
🎯 BEARISH SCENARIO
Entry Zone: 24,550 - 24,580 📍
Stop Loss: 24,630 🛑
Target 1: 24,300 🎯
Target 2: 24,150 📉
🔍 TECHNICAL ANALYSIS BREAKDOWN
📊 KEY INDICATORS STATUS:
RSI (14): 58.3 ⚡ *Neutral Zone - Room to Move*
Bollinger Bands: Mid-band Squeeze 🔥
VWAP: 24,465 - Dynamic Support Holding 💪
EMA 50: 24,380 ✅ *Bullish Above Key Level*
Volume: Declining 📊 *Awaiting Catalyst*
🌊 WAVE ANALYSIS:
Elliott Wave: Wave 4 Correction Complete 🌊
Next Target: Wave 5 Extension to 25,200+ 🎯
🔄 HARMONIC PATTERNS:
Bullish Bat Pattern Active at 24,450 ✨
ABCD Completion targeting 24,750 🔄
⚖️ SWING TRADING OUTLOOK (1-4 Weeks)
🚀 BULLISH TARGETS:
Weekly Resistance: 24,850 🏆
Monthly Target: 25,200 🌙
Gann Square of 9: 25,000 ⭐
📉 BEARISH INVALIDATION:
Weekly Support: 24,200 ⚠️
Critical Level: 24,000 🚨
🎭 MARKET STRUCTURE:
Trend: Consolidating Bullish 💪
Momentum: Building Energy 🔥
Wyckoff Phase: Re-accumulation 📈
Ichimoku: Neutral Cloud 🟡
🔥 CRITICAL LEVELS TO WATCH:
Resistance: 24,600 | 24,750 | 25,000 🚧
Support: 24,350 | 24,200 | 24,000 🛡️
Breakout Trigger: 24,580 confirmed close 💥
⚡ RISK MANAGEMENT:
Max Risk per Trade: 1.5% 🛡️
R:R Ratio: Minimum 1:3 ⚖️
Position Size: Conservative in Range 📏
🌍 MARKET CATALYSTS:
Tech Earnings Season Approaching 💼
Fed Policy Impact on Growth Stocks 🏛️
AI/Tech Momentum Driving Index 🤖
🎯 FINAL VERDICT:
NAS100 coiling for EXPLOSIVE MOVE! 🚀
25K psychological level in sight! 💥
Watch for volume spike above 24,580 👀
Trade Management: Scale in on pullbacks to VWAP 📈
Key Decision Zone: 24,500-24,600 battle crucial ⚔️
---
*⚠️ Disclaimer: Trading involves risk. Use proper risk management. This analysis is for educational purposes only.*
For individuals seeking to enhance their trading abilities based on the analyses provided, I recommend exploring the mentoring program offered by Shunya Trade. (Website: shunya dot trade)
I would appreciate your feedback on this analysis, as it will serve as a valuable resource for future endeavors.
Sincerely,
Shunya.Trade
Website: shunya dot trade
🔔 Follow for Daily Updates | 💬 Share Your NAS100 Strategy

A Bullish Friday for NasdaqNow that support has been reached, I’m anticipating Nasdaq to resume its bull run. During the AM session, I’ll be watching for either a double bottom or an inverse head-and-shoulders pattern to form.
On the daily chart, I’m anticipating a rejection from the 24,600 Daily FVG.
It may be too early to confirm, so I’ll revisit and update this idea in the morning.
Lets go Long⚡

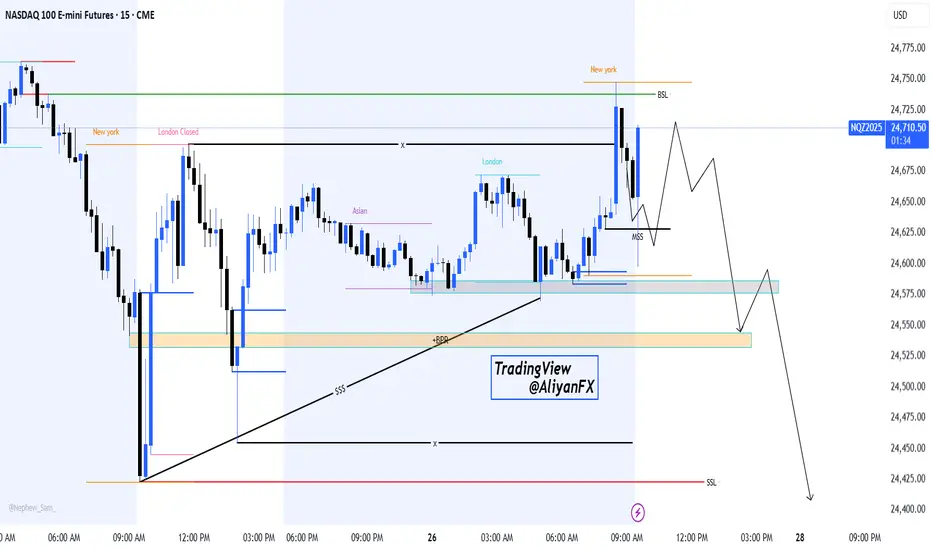
NASDAQ 100 – Potential Liquidity Grab & Bearish Continuation SetHello Billionaires!!
We All know that the Price has swept the New York session high (BSL) and is now showing signs of a potential market structure shift (MSS). If the short-term pullback holds, we may see a deeper retracement toward the demand zone (BPR + Asian range) before another leg down.
🔹Key Levels to Watch:
24,725 – 24,750: Liquidity grab zone (recent NY high)
24,575 – 24,550: Re-test area for possible continuation
24,500 – 24,450: Next downside target if bearish momentum continues
Bias: Short-term retracement followed by potential bearish continuation toward lower liquidity pools (SSL).
📌 This is an educational projection, not financial advice. Trade safe and always manage your risk!
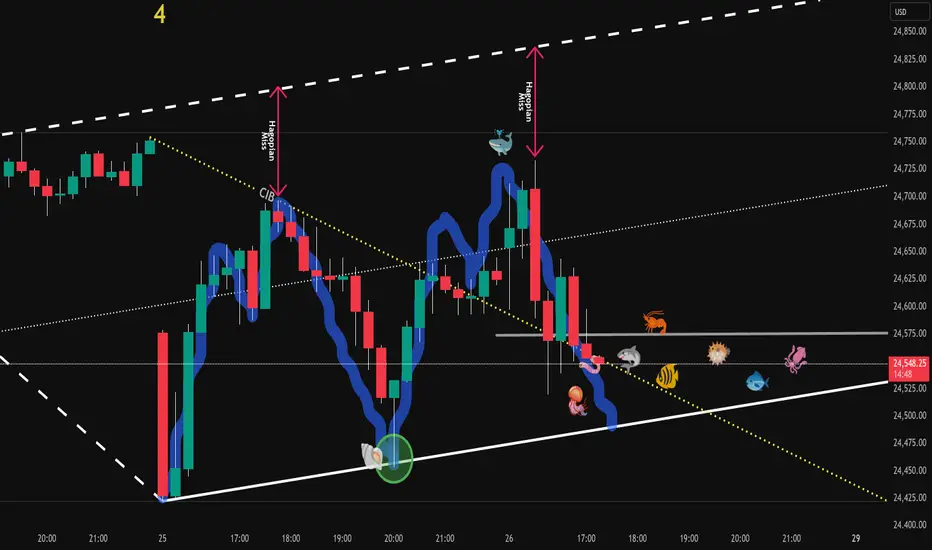
Nasdaq Pre-Market Long CIB Trade🔱 Here comes the CIB Trade 🔱
Price came down in 5 waves.
The CIB line gives us a heads-up if price breaks through it, and it did!
Now everyone and it's Grandma is long on the breakout.
"...let's scare them out, let's hit their Stop!"
Then we take off upon a test of the CIB-Line, which in essence is the same as a test fo a U-MLH or L-MLH after a break.
We have a nice target with a chance to hit of about 80% at the Centerline, and a fantastic tiny stop below the test at the CIB line.
Let's watch how this unfolds.