USTEC NASDAQ BUY IDEABOOM USTEC Nasdaq buy idea just gooo buy golden zone 0.5% risk per trade please
Nasdaq


Intel - Waiting for a CorrectionContinuing our look at Intel stock.
Analyzing the wave structure, it’s clear we’re not ready for a strong push up yet.
What’s needed now is a correction.
Most likely, the stock will retest or approach the recent highs before rolling into a corrective move.
The current structure is similar to NASDAQ:NVDA - one final subwave up toward the peak, a mini-impulse, and then a deeper correction.
Additional confirmation for a correction comes from the impulse move down that started back in April 2021:
The fifth wave began in December 2023, and a return to those levels now seems very logical.
In other words, the move from April 2025 until today represents Wave A .
Conclusion:
A small initial push up, then a bigger move down.
Preliminary targets:
36
31
Bonus:
The current Intel chart in March 2020 resembles the present structure of NASDAQ:TSLA , which is also covered in other ideas.
---
Subscribe and leave a comment.
You’ll get new ideas faster than anyone else.
---

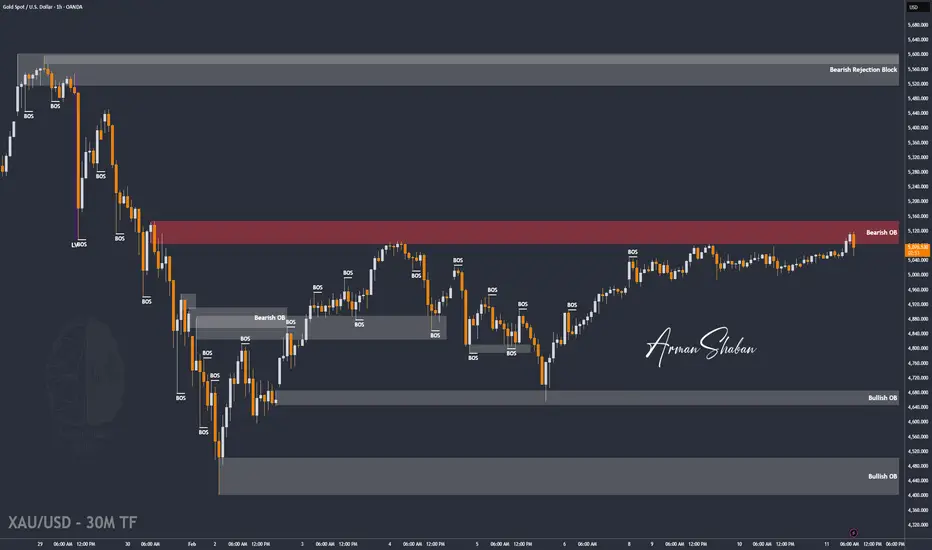
XAU/USD | Gold Breaks $5086, Now Testing Key Zones Again!By analyzing the #Gold chart on the 1-hour timeframe, we can see that after a small pullback yesterday, price made a strong move toward the $5086 resistance. Gold successfully broke this level and rallied up to $5121.
After reaching this important zone, price faced selling pressure and is now trading around $5076.
Key demand zones are $5026, $5050, and $5059.
Key supply zones are $5092–$5099 and $5111–$5121.
If Gold manages to break and hold above the $5120 zone, we can expect further upside toward $5146.
Keep a close eye on price reaction at each of these zones. This analysis will be updated soon.
Please support me with your likes and comments to motivate me to share more analysis with you and share your opinion about the possible trend of this chart with me !
Best Regards , Arman Shaban
XAU/USD | Going for the NDOG (READ THE CAPTION)By examining the hourly chart of Gold we can see that after touching the Daily IFVG Low and going as high as 5116, it dropped in price and experienced a massive drop after the NFP news drop. It has somewhat recovered from the drop, but it's been consolidating in the same zone for the past couple of days, currently being traded at 5063. I expect gold to go for the Feb 12th NDOG soon, and then after the initial reaction we'll see how gold reacts.

GBP/USD | NWOG Retest (READ THE CAPTION)As you can see in the 30m chart of GBPUSD, after it hit the Feb 9th NWOG Midpoint (Consequent Encroachment), it bounced back up, but after hitting Jan 26th NWOG Low, it dropped again, going back to the Feb 12th NDOG, hitting it and going back up a bit and it is now being traded at 1.3638.
I expect GBPUSD to retest the Jan 26th NWOG.

DJI - Long Term Trend Line Needs To Be Respected I dont think a bull run like this is sustainable, ever since the vertical line the dow has moved way above the dominant trend line. I want to see a retest of this trend line again.
Small dips can be seen in 2000, 08, allowing a small trend line down to be made in white dotted line.
A third move down is coming I believe, just a matter of when.

#EURJPY , a Child of 2 Leaders 📊 Morning Market Brief | London Session Prep
🔎 Instrument Focus: #EURJPY
⚠️ Risk Environment: High
📈 Technical Overview:
EJ , Not my fav pair but lets see does it follows it owns dad and mommy ? :) ( UJ GJ )
🚀 Trading Plan:
• Need to check Momentum at POI
• LTF ENTRY NEEDED ‼️
• Just and Only for QuickScalp
🧠 Stay updated with real time news and macro events, visit 👉 @News_Ash_TheTrader_Bot
#Ash_TheTrader #Forex #EURUSD #MarketInsight #PriceAction #TradingPlan #RiskManagement #LondonSession #Scalping #Futures #NQ #Gold

A Dip To A PushPrice is currently consolidating at the equilibrium level, bears are expected to overpower bull after the liquidity grab at 25334.2. Anticipating a drop to the discount area at 24600.0 in order for the market to continue hiking to 25700.0.


Nasdaq M30Good day everyone
This is what our today’s trade in Nasdaq looks like
Were patiently waiting for price to trigger our entry point then were looking to catch over +points
Meta , Nvidia and apple are not doing the most as they’re the ones driving this price higher and higher !
Once our order is trigger and sniper entry
SL : 50 points from entry
Tp1 : 100points
Then let the rest running for over +300points
+-30 points in prove put SL at entry for safe trading
Cheers 🥂

Tesla to potentially retest $500, needs Nasdaq strengthDaily chart showing NASDAQ:TSLA sitting at support inside a downtrend channel, sort of resembling a flag pattern. There is potential that Tesla may bounce off the support, and find its way to breakout of the downtrend channel in a bullish move towards $500.
This is of course is completely dependent on what the overall NASDAQ does next $NASDAQ:NDX.
Note: NOT financial advice.

Breaking: Quince Therapeutics, Inc. (QNCX) Spike Over 300% Shares of Quince Therapeutics, Inc. (NASDAQ: NASDAQ:QNCX ) saw a noteworthy uptick of over 300% in Tuesdays extended trading it went further to extend gains to Wednesday premarket as the shares are up another 53% eyeing the $2 pivot amidst bullish sentiment.
The shares soared because the company has engaged LifeSci Capital to serve as its exclusive financial advisor.
This strategic move has spurred the stock some 300% higher Tuesday afternoon, with volume exceeding 1.1 billion shares.
Quince Therapeutics announced recently that it has engaged LifeSci Capital to explore strategic alternatives aimed at maximizing shareholder value, including potential partnerships and restructuring of the company's liabilities.
Options on the table include partnerships, joint ventures, mergers, acquisitions, licensing deals or other transactions, and LifeSci will also advise on any restructuring of the company's liabilities.
Albeit current sporadic surge of over 300%, according to 3 analysts, the average rating for NASDAQ:QNCX stock is "Hold." The 12-month stock price target is $10.0, which is an increase of 1,795.02% from the latest price.
About QNCX
Quince Therapeutics, Inc., a biopharmaceutical company, focuses on acquiring, developing, and commercializing therapeutics for patients with debilitating and rare diseases. The company’s lead asset candidature comprises EryDex for the treatment of rare pediatric neurodegenerative disease, including A-T, an inherited autosomal recessive neurodegenerative and immunodeficiency disorder caused by mutations in ATM gene.

XAU/USD | Waiting for NFP! (READ THE CAPTION)By examining the hourly chart of gold it seems that it has been consolidating in a certain range since yesterday and it's not moving neither down nor up, which makes sense given today is the NFP news release date (a few days later than usual).
Now, if Gold manages to go above 5086 and hold itself above there, it'll signal that it'll go higher. Now, we have to wait until after NFP numbers come out to make a move.
Targets for gold, if it goes above 5086 and holds itself there: 5100, 5115, 5130, 5145 and 5160.
If it fails to get there: 5035, 5020, 5005 and 4990.

Could the Dow Signal Weakness for the S&P 500 and Nasdaq 100?Looking at market positioning and key levels in Wall Street futures, I outline why a minor pullback may be due — and why the Nasdaq would be my preferred short if that scenario unfolds.
MS

Nasdaq Short Is Playing Out - TGT 24'080First, Nasdaq has failed to make a new high.
Then price dropped, missing the red CL by just a couple of points. Is this really a miss?
Let’s play: *What if…*
The white fork measured how far price could pull back. As we Forkers know, there was about an 80% probability that price would retrace to the white Centerline - and indeed, the CL was reached.
Now it looks like price is turning on a dime.
Next target: the red Centerline around 24,080–24,000.
Here I’m sharing some deeper insights on the lower time frames:
Questions and comments are always appreciated.

kvmev - XAUUSD outlook (update #1)Looking to take buys around 4902 upon clear retest and rejection of zone.


#USDJPY , Just be with Momentum 📊 Morning Market Brief | London Session Prep
🔎 Instrument Focus: #USDJPY
⚠️ Risk Environment: High
📈 Technical Overview:
Not a Quality setup ... and i don't wanna get trap by it ... when it be 100% clean , will take it
🚀 Trading Plan:
• LTF ENTRY NEEDED ‼️
• Just and Only for QuickScalp
🧠 Stay updated with real time news and macro events, visit 👉 @News_Ash_TheTrader_Bot
#Ash_TheTrader #Forex #EURUSD #MarketInsight #PriceAction #TradingPlan #RiskManagement #LondonSession #Scalping #Futures #NQ #Gold

NAS100 Multi-Timeframe OutlookMonthly → Weekly → Daily Elliott Wave Breakdown
This analysis walks through NAS100 from the macro structure down to the lower-timeframe execution view.
1. Monthly Timeframe – Macro Trend Still Intact
On the monthly chart, NAS100 is clearly trending within a well-defined rising channel, respecting both the median line and the lower boundary across multiple cycles.
Elliott Wave Context (Monthly):
- Price appears to be in a larger impulsive structure, with wave (iii) and (iv) already completed.
- The market is currently in a wave (5) impulsive phase.
- This impulse to remain contained within the rising channel.
- Despite the correction risk, this remains a bullish market structurally unless price decisively breaks the lower channel boundary.
2. Weekly Timeframe – Impulsive Structure Taking Shape
The weekly chart adds clarity to the monthly impulse wave currently unfolding.
Elliott Wave Context (Weekly):
- The market appears to be developing an extended wave 3 from its current context.
- Currently, we are now looking at the completion of wave i - ii of (iii).
- Once wave i finishes its completion, wave ii targets may be expected between 0.618 and 0.786.
Technical Structure
- Price remains inside a rising corrective channel.
- A breakdown toward the lower boundary would complete the corrective phase.
- Holding above that boundary keeps the larger bullish thesis alive.
3. Daily Timeframe – Short-Term Volatility & Execution Zone
The daily chart is where the last phase of wave i becomes actionable.
Elliott Wave Context (Daily)
- A smaller wave 5 (encircled) is on its development.
- Minor wave (encircled) may still be forming, potentially as a regular flat. If not, then wave 5 (encircled) is confirmed.
- Once wave 1 (encircled) is reached, the daily timeframe analysis before the completion of wave 5 (encircled), the daily count becomes invalidated. However, this doesn't mean that the weekly and monthly outlook is invalidated as well. It will just require a recount in the Daily perspective to align it with the weekly and monthly timeframes.
Macro & Economic Factors to Watch
Several external forces may influence price behavior over the coming weeks and months:
1. Monetary Policy & Rates
- Markets remain sensitive to interest rate expectations
- Any persistence in higher-for-longer rates pressures growth-heavy indices like NAS100
2. Geopolitical Risk
- Ongoing geopolitical tensions add risk-off flows
- Tech equities often underperform during uncertainty spikes
3. Earnings & Valuation Compression
- High valuations leave little room for disappointment
- Even strong earnings can result in sell-the-news reactions
These factors support the technical case for a controlled correction, rather than an immediate continuation higher.
Outlook Summary
Long-term trend: Bullish and intact
Medium-term: Bullish
Short-term: Bullish followed by a Bearish movement
All Fibonacci measurements, from the smallest impulsive waves to the macro retracements, are converging toward the same zones, reinforcing the validity of the projected targets.

eBay - Breaking Down the StructureLet’s take a look at eBay stock from the very beginning up to today:
What do we see?
A completed wave structure and an almost completed Fibonacci structure as well.
The peak came in at 101 , which is close to the 105 Fibonacci level.
Now let’s zoom in on the larger fifth wave:
The move started in late September 2022, and this structure also looks complete.
The corrective move from mid-August 2025 confirms this.
A push toward 105 looks unlikely, though it can’t be completely ruled out.
Either way, the broader bias remains to the downside.
For now, let’s focus on the smaller timeframe,
specifically the fifth wave on a lower degree.
Key targets:
75
71
66
The potential move from the current level is 14-23% .
On a broader scale, a sizable correction within the fifth wave is expected.
---
Subscribe and leave a comment.
You’ll get new ideas faster than anyone else.
---

USNAS100 | Stabilization Above Pivot Signals UpsideUSNAS100 | Stabilization Above Pivot Supports Upside
The Nasdaq rebounded from 24970 and has now stabilized above the 25230 pivot, signaling improving bullish momentum.
Technical Outlook
As long as price remains above 25230, upside continuation is expected toward 25410, followed by 25610 and potentially 25835.
A 1H candle close below 25230 would invalidate the bullish scenario and trigger a pullback toward 24960.
Key Levels
• Pivot: 25230
• Support: 24980 – 24785
• Resistance: 25410 – 25610 – 25835

XAU/USD | Will it reach the 5100 level again? (READ THE CAPTION)Gold went up as high as 5086 last night, failing to go above the 5091 level to sweep the liquidity and dropped, currently being traded at 5033, and has been consolidating in that range for a while now. If gold holds itself above the Jan 26th NWOG and makes it through the Vol Imbalance created last night, I can see it go for the buyside liquidity above and the Daily IFVG at 5111.
Targets for Gold: 5040, 5055, 5070, 5095 and 5110.
If it fails to go above the Vol Imbalance and fall into the Jan 26th NWOG, the targets will be: 5020, 5005, 4990 and 4975.
