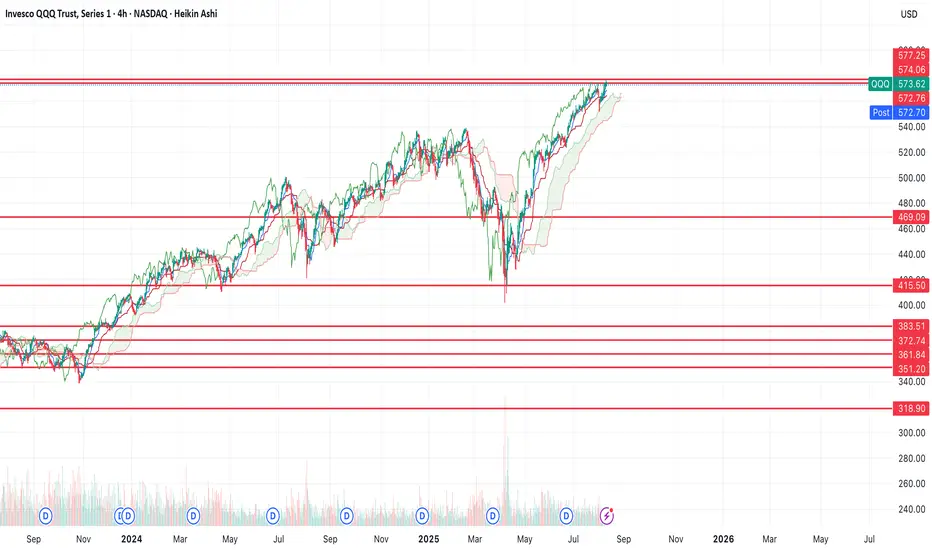
Has QQQ topped? Levels to the downsideI think we've seen a top here with the reversal that happened today. My levels held on SPY and that makes me more convinced the Nasdaq will have the same fate.
The top looks much clearer on Nasdaq futures. We have a double top, should the highs of today hold.
If you were to run a trend line through price, you'd see that all we've done on this rally is backtested the trend line from the April lows and have found resistance.
I think the next move is likely a large move down towards the lower support levels. Potentially CPI tomorrow is the catalyst.
Let's see where we end up, but I think it'll be one of the lower support levels should the highs hold throughout the week.
Nasdaq
"Gold’s Next Big Move? The Hidden Entry Zone Smart Money "Gold’s Next Big Move? The Hidden Entry Zone Smart Money is Watching!"
Gold (XAUUSD) is currently consolidating after a series of higher lows, signaling sustained bullish momentum from the strong support region around $3,280–$3,300. Price has respected key structural points, forming a clean market structure with:
BOS (Break of Structure) confirming bullish intent after reclaiming prior resistance.
Bullish FVG (Fair Value Gap) acting as a liquidity zone for potential re-entries.
Multiple Higher Lows, highlighting strong buyer defense levels.
The chart indicates a possible short-term retracement into the $3,350–$3,357 entry zone, which aligns with demand structure. From this zone, buyers are expected to push toward the $3,400–$3,415 resistance target.
Key technical levels:
Entry Zone: $3,350–$3,357 (demand area)
Stop Loss: Below $3,340 to protect against deeper pullbacks
Take Profit: $3,400 psychological level and $3,414 structural resistance
Market Sentiment:
The combination of a strong support base, sustained higher lows, and bullish imbalance zones suggests a favorable risk–reward setup for long positions. A clean breakout above $3,415 could trigger a larger bullish leg toward the $3,440 resistance zone.
📈 Bias: Bullish above $3,350
💡 Watch for a reaction at the entry zone before committing to positions.

XAU/USD | Gold at Make-or-Break $3400! BUY or SHORT ? (READ)By analyzing the gold chart on the 4-hour timeframe, we can see that, as expected from the previous analysis, the price began to rise and gained over 250 pips, reaching the $3409 supply zone. Upon hitting this key level, gold faced selling pressure and dropped more than 290 pips down to $3380. When it returned to this important level, strong buying stepped in again, and it is now trading around $3391.
The total return from this analysis so far has been over 540 pips. If gold manages to hold above $3400, the next upside targets will be $3409, $3416, and $3419. Keep an eye on the $3419–$3434 zone for potential reactions. Show some strong support for this analysis, friends, and stay tuned for direct trade setups based on it!
THE Previous Analysis :
Best Regards , Arman Shaban

NASDAQ Short This is at the all-time high, showing a lot of resistance
There is an AABCD pattern on H1
All timeframes are overbought
There are multiple tops on M15 and M30 with divergence
Stop loss of 150 pips

USNAS100 | Consolidation Before CPI –Breakout or Pullback Ahead?USNAS100 Overview
The index reached its all-time high ahead of recent speculation about a potential Fed rate cut. This week’s CPI data will be a key driver, indicating whether the Fed may cut rates in the near term.
Technical Outlook:
As long as the price trades below 23640–23690, a decline toward 23530–23435 is expected. A break below this zone could extend the drop toward 23295.
A 1H close above 23695 would turn the outlook bullish, targeting 23870.
Support: 23535, 23435, 23295
Resistance: 23870, 24040
previous idea:

NAS100 - Stock market awaits an important week!The index is above the EMA200 and EMA50 on the four-hour timeframe and is trading in its ascending channel. If the index corrects downwards towards the drawn trend line or the specified demand zone, you can buy Nasdaq with better reward for risk.
Many Federal Reserve officials believe that tariffs could weaken the U.S. economy and push inflation higher—a dilemma that forces policymakers to choose between cutting interest rates to support growth or keeping them unchanged to control prices.
However, Miran—the economic adviser President Donald Trump intends to nominate to the Fed’s Board of Governors—rejects this view. He argues that tariffs will ultimately benefit the economy and will not significantly impact prices, allowing the Fed to resume the rate-cutting cycle it halted earlier this year.
The key question now is whether Miran’s arguments will be persuasive enough to sway the broader thinking of the central bank’s policy committee, or whether concerns over labor market weakness might prompt rate cuts regardless, rendering his arguments unnecessary.
According to analysis from The Wall Street Journal, beyond the policy disagreements, Miran has also challenged the institutional legitimacy of the Federal Reserve. He has accused Fed officials of having political motivations and criticized them for what he calls the “tariff disruption syndrome.” In a paper published last year, he argued that all senior Fed officials should be subject to dismissal at the White House’s discretion. If appointed, he would give Trump a loyal ally inside the Fed’s boardroom—someone capable of promoting the president’s views and challenging the institution’s consensus-driven culture and influential research staff.
Meanwhile, JPMorgan has revised its monetary policy forecast for 2025, now expecting the Fed to deliver three 25-basis-point rate cuts starting in September 2025, compared to its earlier projection of just one cut in December.
Miran, who holds a Ph.D. in economics from Harvard University, currently serves as Chairman of the White House Council of Economic Advisers. On Thursday, Trump announced his intention to nominate him for a newly vacant Fed board seat. This position became available unexpectedly after Adriana Kugler’s resignation last week and will expire in January. Trump also revealed plans to nominate another individual to fill this seat, who could potentially replace Jerome Powell as Fed Chair in the spring. Miran’s appointment would give Trump additional time to evaluate how candidates—whether Miran himself or Christopher Waller, whom he appointed during his first term—align with his policy views and vote on interest rates.
This week’s economic calendar is once again crowded, with a series of key inflation reports and consumer-related indicators in the spotlight.
Early Tuesday, the Reserve Bank of Australia will announce its interest rate decision, with markets expecting a 25-basis-point cut from 3.85% to 3.60%. Shortly after, traders’ attention will shift to the U.S. Consumer Price Index (CPI) for July, where core inflation is expected to rise from 0.2% in June to 0.3%.
Wednesday will be relatively quiet, with the main highlight being speeches from Fed officials Austan Goolsbee and Raphael Bostic. On Thursday, focus will return to major data releases, including the U.S. Producer Price Index (PPI), which is projected to see its core measure increase by 0.2% after holding steady in June. Weekly jobless claims figures will also be released that day.
The week will conclude with a broader look at U.S. consumer activity. July retail sales are forecast to slow from 0.6% to 0.5%, while core retail sales are expected to drop from 0.6% to 0.3%. Hours later, the preliminary August reading of the University of Michigan Consumer Sentiment Index will be released, providing insights into consumer expectations and confidence.
According to ISM data, pricing pressures have eased in the manufacturing sector but have jumped sharply in the services sector, which makes up a much larger share of the U.S. economy. This suggests that upcoming CPI and PPI reports carry an upside risk relative to forecasts. Inflation readings above expectations—even before fully factoring in the impact of retaliatory tariffs—could erase part of the market’s anticipated rate-cut outlook.

NasdaqAs said before, nasdaq going down, can take out highs then plummet, but time will tell. PS: my previous posts got removed. View auto supply and demand zones indicator. Dm me free for a month free. (It draws snd zones).

NASDAQ (NQ1!): Bullish! Buy The Pullbacks!Welcome back to the Weekly Forex Forecast for the week of Aug 11 - 15th.
In this video, we will analyze the following FX market:
NASDAQ (NQ1!) NAS100
The NASDAQ is strong and moving higher. No reason to look for sells.
Wall Street advanced on Friday, taking indexes closer to a strong weekly finish, after President Donald Trump's interim pick for a Federal Reserve governor post kept expectations alive for a dovish policy.
The structure is bullish, with supports for higher prices. Wait for a pullback to discount arrays and buy it!
Enjoy!
May profits be upon you.
Leave any questions or comments in the comment section.
I appreciate any feedback from my viewers!
Like and/or subscribe if you want more accurate analysis.
Thank you so much!
Disclaimer:
I do not provide personal investment advice and I am not a qualified licensed investment advisor.
All information found here, including any ideas, opinions, views, predictions, forecasts, commentaries, suggestions, expressed or implied herein, are for informational, entertainment or educational purposes only and should not be construed as personal investment advice. While the information provided is believed to be accurate, it may include errors or inaccuracies.
I will not and cannot be held liable for any actions you take as a result of anything you read here.
Conduct your own due diligence, or consult a licensed financial advisor or broker before making any and all investment decisions. Any investments, trades, speculations, or decisions made on the basis of any information found on this channel, expressed or implied herein, are committed at your own risk, financial or otherwise.

NASDAQ Potential UpsidesHey Traders, in today's trading session we are monitoring NAS100 for a buying opportunity around 23,300 zone, NASDAQ is trading in an uptrend and currently is in a correction phase in which it is approaching the trend at 23,300 support and resistance area.
Trade safe, Joe.

Nasdaq Week 33 Possible OutlookAre we ready to drop this coming week? Lookout for reversal/continuation pattern under smaller TF.

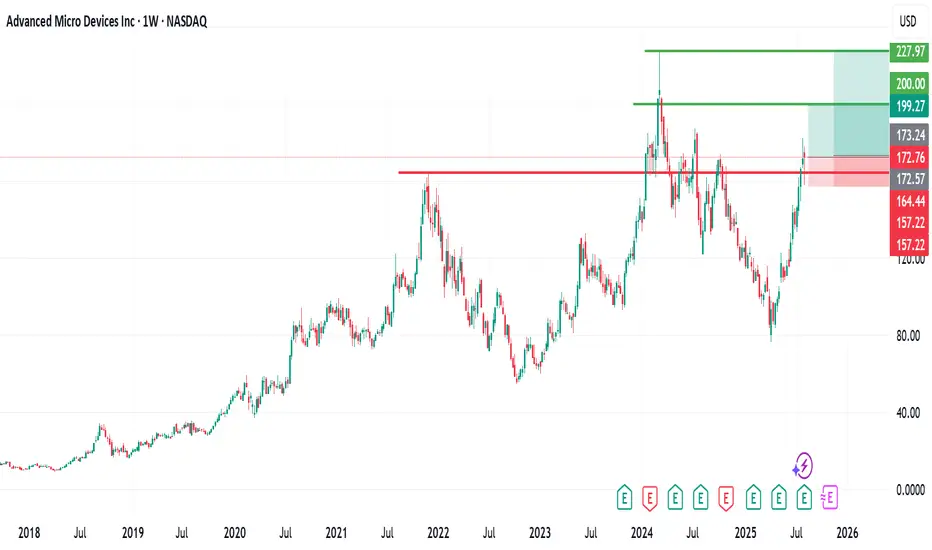
Advanced Micro Devices (AMD) Stock AnalysisAdvanced Micro Devices (AMD) Stock Analysis
AMD, listed on NASDAQ, has generally been on an upward trend. However, last week, the stock experienced a brief flash downturn, dropping to around the $157 level.
Since then, it has recovered and is currently trading at approximately $172 per share.
Outlook:
I remain bullish on AMD and anticipate a potential move toward the $200 level, with a longer-term target around its all-time high near $226.
For my entry strategy, I have added positions at different levels, with an initial entry around $160 and another at the current level.
This gives me a total of three buy entries, positioning for a mid- to long-term hold.
Let’s see how it unfolds! If you have any insights or thoughts, please share them in the comments. I’d love to connect with you. Don’t forget to follow, share, and subscribe. Thank you.
US100 Local Long!
HI,Traders !
#US100 made a retest
Of the horizontal support
Level of 23266.0 from where
We are already seeing a
Local bullish rebound so
We will be expecting a
Further bullish move up !
Comment and subscribe to help us grow !

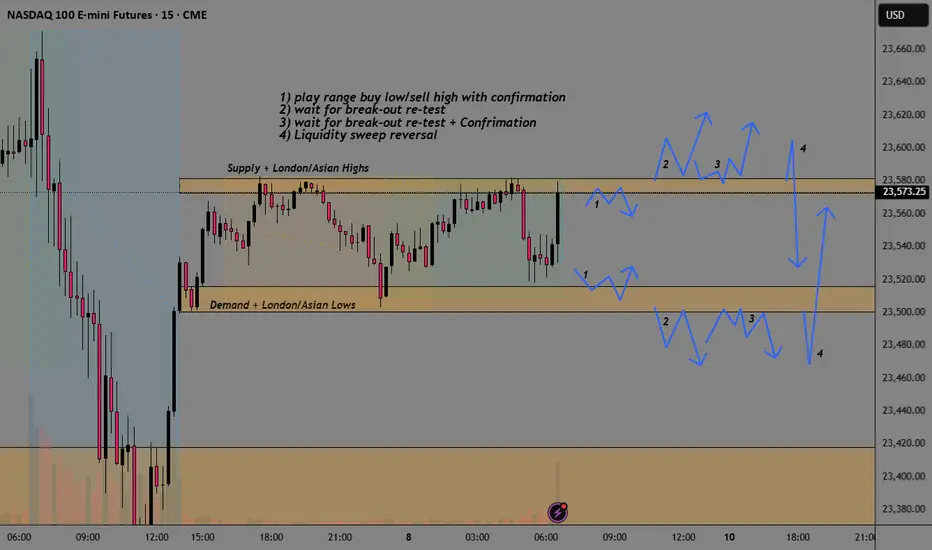
NQ Break-Out AnalysisSee chart from analysis of different options depending on the type of trader and what others are looking at.
1) play range buy low/sell high with confirmation
2) wait for break-out re-test
3) wait for break-out re-test + Confirmation
4) Liquidity sweep reversal
NQ long thursdays reversalmultiple SSMTs on the weekly and daily cycles
Expecting to do a 1-1 of the current range

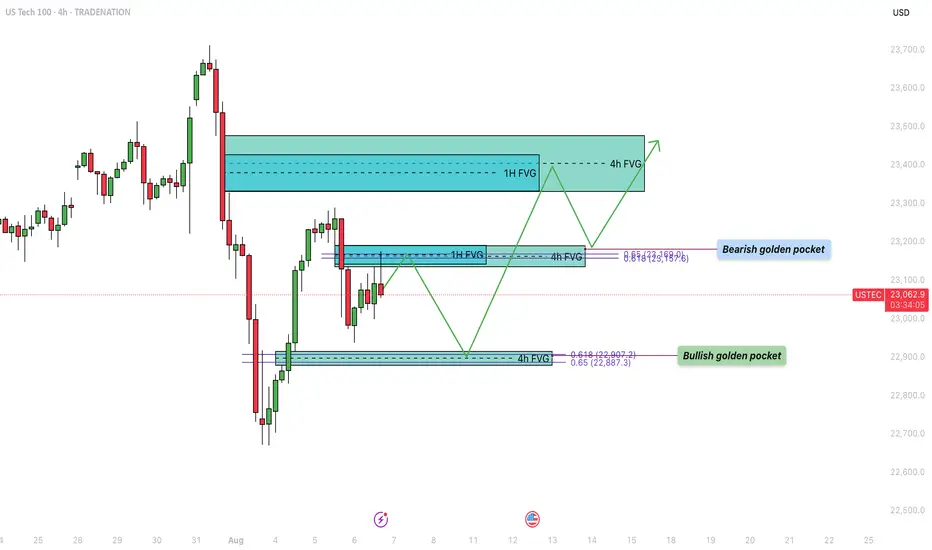
US100 - Bullish trajectory to fill the inbalance zones!Over the past week, the US Tech 100 (US100) experienced a sharp decline, dropping into a significant support zone. During this bearish move, several fair value gaps (FVGs) formed on both the 4-hour and 1-hour timeframes, which remain unfilled. Currently, price action is retracing upward, aiming to fill these imbalances. The structure of the market suggests that both bullish and bearish scenarios are in play, depending on how price reacts to key levels marked by these FVGs and Fibonacci retracement zones.
Bearish Resistance
The first major area of resistance is located around the $23,160 level, which has just been tapped. This zone presents a strong potential turning point due to the confluence of a 1-hour and a 4-hour fair value gap, which perfectly align with the 0.618–0.65 Fibonacci retracement level, also known as the golden pocket. This cluster of technical signals increases the probability that this level will act as a strong supply zone, potentially initiating a rejection back toward the lower support area.
Bullish Support
On the downside, a key level to watch is around $22,900. This zone marks a 4-hour FVG that was formed during the recent upward move. Importantly, this area also coincides with the golden pocket from that very same leg up, offering a compelling confluence for bullish support. If price revisits this level, it may act as a strong demand zone, providing a springboard for the next leg higher, particularly if buyers step in aggressively to defend it.
Bullish Trajectory
If support at $22,900 holds, the bullish trajectory suggests a possible continuation toward the $23,400 region. This upper target contains a large overlapping 1-hour and 4-hour FVG that remains unfilled. Historically, price tends to revisit and fill such imbalances before choosing a definitive direction. A bounce from the lower support zone and a successful break of the $23,160 resistance could pave the way for a clean move toward this higher target, completing the FVG fill sequence.
Final Thoughts
The US100 is currently navigating a key technical crossroads. With multiple unfilled fair value gaps and well-aligned Fibonacci levels on both the upside and downside, the next few sessions will be critical in determining short-term direction. If the $23,160 resistance continues to hold, a pullback to $22,900 could offer a high-probability long setup, while a clean break above this resistance opens the door to filling the higher FVGs.
-------------------------
Disclosure: I am part of Trade Nation's Influencer program and receive a monthly fee for using their TradingView charts in my analysis.
Thanks for your support. If you enjoyed this analysis, make sure to follow me so you don't miss the next one. And if you found it helpful, feel free to drop a like 👍 and leave a comment 💬, I’d love to hear your thoughts!
USNAS100 Gains on Tariff Exemption Hopes – 23690 in SightUSNAS100 – Market Overview
Tech shares lift Wall St futures on tariff exemption hopes
U.S. stock index futures rose on Thursday as optimism grows that major tech companies may be exempt from President Trump’s latest tariffs on chip imports, supporting continued strength in the tech sector.
Technical Outlook
USNAS100 has gained nearly +400 points since yesterday, maintaining strong bullish momentum.
As long as the price holds above 23440, the uptrend is expected to continue toward 23690, with potential to extend to 23870.
However, a 1H close below 23440 would suggest weakening momentum and could trigger a correction toward 23295.
Resistance: 23690 – 23870
Support: 23295 – 23045

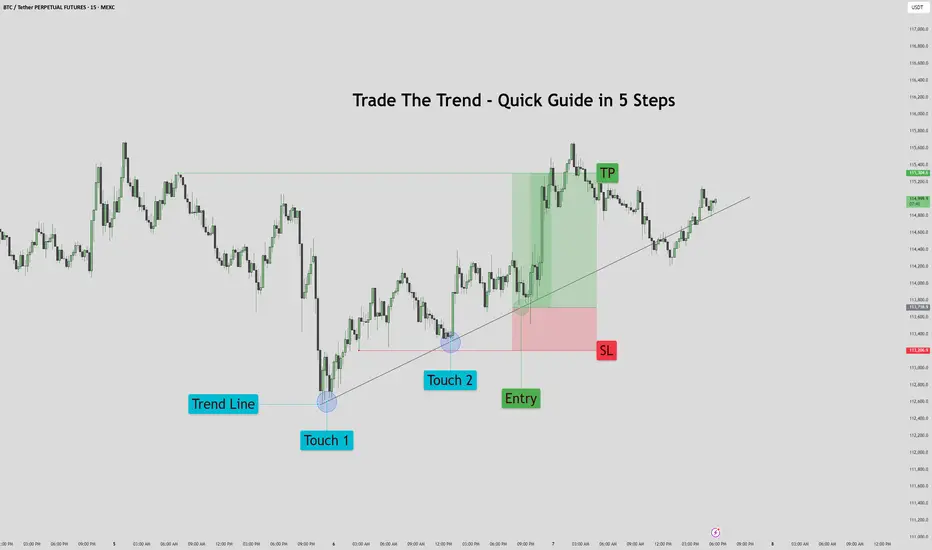
Trade The Trend – Quick Guide In 5 StepsWhat is Trading the Trend?
Trading the trend means buying when the market is going up, and selling when it’s going down.
You're following the direction of the market, not fighting it.
If the trend is up:
Price makes higher highs and higher lows
You look for chances to buy (go long)
If the trend is down:
Price makes lower highs and lower lows
You look for chances to sell (go short)
Why it works:
You’re going with momentum
Simple rule:
Buy in an uptrend, sell in a downtrend — never trade against the flow
1. Assess the chart. Where is it headed? It's headed up.
2. Place your trend line by connecting the first two points.
3. Let the chart play out for a bit. Afterwards prepare your entry on previous failed trend line retest. Set your stop loss below the previous trend line retest, and your TP just before the previous sweep above.
4. Proceed to let the chart play out, then set your pending order.
5. Watch the Trade enter and play out with patience.
This method works for bearish trends as well, just reversed.
If you would like to see more 5 step guides, comment down below.
Thank you!
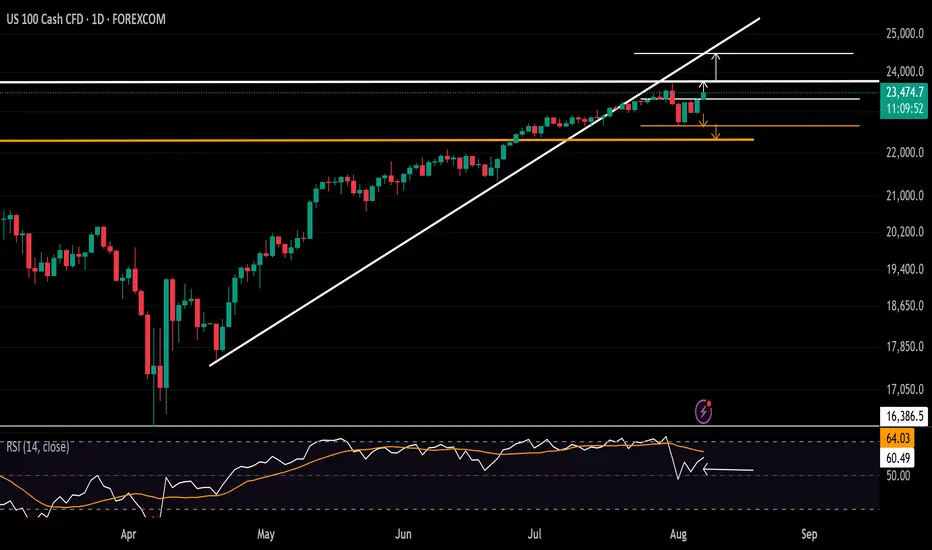
Nasdaq Eyes Record Highs Once AginNasdaq faces pressure as it trades below the trendline connecting the consecutive higher lows from April 2025. However, the latest decline rebounded from strong support at 22,700. Price action has reclaimed the 23,000 and 23,400 levels, suggesting a potential shift in tone.
A clean close above 23,500 is likely needed to push the index toward new highs above 23,700. From there, price may either pull back or continue an extended rally toward 24,000 and 24,400.
On the downside, if price falls back below 22,700, the risk increases for a move toward the previous key peaks from 2025 near 22,400 and 22,200.
- Written by Razan Hilal, CMT
Nasdaq 100: Institutional Move Toward 22,680 Unfolding📊 Nasdaq 100 Smart Money Breakdown
Current Price: 22,103
Target Price: 22,680
🔼 Upside Potential: +577 points
The market is currently positioned for a premium retracement move after a recent liquidity sweep below short-term equal lows, which likely triggered sell-side liquidity. This setup hints at Smart Money Accumulation, with institutions entering long positions at discount pricing.
We're now seeing:
✅ Break of Structure (BOS) to the Downside
✅ Internal liquidity sweep
✅ Price reacting from a discounted OB (Order Block)
✅ Potential drive toward the next liquidity pool sitting above the 22,680 level.
This move aligns with a bullish market structure shift, suggesting Smart Money is engineering price higher to target buy-side liquidity above recent highs.
🎯 Target: 22,680 – a key liquidity area where Smart Money may look to offload positions.

Support & Resistance – Quick Guide In 5 StepsSupport and resistance are key concepts in technical analysis that help traders identify where price is likely to react.
Support acts like a floor — a level where buying interest is strong enough to prevent further declines.
Resistance acts like a ceiling — a level where selling pressure can stop price from rising.
These zones often lead to bounces, reversals, or breakouts, and are used to plan entries, exits, and stop-losses.
How to Identify them:
1. Assess the chart.
2. Identify Swing Points: Look for repeated highs/lows and label them. (Flags)
3. Multiple touches: Highlight the zones with multiple touches. 2+ Touches are stronger.
4. Define: Clearly define the zones. Above is resistance, below is support.
5. Entry: When price makes it way down to support, wait for the reversal. Upon reversal enter on the low time confirmation. Ensure price has failed to break below the support.
Then set TP to the previous High/Resistance zone.
Tips:
Always treat S&R as zones, not exact lines.
Combine with trend, candlestick patterns, or volume for better confluences.
Avoid trading into strong S/R — wait for breaks or retests.

Market Gains on Fed Optimism – Will 23440 Be Reached?Wall Street Edges Up Amid Fed Rate Cut Optimism; Earnings in Focus
U.S. stock indices rose on Wednesday, supported by growing expectations of Federal Reserve rate cuts later this year. Investors are also closely monitoring a fresh wave of corporate earnings, which continues to influence sentiment.
Technical Outlook
The price is currently holding above the key pivot level at 23045.
As long as it remains above this level, bullish momentum is expected to continue toward 23180 and 23295.
A confirmed breakout above 23295 would likely extend the rally toward 23440.
⚠️ On the other hand, a 1H close below 23045 would shift momentum to bearish, targeting 22870 and possibly 22725.
🔹 Resistance Levels: 23180, 23295, 23440
🔹 Support Levels: 22870, 22725

BCH May Be The Next MYX - 5-10x Coin TL;DR – BCH is lining up a classic supply-shock + utility-boom setup.
Halving has already cut new coins 50 %, while CashTokens + May-25 upgrade unlock real smart-contract demand. Fees are still < $0.01 so merchants keep onboarding, and Wall-Street-backed EDX just gave institutions a clean on-ramp. With on-chain volume at multi-year highs and regulatory clouds clearing (CLARITY Act), even a modest uptick in adoption can squeeze a float that’s shrinking fast. Add it up and the 10 factors below paint a clear path for BCH to re-rate well beyond current levels.
Post-halving supply squeeze – The 2 April 2024 halving cut block rewards 50 % to 3.125 BCH, slashing new supply while demand stays constant.
May 2025 protocol upgrade – Adds VM Limits & BigInt, letting devs deploy more complex smart-contracts directly on BCH.
CashTokens layer live – Since May 2023, anyone can mint fungible tokens & NFTs; 26 000+ tokens launched in the first 24 h.
Institutional on-ramp via EDX Markets – Wall-Street-backed exchange lists BCH next to BTC & ETH, unlocking RIA and pension flows.
Ultra-low fees (< US $0.01) & 32 MB blocks – Makes BCH practical for point-of-sale payments while BTC fees hover near US $2.
Growing merchant footprint – BCH ranks #4 on Crypwerk; BitPay shows alt-coin check-outs (inc. BCH) now 36 % of crypto payments.
On-chain activity surging – Daily tx count ~53 k; social buzz has pushed BCH to new 2025 highs, signaling fresh interest.
Regulatory clarity coming (CLARITY Act 2025) – Likely to classify many tokens as commodities, reducing U.S. legal overhang.
Re-rating potential – Still 60 % below 2021 high; a modest multiple expansion on revived fundamentals could move price sharply.
Positive momentum & analyst targets – After reclaiming US $600, several desks now project a move toward US $1 000 this cycle.
Marty Boots | 17-Year Trader — smash that 👍👍, hit LIKE & SUBSCRIBE, and share your views in the comments below so we can make better trades & grow together!

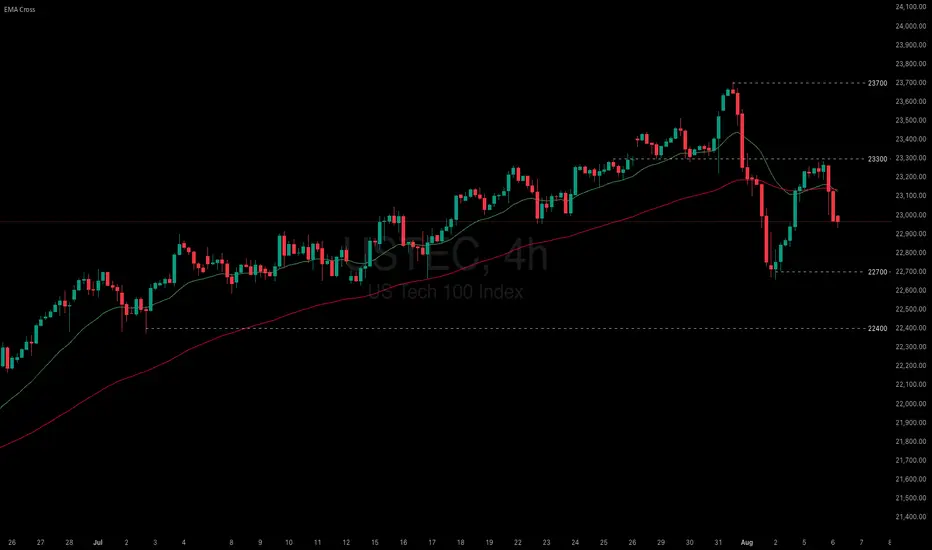
US indices paused as fragile macro data undermined recent gains
US equity gains paused amid President Trump’s renewed tariff threats and weakening economic data. Trump warned of steep tariff hikes on India and a potential 35% levy on the EU if obligations are not met. Meanwhile, the US July Services PMI fell from 50.8 to 50.1, missing the 51.5 consensus. New orders dropped to 50.3, while employment declined to 46.4—the lowest since March.
USTEC briefly tested 23300 before breaking below both EMAs. The widening gap between EMA21 and EMA78 suggests a potential shift toward bearish momentum. If USTEC fails to break above the resistance at 23300, the index could decline further toward 22700. Conversely, if USTEC breaks above both EMAs and 23300, the index may gain bullish traction toward 23700.