EUR/USD | Euro Preparing for a Bearish Reversal Zone! (READ)By analyzing the EURUSD chart on the 6H timeframe, we can see the price trading around 1.1590. I expect a small push upward first, followed by a potential rejection from the 1.16085–1.1640 zone. If we get a strong rejection there, a powerful bearish move could follow.
This bearish scenario only fails if the price breaks above 1.1660.
Please support me with your likes and comments to motivate me to share more analysis with you and share your opinion about the possible trend of this chart with me !
Best Regards , Arman Shaban
Nasdaq

Nvidia (NVDA) Price Action Statistics Around EarningsWith Nvidia set to release earnings after the US close on Wednesday, I take a look at recent price action around past reports, the Nvidia chart and the Nasdaq.
Matt Simpson, Market Analyst at City Index.

Nasdaq 100: Bulls on the Back Foot as 50DMA Gives WayOur Nasdaq 100 contract is looking heavy. Very heavy.
The price action has been increasingly unconvincing for bulls in November, culminating on Monday with the price closing beneath the 50-day moving average for the first time since April. That’s a noticeable departure from what was seen when tested in the recent past, with the price often reversing higher immediately after. Not on this occasion.
Should the price remain below the 50-day moving average, the next focal point is uptrend support that’s been in place for over six months. In each of the past two sessions the price has traded through the level only to reverse higher, attracting buyers on dips beneath 24650—that’s the battleground to watch in the near term.
If the price were to close beneath uptrend support and 24650, it would bolster conviction that a deeper downside flush may be coming, allowing for shorts to be established with a stop above the uptrend to protect against reversal. 24000 provided support and resistance earlier this year, making it a potential initial target.
Of course, should the price remain above the uptrend, the setup could be flipped with longs set above it or the 50DMA, should the price reclaim it. 25200, downtrend resistance from the record highs, or 25715 are all potential targets. Given the unconvincing price action recently, an obvious bullish reversal signal would be preferable before considering long setups.
The message from RSI (14) and MACD is tilted lower when it comes to directional bias, with the former trending beneath 50, indicating building bearish pressure. MACD remains in positive territory, although having already crossed the signal line from above, at the very least it’s indicating waning topside strength. Given its trajectory, it may soon confirm the bearish signal.
Good luck!
DS

MSTR – Approaching Major Support as Downtrend ContinuesMicroStrategy remains in a clear higher-timeframe downtrend, and if Bitcoin continues to weaken, NASDAQ:MSTR could slide further toward the next major support level — now sitting roughly 63% below its all-time high. This zone may act as a potential reversal area, especially if market sentiment stabilizes.
Trade Setup:
• Entry Zone: $170 – $180
• Take Profit Targets:
🥇 $280
🥈 $360
• Stop Loss: $122

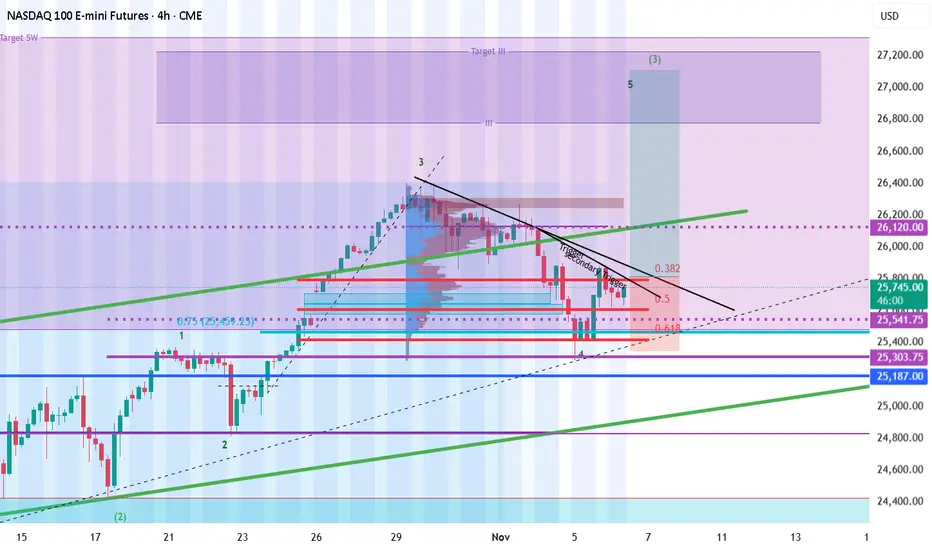
NASDAQ Can the 1D MA50 give one more rally??Nasdaq (NDX) has been trading within a 6-month Channel Up and Friday saw the price breaking below its 1D MA50 (blue trend-line) and the pattern, but managed to close back above it for the 2nd time in a week (blue circles).
This resembles the September 02 break, which eventually also closed above it and initiated a +9.59% Bullish Leg. With the 1D RSI also testing a similar Support Zone with September's, we expect the index to initiate the new Bullish Leg, as long as it continues to close its daily candles above the 1D MA50.
Our Target is 26900 (+9.59%).
---
** Please LIKE 👍, FOLLOW ✅, SHARE 🙌 and COMMENT ✍ if you enjoy this idea! Also share your ideas and charts in the comments section below! This is best way to keep it relevant, support us, keep the content here free and allow the idea to reach as many people as possible. **
---
💸💸💸💸💸💸
👇 👇 👇 👇 👇 👇

NAS100 Trade Plan: Counter-Trend Opportunity Into Friday CloseI’m currently watching the NASDAQ NAS100 📊 and looking for a potential setup as we head into the Friday close. The market has pushed into the weekly low, and I’m anticipating the possibility of a retracement, which could offer a counter-trend opportunity during the New York session. 🚀📉📈 All details are broken down clearly in the video — this is not financial advice. ⚠️

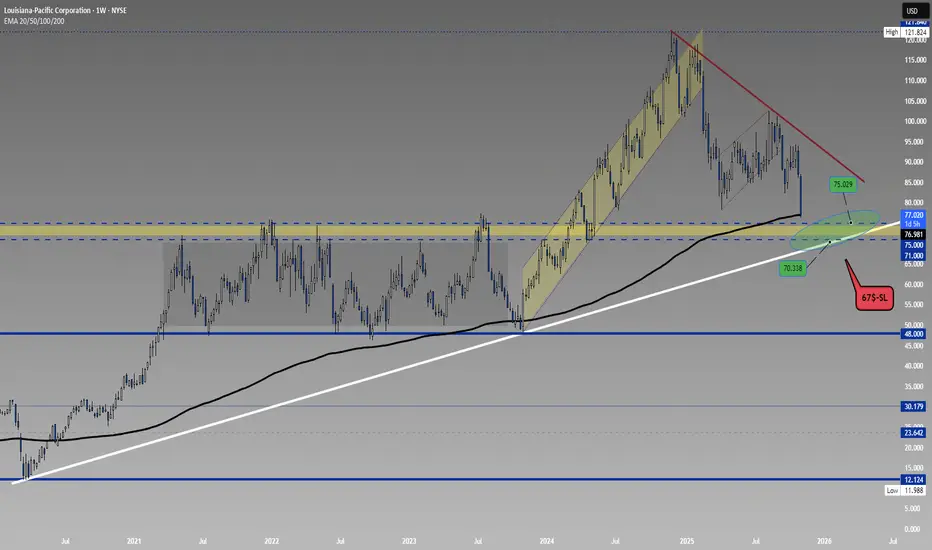
LPX Weekly Outlook!LPX is currently on its weekly EMA! After starting its decline from $121, LPX is now approaching the long-term ascending channel support. At the same time, this region coincides with a horizontal support zone between $71–75, which could offer a good buying opportunity but it’s important to watch the price closely.
If the price closes below $70, levels around $48 could come into play. The stop loss should be placed at $67.
Wishing everyone profitable trades!
US100 | Bullish Reversal From Demand Zone — Targeting 25,200 LiqUS100 has reacted strongly from the 24,400–24,900 major demand zone, showing a sharp rejection and reclaiming structure. Price is now building momentum toward the 25,200 buy-side liquidity level.
A clean consolidation + breakout pattern is forming just below liquidity, indicating potential continuation to the upside.
Market Breakdown:
HTF Bias: Bullish
Demand Zone: 24,400 – 24,900
Intraday Target: 25,201 liquidity zone
Extended Target: 25,722 (major buy-side liquidity)
Confirmation: Break & retest above 25,100
Invalidation: Clean break below 24,950

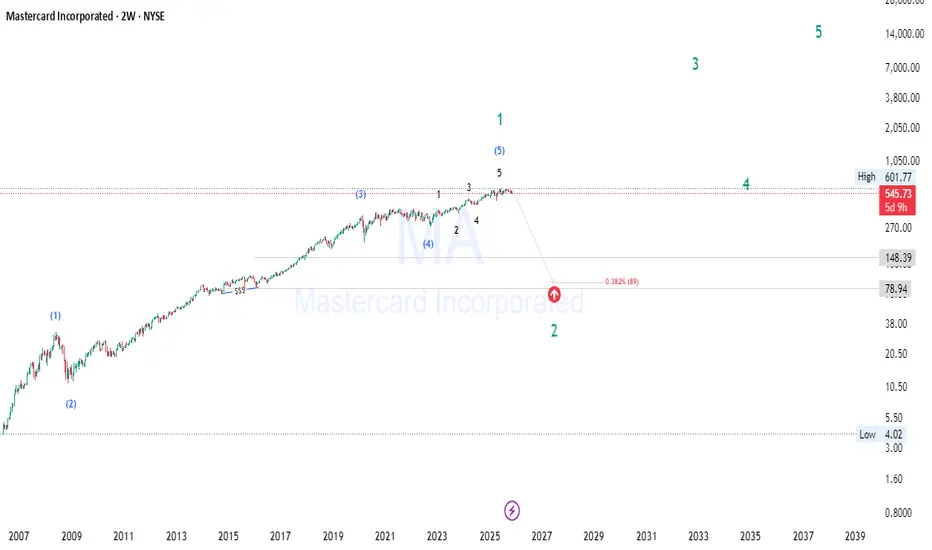
Mastercard (MA) Hits Key Cycle Top — Correction Incoming!🧠 Mastercard (MA) — In-Depth Multi-Framework Market Analysis
Mastercard’s long bull run has matured into a classic Wave 5 exhaustion.
Multiple frameworks agree: a deep corrective phase is likely ahead.
Understanding market structure, smart money moves, and Fibonacci levels can help you navigate this reset .
🌀 Wave Theory & Elliott Wave Context
Mastercard’s chart shows a clear completed 5-wave impulsive structure spanning roughly 15+ years, typical of a major secular bull cycle. The small sub-waves within Wave 5 suggest final exhaustion:
Wave 5 ending near key Fibonacci extensions signals an exhaustion climax.
After such extended waves, expect a significant corrective ABC pattern or even a complex correction resetting much of the prior gains.
The correction here is likely a large Wave 2 on the higher degree, meaning the retracement could be deep and prolonged, typically lasting multiple years.
📉 Market Structure Breakdown & Key Price Action Signals
Price has failed to push to new highs with conviction, showing lower highs and a breakdown of previous support levels.
This breakdown in market structure suggests the shift from an accumulation or markup phase to distribution and markdown.
Multiple wick rejections and volume spikes near highs imply liquidity sweeps and stop hunts by institutions, signaling transfer of risk.
Price action shows signs of fatigue — smaller candles, overlapping bars, and diminished momentum — classic exhaustion signals.
🧠 Smart Money Concepts (SMC)
Institutional players often engineer liquidity grabs above key levels (stop hunts) to shake out retail participants.
The immediate reversal following those liquidity grabs is a hallmark of distribution , where "smart money" sells into retail enthusiasm.
The absence of strong demand at these levels reinforces the notion of a shift from bullish to bearish control.
📊 Fibonacci Retracement & Extension Levels
Wave 5 terminated near the 2.618 Fibonacci extension , an extreme but well-documented exhaustion zone for extended impulses.
The retracement target aligns with the 0.382 Fibonacci retracement (~$89–95) , the first major support for Wave 2 corrections.
More conservative estimates place support near 0.5–0.618 retracement , which historically mark deep correction zones in longer cycles.
These levels also coincide with significant prior consolidation zones, increasing their validity as support.
💼 Fundamental Context & Market Cycles
Mastercard’s underlying fundamentals remain solid, with strong revenue growth and market dominance.
However, market cycles are driven by liquidity and psychology — no fundamentally strong company is immune to price corrections during macro resets.
This correction could coincide with broader economic or sector rotation phases, impacting valuation multiples and capital flows.
🔮 Strategic Outlook & Trading Implications
Expect a multi-year correction phase , potentially volatile, with several retracements and consolidations along the way.
Patience is key: major Wave 2 corrections often shake out weak holders and reset risk/reward dynamics for the next bull phase (Wave 3).
Traders should look for confluence zones combining Fibonacci support, prior market structure, and volume profile for entries.
Watch for price action confirmation of a base formation before resuming a bullish stance.
💡 Key Takeaways for Traders
Long-term cycle completion means caution: avoid chasing new highs here.
Use Fibonacci and wave structure to anticipate price targets and exits.
Monitor volume and liquidity sweeps to identify distribution phases.
Be prepared for deep, sometimes painful corrections even in high-quality stocks.
Focus on risk management and position sizing during volatile cycle resets.
Stay ahead of the market — follow for advanced wave counts, Fibonacci setups, and smart money insights.
Comment 👇 your ticker to get a personalized deep-dive analysis next! 🚀
Disclaimer:
This analysis is for educational purposes only and does not constitute financial advice. Always conduct your own research and consult a professional before trading.
#Mastercard #MA #WaveTheory #ElliottWave #SmartMoneyConcepts #SMC #Fibonacci #MarketStructure #PriceAction #TradingView #TechnicalAnalysis #StocksToWatch #MarketCycles #LiquidityHunt #TradingEducation #InvestSmart #StockAnalysis
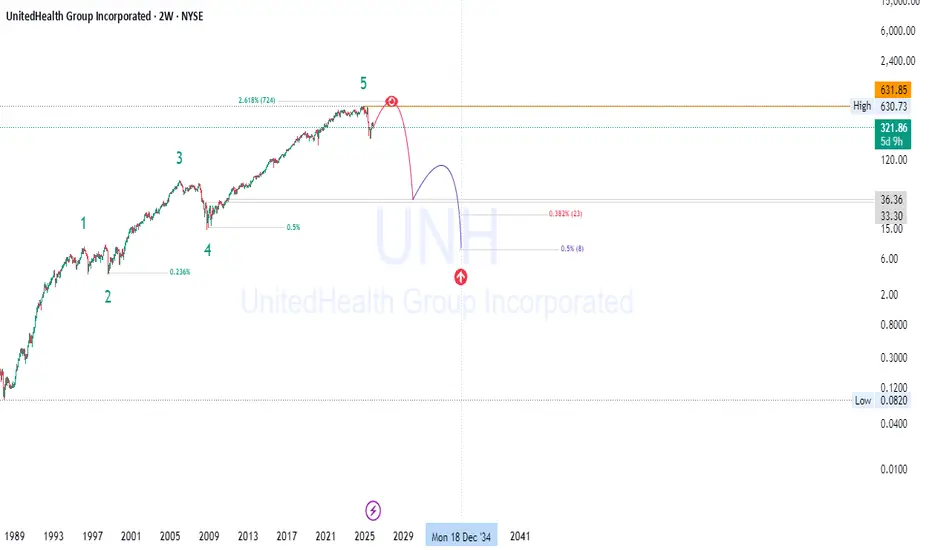
UNH Liquidity Grab Signals Cycle Reversal - Are you ready?A multi-decade bull cycle doesn’t end quietly.
UNH’s Wave 5 has reached exhaustion, and the chart is finally revealing what the next macro chapter might look like.
When price, structure, Fibonacci geometry, and smart money behavior all align — the market is speaking.
🌀 Wave Theory
UNH has completed a full 5-wave macro cycle , with Wave 5 extending unusually far. Extended fifth waves often lead to deep corrections as the trend matures.
🔍 Market Structure
For the first time in years:
higher highs stopped forming
internal structure broke
price failed to reclaim the breakdown
These are early signs of long-term reversal.
🧠 Smart Money Concepts
Institutional behavior is visible at the top:
liquidity sweeps above prior highs
distribution in premium pricing
immediate sell-offs after stop hunts
These are not accumulation behaviors.
📈 Price Action
Wicks, compression, and fading demand show exhaustion.
Large inefficiencies remain unfilled far below current price — and markets revisit these over time.
📊 Fibonacci Geometry
Wave 5 halted nearly at the 2.618 extension , a textbook termination point.
Retracement zones at 0.382–0.5 match the likely landing zone for a large ABC correction.
🔮 Takeaway
Even fundamentally strong companies undergo cycle resets.
This setup suggests UNH may be entering a multi-year corrective phase , fully consistent with long-term market cycles and technical exhaustion.
If you found this breakdown valuable, follow for more multi-timeframe analysis, wave theory insights, and institutional-level charting.
Drop your tickers in the comments 👇 — We’ll analyze the next one 📊🔥
#UNH #WaveTheory #ElliottWave #SmartMoneyConcepts #SMC #FibonacciTrading #MacroCycles
#PriceAction #MarketStructure #TradingView #TechnicalAnalysis #ChartPatterns
#LongTermInvesting #MarketCycles #Liquidity #TraderEducation #StocksAnalysis
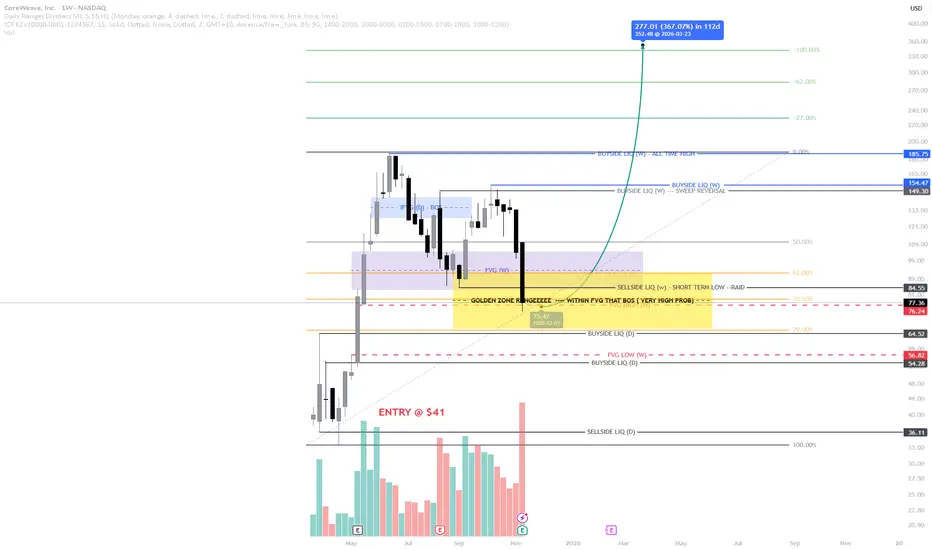
Is This the Last Dip Before CoreWeave’s Next Leg Up? Fundamental View:
CoreWeave (NASDAQ: CRWV) remains one of the most watched AI-infrastructure plays, powering GPU cloud services used by NVIDIA, OpenAI, and multiple large-scale AI firms.
Recent billion-dollar expansions with both partners have reinforced its role as a backbone for AI compute, but after a parabolic rally, valuations look stretched — making any retracement zone highly valuable for accumulation.
Technical View:
Price clearly respected the short-term FVG and swept buyside liquidity at $149.50, closing the weekly candle below it — a classic sign of a liquidity sweep and potential correction.
The drop toward $84.55 tagged the sell-side liquidity and entered a major FVG + OTE golden zone (range $93–$65).
This aligns with the Fibonacci discount area from the previous impulse move, creating a high-probability reaction zone if bullish confirmation appears in the coming weeks.
Outlook:
If we see a strong bullish weekly candle from this level, it could signal the last discounted price range before CoreWeave re-enters its expansion phase.
However, failure to hold above this golden zone could invite deeper retracement.
Patience and confirmation are key before scaling in — this may genuinely be the “last chance to get CoreWeave”, but as always, DYOR and manage risk.
⚠️ Disclaimer: For educational and entertainment purposes only. Not financial advice. Always do your own research.
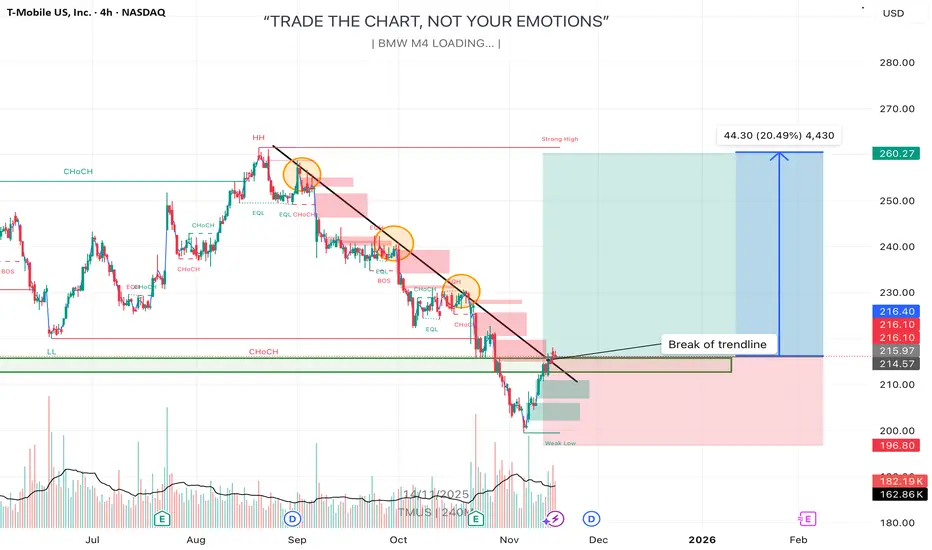
TMUS – Trendline Break & Bounce From Support Zone🔍 Quick Summary
I’m seeing T‑Mobile US, Inc. (TMUS) break a long-term descending trendline and bounce off a key support region. The chart suggests a breakout scenario where I expect price to push toward the strong high near $260 (≈ +20% upside).
⸻
📊 Deep Analysis
• On the 4-hour timeframe, TMUS formed a clear down-sloping trendline that has held resistance on multiple touches (three orange circles). Each successive rejection appears weaker, indicating bearish momentum is fading.
• The price recently broke above the trendline and found support again in the green zone around $214-$216, which aligns with past structure (a strong demand region).
• The big projected move (~$44 to $260) corresponds to previous swing highs and structural liquidity. That aligns with typical “liquidity above weak high” mechanics.
• From a fundamental angle: T-Mobile has delivered strong results — in Q4 it beat earnings and subscriber growth expectations and raised guidance for 2025, which supports a bullish bias.  Also, it launched a new fibre service with a 5-year price lock and is expanding its satellite messaging offering, which strengthens future growth potential. 
• Since the chart shows a low risk (stop-loss) around the support zone and big reward potential toward the strong high, this setup meets favourable risk-reward criteria.
⸻
🎯 Trade Idea Scenario
Bullish Scenario
• Entry: Around ~$214–$216 support zone (preferably on confirmation of trendline retest or bullish price action)
• Target 1: ~$245–$250 (intermediate structure)
• Target 2: ~$260 (strong high liquidity zone)
• Stop-Loss / Invalidation: Below ~$202-$200 (if price breaks below support, setup invalidated)
Bearish Scenario
• If price fails to hold support and closes below ~$202-$200, risk opens toward ~$180 or lower support regions. In that case, bearish momentum resumes and the upside target no longer valid.
⸻
📌 What I’m Watching Next
• Candlestick reaction around the trendline retest: a strong bullish close would validate breakout.
• Volume: higher volume on breakout confirms strength; low volume may signal a fake.
• Support break below ~$202-$200 would cancel the bullish case and shift focus to downside.
• Fundamentals: any new update on fibre rollout, satellite service, or earnings could trigger acceleration.
⸻
⚠️ Disclaimer
This is my personal analysis and not financial advice. Please do your own research and manage your risk carefully. 📉📚
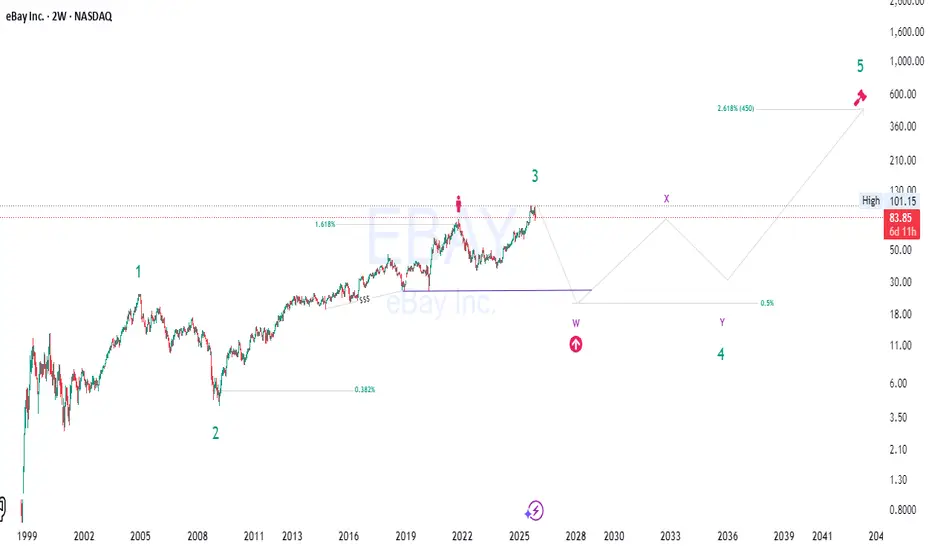
eBay’s Hidden Cycle | Correction Now, Explosion Next🔍 eBay (EBAY) – Full Spectrum Analysis
(Fundamentals + Elliott Waves + SMC + Market Structure + Fibonacci Confluence + Market Cycle)
eBay may be completing a major Wave 3 and entering a large corrective structure (W–X–Y) before a massive long-term Wave 5 rally toward the 2.618 extension (~$450) . This aligns surprisingly well with fundamentals and market behavior.
Let’s break this down clearly. 👇
📌 1. Fundamental Overview – “Stable but Slow” 💼
eBay is fundamentally a mature, cash-flow rich, low-growth digital marketplace . It’s not a hyper-growth tech stock anymore—more like a cash generator with strategic share buybacks.
⭐ Strengths
Strong free cash flow 🚰
Aggressive share repurchases (shrinking share count = upward EPS pressure)
Stable margins due to marketplace model, not inventory-heavy
Healthy balance sheet compared to most e-commerce peers
⚠️ Weaknesses
Sluggish revenue growth
Marketplace competition (Amazon, Walmart Marketplace, niche platforms)
Limited innovation compared to its early-2000s era
Sensitive to consumer spending cycles
🧭 Interpretation
Fundamentals support a long consolidation / corrective phase rather than a trend collapse. eBay isn’t dying—it’s simply slow and stable , perfect for a long drawn-out Elliott correction before a major cycle expansion (Wave 5).
🌊 2. Elliott Wave Theory
It demonstrates:
Wave 1 – early 2000 breakout
Wave 2 – deep correction following dot-com bust
Wave 3 – huge multiyear advance 2008–2025 (strongest wave ✔️)
Now entering Wave 4 – a complex W–X–Y correction
Projection: Wave 5 at 2.618 ext (~$450) – extremely reasonable for a long-term cycle top
Why this fits Elliott Wave perfectly:
Wave 3 is extended (very normal for tech).
Wave 4 is usually complex , time-consuming, messy.
Wave 5 often reaches 2.618 Fib extension when Wave 3 is extended.
This is a textbook count. 📘🔥
🔐 3. Smart Money Concepts – “Distribution → Accumulation → Expansion”
Looking at price behavior leading into 2024–2025:
🔴 Distribution Signs (near Wave 3 top)
Choppy, wick-heavy candles
Liquidity hunts above equal highs
Failure to sustain breakout levels
Bearish divergence on volume
This shows institutions unloading at premium prices.
🟡 Expected: Accumulation Phase (your W–X–Y)
Wave 4 = the zone where smart money loads up quietly before a big cycle advance.
Expect:
Sweeps of lows
Long wicks down
Tight ranges after capitulation
Volume spikes at bottoms
🟢 Expansion (Wave 5)
Once the long correction completes, smart money typically drives a massive markup—the Wave 5.
📉 4. Price Action & Market Structure
🔻 Structure Turning Bearish Temporarily
It shows:
Loss of trendline support
Lower highs forming
Price failing at the 1.618 extension → classic Wave 3 exhaustion
So yes, Wave 4 correction is structurally valid.
🔻 Support Levels of Interest
These align beautifully with W and Y targets:
0.382 retracement → mid-correction support
0.5 retracement → perfect W–Y completion zone
These fibs are exactly where long-cycle Wave 4 structures tend to land.
📐 5. Fibonacci Confluence
All fib levels match long-term cycle behavior:
✨ Key Confluences
1.618 = Wave 3 termination (hit)
0.382 and 0.5 retracements = Wave 4 corrective basins
2.618 extension = Wave 5 terminal projection (~$450)
The 2.618 target has high probability if Wave 4 remains orderly .
🔄 6. Market Cycle Psychology
Right now eBay is in the late-complacency → early anxiety phase.
We can map it like this: [/b
Euphoria (Wave 3) → everyone bullish
Complacency → “the dip will be bought”
Anxiety → price begins trending down
Fear → W wave leg
Doubt / Despair → Y wave completion
Hope / Belief / Thrill → early Wave 5
Euphoria → Wave 5 top
This fits our projected cycle perfectly.
🎯 7. Final Take – Summary
This eBay chart i s one of the cleanest long-term Elliott counts we’ve seen. The scenario we’re mapping is not only technically sound, but supported by fundamentals, smart money behavior, fib confluence, market structure, and economic cycles .
eBay is not a rocket ship right now. It’s a maturing, slow-growth platform entering a long correction (Wave 4). But that correction is setting the stage for a massive, multi-year Wave 5 that could take the stock to its all-time highest valuations.
In other words:
👉 Wave 3 is done.
👉 Wave 4 is coming — slow, corrective, messy, multi-year.
👉 Wave 5 will be explosive once correction completes.
This is a very natural long-term market rhythm for a mature tech company like eBay.
Save this post before the move happens!
Drop a comment: Bullish or Bearish on eBay?👇
Disclaimer: This idea is for educational purposes only and reflects our personal opinion, not financial advice. Always do your own analysis before taking any trade. We are not responsible for any profits or losses. Trade safe and manage your risk. 📉📈
#ebay #stocks #elliottwave #waveanalysis #smartmoney #stockmarket
#tradingview #technicalanalysis #investing #fibonacci #marketstructure
#tradercommunity #chartanalysis
NAS100 8H - real correction or just another dramatic rehearsal?NAS100 held the 24850–25000 demand zone with precision, forming a classic false break followed by a sharp recovery back into the rising channel. Volume expansion on the reversal, strong lower wicks, and sustained support at the dynamic trendline all signal that the medium-term bullish structure remains intact. The path toward 26300 inside the channel stays open, and a breakout above this level unlocks the next target at 27300 - the upper boundary of the current impulse.
The NAS100 index represents the core of the US tech sector, reflecting demand for IT, cloud infrastructure, AI technologies, communication platforms, and high-growth digital companies.
Fundamentally , the backdrop on November 15 strengthens the bullish case: the market continues to price in a softer Fed stance, bond yields are easing, major tech companies are raising guidance, and demand for AI-driven solutions remains stable. With inflation trending into a manageable range and expectations for improved credit conditions rising, liquidity is rotating into high-beta assets, providing structural support and limiting corrective depth. Strong margins, solid earnings and resilient tech demand continue to anchor the broader uptrend.
As long as price holds above 24850–25000, the bullish scenario remains active. A confirmed breakout above 26300 opens the way toward 27300. Any controlled pullback into 24850–25000 remains a buy zone within the prevailing trend.
NASDAQ likes to overact, but more often than not it’s simply warming up before the next performance.

Doge Coin 0.06$ inc soon lolHey guys,
Doge coin has been sleeping for a while and its going to wake up soon but first price needs to
Touch down on the key FIB level at 0.06$ which is in my opinion the safest entry price.
We might see a small pump to 0.20$ first but after that 0.06$ is a magnet so don't be fooled
When it pumps a little in the upcoming days.
Let me know what do you guys think about this.

Netflix (NFLX) - Elliott Wave Map to $25K📘 Netflix (NFLX) – The Final Act of Supercycle Wave III, Setting the Stage for Wave V to $25,000+
Symbol: NASDAQ:NFLX
Timeframe: Monthly
Published: October 2025
Current Price: ~$1,120
Framework: Elliott Wave | Fibonacci Extensions | Price Action | Smart Money Concepts (SMC) | Fundamentals
🔍 Structural Overview – Supercycle Journey
Netflix has been moving through a multi-decade Elliott Wave supercycle that began in the early 2000s. This structural roadmap is now approaching the final phase of Wave III, before setting up for a corrective Wave IV and ultimately a euphoric Wave V.
Supercycle Wave I completed in January 2004 — a powerful impulse that marked Netflix’s transition into a mainstream tech-growth story.
Supercycle Wave II followed, completing in 2008 with a healthy 50% retracement. This wave set the long-term demand foundation and concluded right as the global financial crisis unfolded.
We are now in Supercycle Wave III, which began in 2008 and is currently in its final macro wave — the most dynamic phase of the entire structure.
⚙️ Breakdown of Supercycle Wave III (2008–2026 est.)
Wave III itself subdivides into five clear macro waves, each respecting Fibonacci and structural principles:
Macro Wave 1 ran from the 2008 bottom into mid-2011, kickstarting the secular bull trend.
Macro Wave 2 ended in 2012 with a textbook 0.618 Fibonacci retracement , a classic sign of wave-based correction.
Macro Wave 3 , the most explosive move of the cycle, lasted until 2018 and terminated near a 2.618 Fibonacci extension — a key confluence area and institutional distribution point.
Macro Wave 4 then corrected from 2018 to 2022. However, this retracement was shallow, bouncing from the 0.236 level — preserving long-term bullish market structure and confirming continued institutional control.
We are currently in Macro Wave 5 of Supercycle III . This leg is itself subdividing into five micro waves. Micro waves 1, 2, and 3 have already completed. Micro Wave 4 is now unfolding and is expected to bottom inside the Golden Pocket — the critical Fibonacci zone between approximately $771 and $548 .
Once Micro Wave 4 completes, Micro Wave 5 will initiate. This final thrust is expected to target the region near $7,447 — the 2.618 extension from prior waves. This level aligns with structural channel tops and institutional profit zones. It would also mark the formal completion of Supercycle Wave III .
🧭 What Comes Next: Supercycle Wave IV and V
After Wave III completes at the ~$7,44 7 area, a significant correction is expected.
Supercycle Wave IV will be the most complex corrective structure since 2008 — possibly multi-year, combining flat, zig-zag, or triangle formations. This wave will likely retrace a large portion of Wave III and reset sentiment across the broader market.
But this correction is not the end — it’s the setup.
Supercycle Wave V will emerge from the Wave IV base and drive Netflix into its ultimate secular top . Based on the Fibonacci 4.618 extension from the base of the cycle, Wave V is projected to reach the $24,774 to $25,332 range.
This would be the euphoric blow-off move where fundamentals, monetary policy, and sentiment combine to form a parabolic top — consistent with historical market cycle conclusions.
📐 Fibonacci Confluence Zones
Each major wave has respected key Fibonacci ratios . Wave II retraced to 0.50, Wave III extended to 2.618, and Wave IV retraced to 0.236. Current projections place Wave V near the 4.618 extension level — a historically significant threshold for secular tops.
The current Micro Wave 4 pullback is unfolding into the Golden Pocket zone — the 0.618–0.65 retracement range — which has repeatedly served as the institutional reaccumulation zone across prior waves.
🧠 Smart Money Behavior
Smart Money Concepts further validate this wave count:
In 2018 , we saw classic signs of institutional distribution at the top of Macro Wave 3 — including high-volume price exhaustion, deviation from trend, and liquidity sweeps.
Between 2018 and 2022, accumulation returned during Wave 4, as institutional players re-entered at discounted levels and retested key demand blocks .
The 2022 breakout into Macro Wave 5 has been efficient, clean, and impulsive — with minimal resistance and wide-range bullish candles, signaling continued institutional participation.
The current Wave 4 micro correction may again serve as a liquidity grab — offering another accumulation window before the final markup toward the $7,447 zone.
🔍 Netflix Fundamentals – Fueling the Cycle
Netflix's fundamentals are now structurally aligned with the technical setup:
Diversified Monetization:
The shift from pure subscription to a multi-layered model (ad-supported tiers, gaming, IP licensing, live events) is broadening both revenues and engagement.
Ad-Supported Growth:
Netflix’s advertising business is scaling rapidly, offering higher ARPU and access to price-sensitive users — a major tailwind for Wave V.
Global Expansion:
With strong localization strategies, Netflix continues to dominate key international markets, boosting user stickiness and content ROI.
Strong Financials:
Consistent free cash flow, improving margins, and disciplined content spend are creating a sustainable growth engine.
These dynamics are not just supporting price — they are helping to drive the type of institutional confidence needed for Wave V to materialize.
🎯 Strategic Levels and Outlook
Watch the Golden Pocket between $771–$548 — this is the high-probability completion zone for Micro Wave 4.
Once Micro Wave 5 begins, price is expected to rally toward $7,447 — the projected top of Supercycle Wave III.
After a broad correction during Wave IV, the final Wave V is projected to target $24,774 to $25,332 — where the entire super-cycle would culminate.
🔚 Final Word
Netflix is moving through the final stages of a 20-year Supercycle Wave III — one of the strongest impulsive phases in equity history. The micro pullback underway now is not a sign of weakness, but a preparation for the final push.
Wave IV will offer the last major reset before a euphoric Wave V redefines valuations. If the fundamental narrative continues to align, the $25K target is not speculative — it’s structural.
📘 Disclaimer: This analysis is for educational purposes and is not financial advice. Always do your own due diligence and risk management.
#NFLX #Netflix #NASDAQ #ElliottWave #TechnicalAnalysis #WaveTheory #Fibonacci #Supercycle #PriceAction #LongTermInvestment
💬 Respected traders and analysts!
Your insights matter. Share your views, confirmations, or constructive criticism in the comments below. Let’s build a high-quality discussion around Netflix’s structural evolution and long-term investment context.
— Team FIBCOS

Elliott Waves Don’t Lie: NVDA’s Path to $26,000Summary: “Elliott Waves, Fibonacci, and Smart Money align perfectly — NVIDIA’s long-term chart points to an AI-powered Supercycle with massive upside." 💎📊
🚀 NVDA | The Supercycle of the AI Era! 💚
🌀 Elliott Wave Supercycle Breakdown
NVIDIA’s price action over the past two decades is a textbook example of a multi-decade Elliott Wave Supercycle — where technical , fundamentals , and Smart Money flows perfectly align to form a once-in-a-generation structure 🌎
Let’s break it down step-by-step 👇
Super Cycle Wave (1) — launched in the early 2000s, marking NVDA’s first growth phase during the birth of consumer GPUs 🎮.
Super Cycle Wave (2) — deep correction into 2002, retracing a 0.786 Fibonacci, cleansing early euphoria and creating the foundation for institutional accumulation 💼.
Then began the Super Cycle Wave (3) — the most powerful phase of all. Within it, we have distinct macro sub-waves:
1️⃣ Macro Wave (1) — ended in 2007 , aligning with the first institutional wave of adoption.
2️⃣ Macro Wave (2) — retraced 0.618 in 2008 , coinciding with the global financial crisis (perfect Smart Money shakeout).
3️⃣ Macro Wave (3) — the current dominant leg, fueled by exponential AI and data center growth . It’s extending toward the 3.618 Fibonacci extension (~$256) , confirming wave strength and institutional conviction.
4️⃣ Macro Wave (4) — expected between 2026–2027, likely retracing 0.236–0.382, a natural cooling period before the next breakout.
5️⃣ Macro Wave (5) — projected to rally toward 4.618 extension (~$2,500) , completing Super Cycle Wave (3) near 2029 🏁
From there, a larger Super Cycle Wave (4) correction could unfold before the final parabolic Super Cycle Wave (5) run to the 5.618 Fibonacci extension (~$26,000) — the climax of NVDA’s decades-long AI expansion super-trend 🌕
💰 Smart Money Concept (SMC) Perspective
The chart structure clearly shows Smart Money accumulation patterns in every correction phase:
Re-accumulation ranges appeared at every 0.618 retracement level 📊
Liquidity grabs below previous swing lows before strong impulsive moves ⚡
Fair Value Gaps (FVGs) filled during corrections, creating perfect liquidity imbalances that institutional players exploit
Currently, NVDA trades near a premium zone of Macro Wave (3), but Smart Money will likely reaccumulate during the upcoming Macro Wave (4) discount phase (2026–2027).
Expect Order Block re-tests and liquidity sweeps around discounted Fibonacci retracement zones (0.236–0.382) before the next major rally 📉➡️📈
📈 Price Action Structure
NVDA’s macro structure remains strongly bullish:
The multi-decade trend has respected every higher high and higher low sequence since 2008.
Each impulse is followed by a healthy re-accumulation range, never breaking long-term structure.
Expect distribution near the $250–$300 (split-adjusted) region as Wave (3) matures, followed by a macro correction that offers generational entries for long-term investors 🧠
🔢 Fibonacci Confluence & Technical Harmony
Fibonacci has been the invisible hand guiding NVDA’s growth 👇
0.786 retracement (2002) → deep liquidity reset
0.618 retracement (2008) → institutional re-entry
3.618 extension (256) → current macro resistance target
4.618 extension (2500) → Super Cycle Wave (3) final target
5.618 extension (26K) → ultimate Super Cycle Wave (5) projection
Each impulse and retracement aligns perfectly with Fibonacci’s geometric rhythm , proving the power of confluence between time, price, and sentiment.
🧠 Fundamentals — The Energy Behind the Waves
Behind the technicals lies unmatched fundamental growth :
💾 AI & Data Centers: NVIDIA is the core infrastructure for modern AI compute and cloud training workloads.
🧩 CUDA Ecosystem: A software moat that ties developers and enterprises directly to NVIDIA’s architecture.
🌐 Omniverse & Robotics: Positioning NVDA as a leader in 3D simulation, robotics, and digital twins — future trillion-dollar markets.
⚙️ Strategic Partnerships: Expanding across hyperscalers, automotives, and enterprise AI.
Each innovation wave fuels a new Elliott Wave impulse , with the AI revolution now driving the strongest macro leg in NVDA’s history.
⚡ Macro Outlook & Timeline
✅ Now (2025): Completing Macro Wave (3) of Super Cycle (3) → heading toward $256 target
⚠️ 2026–2027: Macro Wave (4) correction to 0.236–0.382 (Smart Money entry)
🚀 2028–2029: Macro Wave (5) push → Super Cycle (3) peak near $2,500
🌊 2030–2032: Super Cycle (4) correction — consolidation phase
💎 2035–2040+: Super Cycle (5) → ultimate 5.618 target near $26K
💬 Final Thoughts
"Every correction is a setup for the next expansion. Smart Money buys fear — not euphoria."
NVIDIA is the heartbeat of the AI revolution , the core of data-driven computing , and a living Fibonacci sequence in motion.
As long as fundamentals stay aligned with the wave rhythm, NVDA’s Supercycle will continue to redefine what’s possible in long-term growth. 🌌
#NVDA #ElliottWaveAnalysis #SmartMoneyConcept #PriceActionTrading #FibonacciMagic #AIRevolution #StockMarket #Investing #TradingViewCommunity #TechSupercycle #NVDAtoTheMoon #LongTermInvesting
💬 Traders, analysts, and wave watchers — your insights matter!
Have you spotted NVDA’s next move? Drop your Elliott Wave counts, confirmations, or constructive critiques below 👇 Let’s discuss NVIDIA’s structural evolution, AI-driven Supercycle, and long-term growth potential together 🚀💚
Every comment adds perspective — let’s decode this massive wave as a community! 🌊📈
— Team FIBCOS ⚡💎

NASDAQ-100 (USTEC) | Elevated risks arise Sentiment:
- Extreme Fear in the market (F&G = 23)
- Investors are bearish (49% bearish vs 37% bullish)
- Volatility elevated but not extreme (VIX 20)
- Higher Put activity and an elevated put/call ratio (1.11)
- Hedge funds unwinding crowded AI longs (50% market cap concentration)
- Record institutional options activity positioning for Q4 2025-Q1 2027
- COT report: No latest data due to the US government shutdown
Interpretation:
- Put hedge elevated = cautious as institutional hedging and distributing stocks to retail
- Extreme Fear + High Bearishness = Potential buying opportunity (later stage)
- When sentiment is this negative, often near bottoms
Fundamental:
- Valuation Concerns:
- 24-25x Forward P/E - vs 20-22 for 5-year average
- 3.08-3.37x P/S ratio - 2.35-2.41 for 5-year average
- Dec Fed cut probability is declining
Technical:
- USTEC broke the ascending trendline and EMA21, indicating potential mean reversion to EMA78, which is just above the support cluster at around 24000.
- Breaking below 24000 may prompt a decline to the following support cluster at around 23000, which is a prominent zone for sentiment contrarians step into the market if market fear remains at an extreme level.
My take on this:
- The distributing process may last for a while before reaching more extreme panic sentiment, prompting consideration of a contrarian approach based on technical levels.
- Therefore, we need to watch the price action to determine the best entry setup for the Long position. Then, for now, short-term pressure is the better take.
Analysis by: Dat Tong, Senior Financial Markets Strategist at Exness

buy the Dip at US100 , Nasdaq looks buy on the dip Liquidity inflow started from USA, very good entry for the Index long entries

NASDAQ NAS100 Under Pressure – Watching for a Break of StructureThe NASDAQ is currently showing signs of weakness on the 4-hour chart. Sellers are gradually stepping in, and we can see US100 bearish momentum starting to take control. The market is under pressure, and price action is hinting at potential continuation to the downside.
I’ll be watching closely for a NAS100 break below the current range low — if price retests that level and fails to reclaim it, that would confirm a bearish market structure shift 🔻. Such a setup could provide a high-probability short opportunity as momentum accelerates to the downside.
⚠️ This is not financial advice — purely for educational and analytical purposes.

US100 – Consolidation Between FVGs, Watching for Bullish BreakouHello traders,
On the daily timeframe, NASDAQ (US100) is currently consolidating between a bullish and a bearish Fair Value Gap (FVG). Both sides present clear liquidity areas, and the market is preparing for its next directional move.
From my perspective, I’d like to see the price tap into the bullish FVG first, react from that zone, and then invalidate the bearish FVG on its way higher.
If this scenario plays out, the next targets would be the equal highs (EQH) and eventually a new all-time high (ATH).
However, if a daily candle closes below the bullish FVG, this idea becomes invalid and we could expect further downside movement.
For now, I remain bullish while the bullish FVG holds. 📈
💌It is my honor to share your comments with me💌
🔎 DYOR
💡Wait for the update!

Nasdaq Diverges From Dow Gains — Will It Follow?From a daily perspective, the Nasdaq is testing the upper bound of a parallel channel that has been respected since the August 2025. Price action previously broke to the mid-zone of the duplicated channel near 26,300, declined to the lower border of the original pattern near 24,650, and has since rebounded toward the upper edge around 25,700.
The scenarios from here are as follows:
• Bullish case: A confirmed hold above 25,700 could redirect gains toward 26,300, after which another bullish projection targets the upper boundary of the duplicated channel near 26,800–27,000.
• Bearish case: A drop back below 25,200 could pull prices toward 24,650, with further downside potential extending below the August–November support zone toward 23,900, 23,500, and, in extreme cases, 22,700.
As the longest U.S. government shutdown in history comes to an end, the Dow has extended its gains toward new records near 48,500, while the Nasdaq and S&P 500 remain in a neutral hold, raising questions about the sustainability of further highs in 2025.
Written by Razan Hilal, CMT

Nasdaq - potential trigger Break for a long targetNasdaq - potential trigger Break for a long target
We are at final point of rebound
We can have a potential 5 wave so, if price will break trigger zone we can have final long wave.