Nasdaq - The final blow-off top!⚰️Nasdaq ( TVC:NDQ ) can rally a final +25%:
🔎Analysis summary:
Just this month, we witnessed quite some volatility on the Nasdaq with a correction of about -10%. However, bulls immediately stepped in and clearly pushed price higher. Since there is still bullish pressure, a final blow-off top rally in the near future is quite likely.
📝Levels to watch:
$25,000 and $30,000
SwingTraderPhil
SwingTrading.Simplified. | Investing.Simplified. | #LONGTERMVISION
Nasdaq100

QQQ Structured Bullish Scenario • Compression Into MA Support📌 Asset: QQQ — Invesco QQQ Trust Series 1 (NASDAQ ETF)
🔎 Style: Swing / Day-Trade Profit Playbook
🎨 Theme: Bullish Pullback Setup using Triangular Moving Average + Layered Entry Strategy
📈 Bullish Pullback Plan — “Thief Layering Strategy” Edition 🕵️♂️💰
QQQ is pulling back into a Triangular Moving Average zone, forming a clean bullish reaction area. Price behavior shows controlled momentum, healthy retracement, and a potential continuation toward the upper supply zone.
To keep it fun — Thief OG Style is included but in TradingView-permitted language and friendly terms.
🎯 Entry Plan (Layered Limit Entries — “Thief Style but TV-Friendly”)
Using a layered entry method (multiple limit orders placed at different levels to reduce average cost and control risk):
Buy Limit Layer 1: 605
Buy Limit Layer 2: 610
Buy Limit Layer 3: 615
Buy Limit Layer 4: 620
(Traders may increase or reduce the number of layers based on their own strategy and risk tolerance.)
🛑 Stop Loss (Risk Control Zone)
📍 Proposed Risk Level: 600
This is shared for educational insight only — every trader must select their own SL depending on risk appetite.
🎯 Target Zone (Resistance + Police Force Zone 🚓😆)
Projected upside target: 650
The resistance zone has strong reaction history + signs of overbought conditions + possible liquidity traps.
So take profit smartly and exit with gains before “police force” catches late buyers.
(Again: this TP is optional — traders should decide their own TP levels.)
📚 Market Context & Correlation Watchlist 🔍🌐
QQQ is heavily correlated with major US tech indices & megacap tech stocks. Watching related pairs helps understand volatility, liquidity shifts, market strength, and trend momentum.
🔗 Related Pairs to Watch (Cross-Checks & Correlation Insight)
💠 NASDAQ:NDX / PEPPERSTONE:NAS100
Direct parent index of QQQ
Moves almost identically
Great for trend confirmation
💠 SP:SPX / AMEX:SPY
Broader market risk sentiment
If SPY + QQQ align in bullish direction → strength confirmed
💠 TVC:VIX
Volatility meter
Lower VIX supports bullish continuation
💠 NASDAQ:AAPL , NASDAQ:MSFT , NASDAQ:NVDA , NASDAQ:AMZN , NASDAQ:GOOGL
These top components control majority of QQQ weighting
Bullish tech megacaps = higher probability QQQ reaches target
💠 TVC:DXY (Dollar Index)
Strong USD = pressure on equities
Weak USD = supportive for QQQ rallies
💠 NASDAQ:TLT / US10Y
Bond yields inverse to growth stocks
Falling yields can provide additional bullish fuel for QQQ
🧠 Key Technical Points 🛠️🔥
Triangular MA acting as dynamic support
Healthy pullback with controlled selling
Layering entries reduces average cost & improves RR
Resistance zone at 650 aligns with prior structure
Megacaps still holding bullish bias
Volatility decreasing → favorable for continuation
✨ “If you find value in my analysis, a 👍 and 🚀 boost is much appreciated — it helps me share more setups with the community!”
⚠️ Disclaimer
This is a thief-style trading strategy just for fun.
#QQQ #NASDAQ #ETF #SwingTrade #DayTrading #TechnicalAnalysis #TriangularMA #LayeringStrategy #LimitOrders #MarketAnalysis #TradingPlaybook #USMarkets #Stocks #TraderLifestyle #Investing #BullishSetup #TrendContinuation #RiskManagement #ChartAnalysis
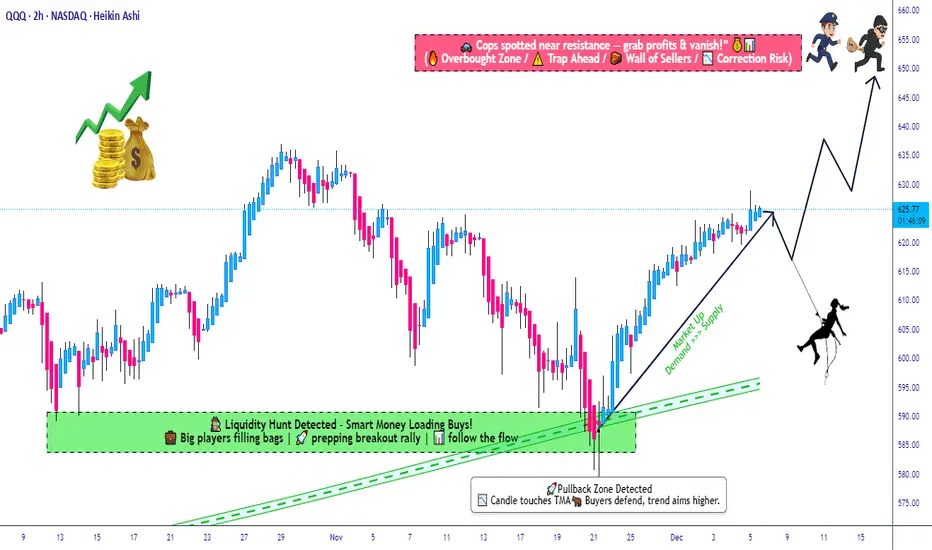
Market Focus on QQQ — Bullish Setup Taking Shape!🎯 QQQ ($INVESCO NASDAQ-100) Bullish Swing Trade Setup
The Layered Entry "Thief" Strategy | Profit Playbook 💰
📈 MARKET OUTLOOK
The QQQ (INVESCO QQQ TRUST) is positioned for a bullish swing trade setup. 🚀 This technical analysis focuses on strategic multi-layer entry execution with defined risk/reward parameters suitable for intermediate swing traders.
🎪 ENTRY STRATEGY: "LAYERED THIEF" METHOD
This isn't your typical entry—we're using smart limit order layering 🎯 to accumulate positions at key support zones. Think of it as a professional scale-in approach!
📍 Limit Order Entry Layers:
Layer 1: $605.00 ⭐
Layer 2: $610.00 ⭐
Layer 3: $615.00 ⭐
Layer 4: $620.00 ⭐
💡 Pro Tip: Feel free to add additional layers ($625, $630, etc.) based on your risk tolerance and account size. The thief's advantage is patience and positioning!
Entry Triggers: Volume confirmation + Support zone bounce + Institutional accumulation signals 📊
🛑 STOP LOSS (Risk Management)
⚠️ THIEF SL: $590.00
📢 DISCLAIMER: This stop loss is a suggestion only. You are responsible for setting your own risk parameters based on your trading capital, risk tolerance, and market conditions. Trade at your own risk! 🎲
🎊 PROFIT TARGETS (Exit Strategy)
PRIMARY TARGET: $650.00 ✅
SECONDARY RESISTANCE: $660.00 ⚠️
Note: The $660 zone presents strong technical resistance combined with overbought conditions and potential reversal traps. We recommend taking profits at $650 and letting a small portion run if momentum confirms. Smart money moves!
📢 DISCLAIMER: Target levels are suggestions based on technical analysis. Your profit-taking strategy should align with your personal risk/reward ratio. Final exit decisions rest with you! 🎯
🔗 CORRELATED PAIRS TO MONITOR
Keep an eye on these related assets for confirmation signals:
🔴 QQQ Constituents & Index Correlation:
NASDAQ:AAPL (Apple Inc.) — Tech sector heavyweight; if AAPL breaks support, QQQ may follow 📱
NASDAQ:MSFT (Microsoft Corp.) — AI & cloud leader; typically leads QQQ moves upward 🤖
NASDAQ:NVDA (NVIDIA Corp.) — Semiconductor bellwether; massive correlation to tech rallies 💻
NASDAQ:TSLA (Tesla Inc.) — Growth driver; watch for momentum continuation signals ⚡
NASDAQ:GOOGL (Alphabet Inc.) — Large-cap tech anchor; supports QQQ uptrend confirmation 🔍
📊 Macro-Level Pairs:
NASDAQ:NDX (NASDAQ-100 Index) — Direct parent index; should mirror QQQ closely 📈
AMEX:SPY (S&P 500 ETF) — Broader market health check; risk-on environment confirmation ⭐
AMEX:IWM (Russell 2000 Small-Cap) — Risk sentiment gauge; divergence = caution ⚠️
TVC:DXY (US Dollar Index) — Inverse correlation; strong dollar = headwind for tech 💵
Key Correlation Points: Watch for tech sector strength continuation and macro risk-on sentiment. If NDX confirms, QQQ breakout is highly probable! 🚀
💡 STRATEGY BREAKDOWN
✅ Bullish Bias with patience-based accumulation
✅ Defined Risk at the $590 level
✅ Layered Entry for optimal position sizing
✅ Technical Confluence at resistance zones
✅ Risk/Reward Potential = Approx 1:2.5 ratio
🎓 TECHNICAL VALIDATION CHECKLIST
✅ Support zone identification at $605-620 range
✅ Volume analysis at entry levels
✅ RSI divergence confirmation
✅ Moving average alignment (200 SMA positioning)
✅ Institutional order flow patterns
✅ Market structure (Higher Highs/Higher Lows)
✨ If you find value in my analysis, a 👍 and 🚀 boost is much appreciated — it helps me share more setups with the community!
#QQQ #SwingTrade #TechETF #NASDAQ100 #TradingStrategy #ThiefStrategy #LayeredEntry #ProfitPlaybook #Bullish #TechnicalAnalysis #ETFTrading #RiskManagement #ActiveTrading

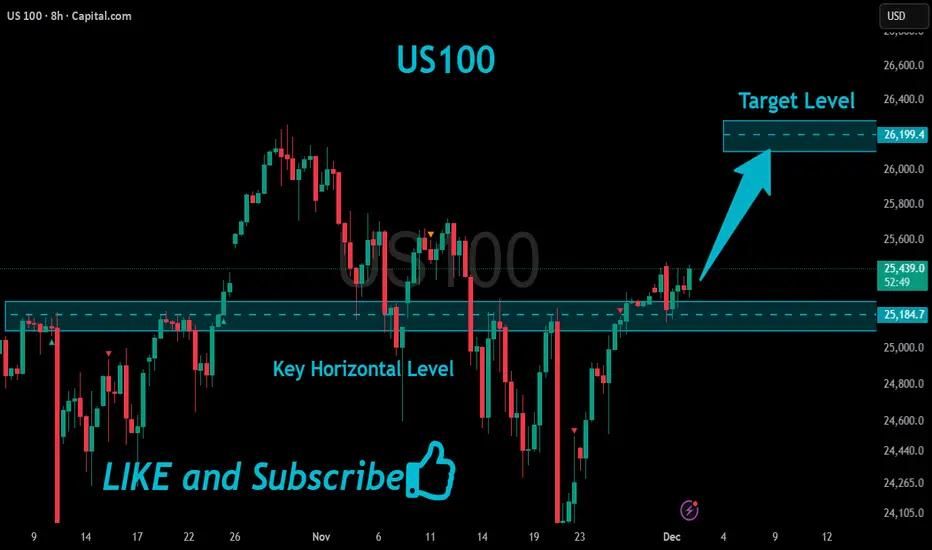
US100 Bullish Breakout!
HI,Traders !
#US100 is going up now
And made a bullish
Breakout of the key horizontal
Level of 25184.7 and the breakout
Is confirmed so we are bullish
Biased and we will be
Expecting a further
Bullish move up !
Comment and subscribe to help us grow !
Fitell Corporation ($FTEL) Spike 25% Eyeing the $100 MarkThe price of Fitell Corporation ( NASDAQ:FTEL ) saw a noteworthy uptick of 25% today amidst market condition. The asset looks set to reclaim the $100 resistant point amidst bullish sentiments.
NASDAQ:FTEL Relative Strength Index (RSI) is 44, indicating ample of opportunity for NASDAQ:FTEL to reclaim recent highs.
Eversince losing over 90% of market value, the asset has been in oversold region for almost a year.
In recent News, Fitell Corporation (NASDAQ: FTEL) announced that its board of directors (the “Board”) has approved a share repurchase program (the “Share Repurchase Program”) under which the Company may repurchase up to $3 million of its ordinary shares over the next 24 months. The Share Repurchase Program is designed to enhance shareholder value and foster a stronger sense of community among our supporters.
Financial Performance
In 2025, Fitell's revenue was $5.20 million, an increase of 16.42% compared to the previous year's $4.47 million. Losses were -$682,724, -92.67% less than in 2024.
About FTEL
Fitell Corporation, through its subsidiary, GD Wellness Pty Ltd, operates as an online retailer of gym and fitness equipment for personal training studios and commercial gyms chains in Australia and Southeast Asia. The company markets and sells fitness equipment, including home gym and commercial strength-training equipment.

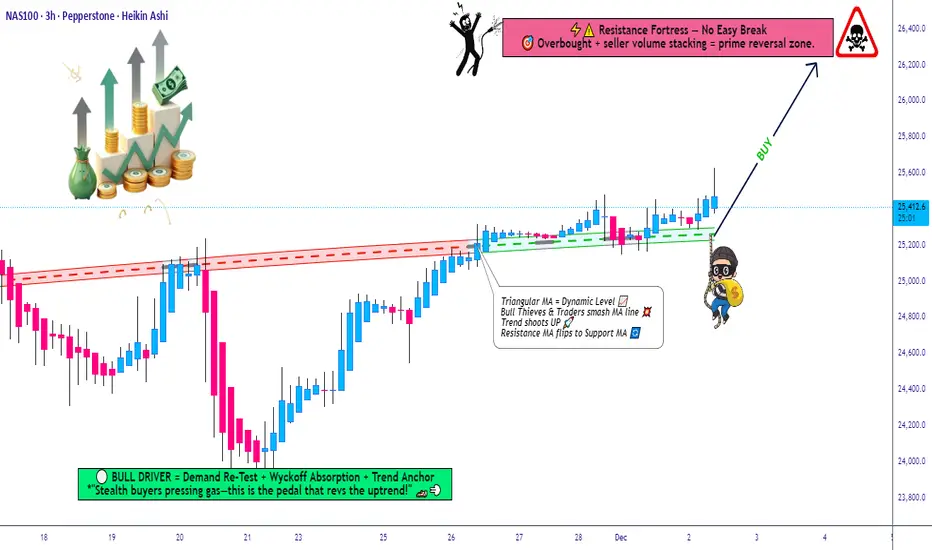
NASDAQ100 Breakout Watch — Is a New Upside Leg Starting Now?📈 NASDAQ100 Swing Trade Opportunity — Bullish Breakout Play
🟩 Asset: NASDAQ100 (Index CFD)
⚡ Trade Type: Swing Trade — Bullish Plan Confirmed
🧭 Trade Thesis
The index has confirmed a bullish setup following a Triangle + Moving Average breakout, strengthening upward momentum and favoring dip-buying behavior.
To reflect the Thief layering method, this plan uses multiple staggered limit orders to accumulate positions efficiently across volatility pockets.
📌 Entry Plan (Thief Layering Method)
💰 Entry Style: “Any price level allowed — Thief uses layers”
Buy Limit Layers:
24,900
25,000
25,100
25,200
(Feel free to increase or customize layers to fit your personal risk and liquidity preference.)
🛑 Stop-Loss (SL)
🔻 Thief SL: 24,500
Dear Ladies & Gentlemen (Thief OG’s), adjust SL based on your personal risk and strategy.
This is not a fixed recommendation, only a reference zone.
🎯 Target (TP)
⚡ The High-Voltage Electric Gate Zone around 26,200 acts as major resistance because of:
Overbought readings
High-liquidity trap behavior
Historical reversal probability
Exit with profits before heavy sellers activate.
Again — you decide your own TP based on your risk tolerance, not mine.
📊 Market Logic Behind the Move
Breakout structure confirmed
Trend continuation supported by triangle compression
Index ETF flows show short-covering + rotation back into tech
Momentum accelerates above 25,200 zones
Cleaner upside path until liquidity wall at 26,200
🔎 Related Pairs to Watch (Correlation Insight)
1️⃣ NASDAQ:NDX / NASDAQ:QQQ
Direct ETF mirror of NASDAQ100
Useful for checking volume, market depth, and real-time breakout confirmation
2️⃣ SP:SPX / NYSE:ES (S&P 500)
High correlation (approx. 0.85+)
A strong SPX supports tech continuation; weakness warns of index-wide pullback
3️⃣ TVC:VIX (Volatility Index)
Inverse correlation
If VIX stays below key volatility thresholds, bullish NASDAQ continuation is more reliable
4️⃣ FX:USDOLLAR / DXY
Tech usually performs better when the Dollar weakens
A rising Dollar can slow or cap NASDAQ bullish momentum
5️⃣ TVC:US10Y / Yields
NASDAQ moves inversely with yields
If yields drop, NASDAQ accelerates
If yields spike, prepare for turbulence or failed breakouts
📘 Summary
Bullish plan confirmed via Triangle + MA Breakout
Thief layering entries positioned smartly into volatility
SL/TP guidance flexible for trader customization
Strong correlation checks available across SP:SPX , TVC:VIX , TVC:DXY & yields
NASDAQ NAS100 Analysis and My Trade Plan📊 Currently analysing NAS100 (NASDAQ), we can see that price has broken structure to the upside, confirming bullish intent. Right now, NAS100 is retesting the value area and the Point of Control (POC) on the volume profile — a critical zone to watch 👀📈
⚠️ Price action is a bit precarious. After a strong impulsive move, we’ve now seen a deep and aggressive retracement, which opens the door for potential bearish movement this week.
📆 However, my higher-timeframe bias remains bullish, with the weekly chart still supporting upward continuation.
📌 My plan:
If price holds above the current POC, then breaks and retests cleanly, I’ll be looking for long opportunities. If it breaks below the POC, I will step aside and abandon the long bias 🚫
This is not financial advice — just my personal market outlook. 💬📉📈

Breaking; Direct Digital Holdings, Inc. ($DRCT) Spike 37% TodayThe price of Direct Digital Holdings, Inc. (NASDAQ; NASDAQ:DRCT ) Spike 33% today gearing for a move to the $1 resistant amidst general market turmoil that saw notable tech stocks down with CRYPTOCAP:BTC dipping to the $80k zone.
NASDAQ:DRCT is looking poised to reclaim the $1 resistant as the relative strength index (RSI) is at 43 giving it ample of opportunity to capitalise on the dip.
In recent news, Direct Digital Holdings, Inc. (Nasdaq: DRCT) announced that it has received notice from the Listing Qualifications Department of The Nasdaq Stock Market notifying the Company that it has regained compliance with the minimum stockholders' equity requirement for continued listing on The Nasdaq Capital Market under Nasdaq Listing Rule 5550(b)(1), which requires listed companies to maintain stockholders' equity of at least $2,500,000.
Financial Performance
In 2024, Direct Digital Holdings's revenue was $62.29 million, a decrease of -60.35% compared to the previous year's $157.11 million. Losses were -$6.24 million, 184.2% more than in 2023.
Analyst Summary
According to one analyst, the rating for DRCT stock is "Strong Buy" and the 12-month stock price target is $6.0
About DRCT
Direct Digital Holdings, Inc. operates as an end-to-end full-service advertising and marketing platform. The company’s platform primarily focuses on providing advertising technology, data-driven campaign optimization, and other solutions to underserved and less efficient markets on both the buy- and sell-side of the digital advertising ecosystem. It serves various industry verticals, such as travel, education, healthcare, financial services, consumer products, and other sectors with a focus on small and mid-sized businesses.

NAS100 — Bearish Below 25,333 with Target at 25,054Price remains capped below the 25,333 key level, keeping the market in a clear bearish structure. As long as price trades under this zone, bullish attempts are likely to fail, and any rebounds should be viewed as corrective only. A sustained move below the intermediate supports at 25,181 and 25,166 strengthens the downside momentum and confirms continuation toward the primary bearish target at 25,054. Momentum and structure remain aligned to the downside while the key level holds.

Tech bubble burst?The Head and Shoulders (H&S) pattern is a classic reversal formation, typically found after a mature uptrend. It represents a gradual loss of buying pressure and a transition toward a potential downward move.
The H&S pattern often signals the exhaustion of bullish momentum, a shift in control toward sellers, and the possible beginning of a deeper reversal (sell-off).

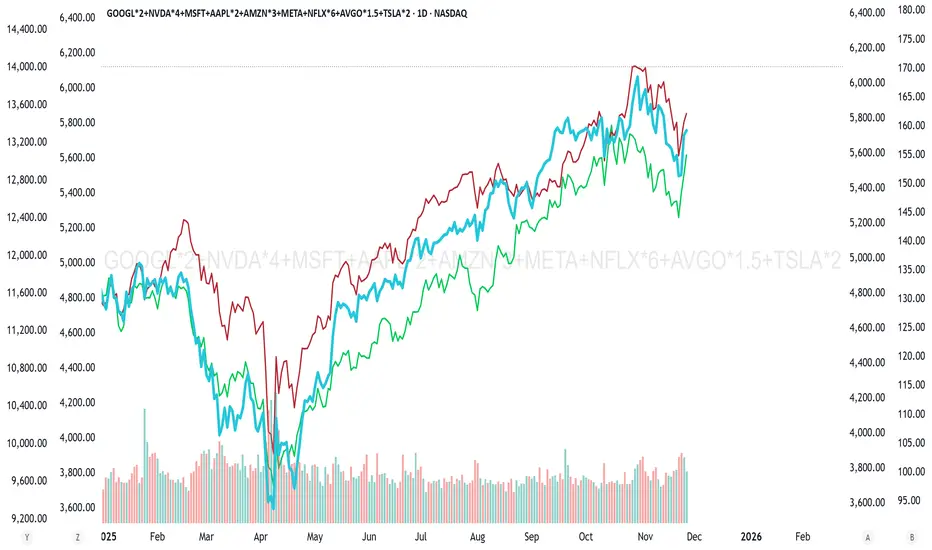
Week 48 Market Update — $SPXStrong week for the SP:SPX index. After two weeks of hesitation candles, price finally shifted back into strength and pushed decisively higher. This week’s candle not only reclaimed momentum but fully erased last week’s cooling-off behavior.
Price also moved well above the key mid-range levels that traders usually watch to define trend health. It’s now sitting firmly above the major risk zone and continues building distance away from it — a clear sign of strength. From the moment this week’s upside break triggered, the index has gained roughly 1.9%, and that kind of move typically translates into solid returns for options traders playing directional setups.
Major support zones sit lower around 5900, 5100, and the deeper structural support near 4000. As long as price holds above the upper layers of support, momentum remains intact.
On the higher-timeframe monthly chart, the trend has been active for eight straight months with no signs of exhaustion. Price is still far above the level where the monthly trend began, and even further above the long-term midline — showing how dominant the larger trend still is.
The 2-day chart continues to support the overall bullish structure, breaking above short-term levels and maintaining strength after multiple confirmations earlier in the week.
This week was a clean continuation of the broader uptrend — strong candle, strong momentum, and strong positioning above every major structural region.
Elite clarity. Elite precision. More coming soon.

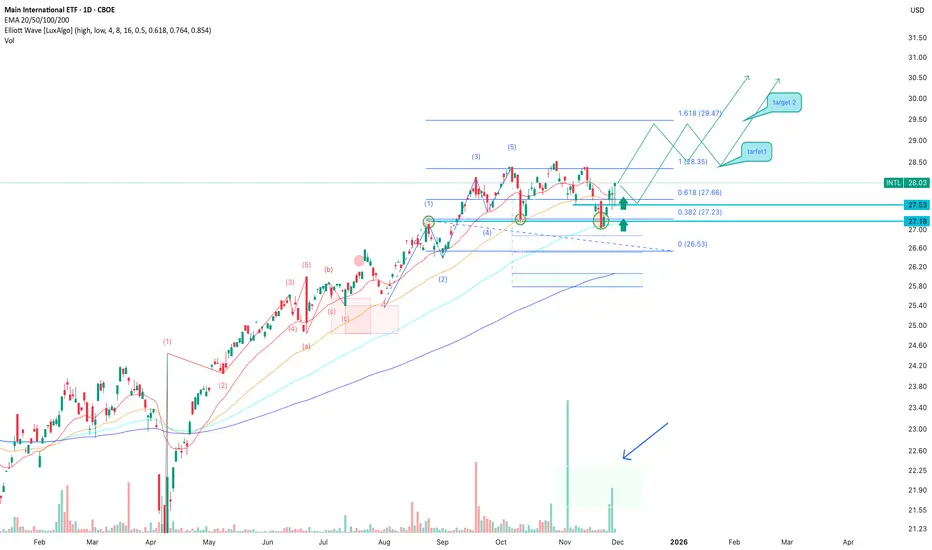
INTL: Bulls Defend Support — Buy Zone ActiveINTL remains one of the more stable international ETFs, and recent weeks show growing interest from larger players — rising volume at local lows signals accumulation. Fundamentally, the ETF is supported by diversified exposure to global companies, relatively low volatility, and renewed capital inflows into international markets as the USD cools off. This macro backdrop creates a solid foundation for a medium-term continuation of the uptrend, especially if expectations of potential Fed easing stay in place.
Technically, the price continues to defend the key support area at 27.50–27.20, where buying activity has appeared multiple times. The decline looks like a correction inside a broader bullish structure, while EMA 20/50/100 indicate a possible recovery. The Elliott wave structure also keeps the potential for a new impulsive move. A confirmed breakout above 28.35 would open the path toward 29.47 as the first target. The optimal entry is either after a confirmed hold above 28.00 or on a retest of 27.50–27.20 if a reversal signal forms.
Just In: Nebius Group N.V. (NASDAQ; $NBIS) Spike 5.61% YesterdayThe price of Nebius Group N.V. (NASDAQ; NASDAQ:NBIS ) Spike 5.61% in Thursday's market trading extending the gains to premarket session on Friday.
NASDAQ:NBIX is up 2% in Friday's premarket session amidst growing interest in the AI tech giant.
For NASDAQ:NBIX , if it manages to break the ceiling of the wedge formed- that is the $170 resistance, NASDAQ:NBIX will be set for a move to the $200 pivot.
Similarly, failure to achieve that fit might resort to a drawback to the $90 range shaking weak hands before picking liquidity up.
Nebius have received a haircut of 40-60% in recent weeks.
NBIS stands out for the highest ARR projections and a lower forward P/S ratio than Iren.
AI hosting demand is likely still underestimated by Wall Street, and further large contracts add to the investment thesis.
We believe NBIS stock could rise significantly in 2 years and still trade at a fair valuation, supported by technicals, despite execution and broader economic risks.
About NBIS
Nebius Group N.V., a technology company, engages in building full-stack infrastructure to service the global AI industry in the Netherlands, Europe, North America, and Israel. The company offers Nebius builds full-stack infrastructure for AI, including large-scale GPU clusters, cloud platforms, and tools and services for developers. It also provides Toloka, a data partner for various stages of generative AI development; TripleTen, an edtech platform for re-skilling individuals for careers in technolgy; and Avride.

Nasdaq 100 Ahead of the HolidaysNasdaq 100 Ahead of the Holidays
As the chart shows, the Nasdaq 100 has rebounded from its roughly 2.5-month low recorded on 21 November. At that point, bearish sentiment was driven by fears of an “AI bubble”, expectations of higher interest rates, and other news-related pressures.
The recovery from that level was strong — in less than a week the index gained around 5.3%, signalling robust demand. This not only offsets last week’s concerns but also injects optimism into the near-term outlook.
Technical Analysis of the Nasdaq 100 Chart
Examining recent price action in the Nasdaq 100, we can outline an ascending channel in which:
→ the median line acted as support until mid-November;
→ support at the lower boundary helped form the 21 November low.
From the perspective of buying pressure:
→ The November dip appears to be an intermediate correction within a broader emerging uptrend.
→ The brief move below the psychological 24k level (where the notable September and October lows lie) resembles a Liquidity Grab pattern, suggesting so-called Smart Money may have used sellers’ liquidity to build long positions — a sign of bullish intent.
From the perspective of selling pressure:
→ the market remains within a corrective structure (highlighted in red);
→ today, the Nasdaq 100 is trading near 25,265, a level that acted as resistance on 17–20 November.
It is possible that trading near the channel’s median line will encourage a balance between buying and selling forces — just as market participants head off to celebrate Thanksgiving.
This article represents the opinion of the Companies operating under the FXOpen brand only. It is not to be construed as an offer, solicitation, or recommendation with respect to products and services provided by the Companies operating under the FXOpen brand, nor is it to be considered financial advice.

Got Microcaps?Sure the market is whipsawing up and down, the VIX is comparatively high, and the Head and Shoulders pattern on Bitcoin and SPY looms large. But... have you checked out IWC, the ETF that tracks an index of microcap stocks? They have performed in line with other indexes, but today this ETF is up two and a half percent, while QQQ and SPY are plodding higher at less than one percent.
Looking for setups on small caps and micro caps might be a worthwhile addition to your trading tactics from now until the end of the year.
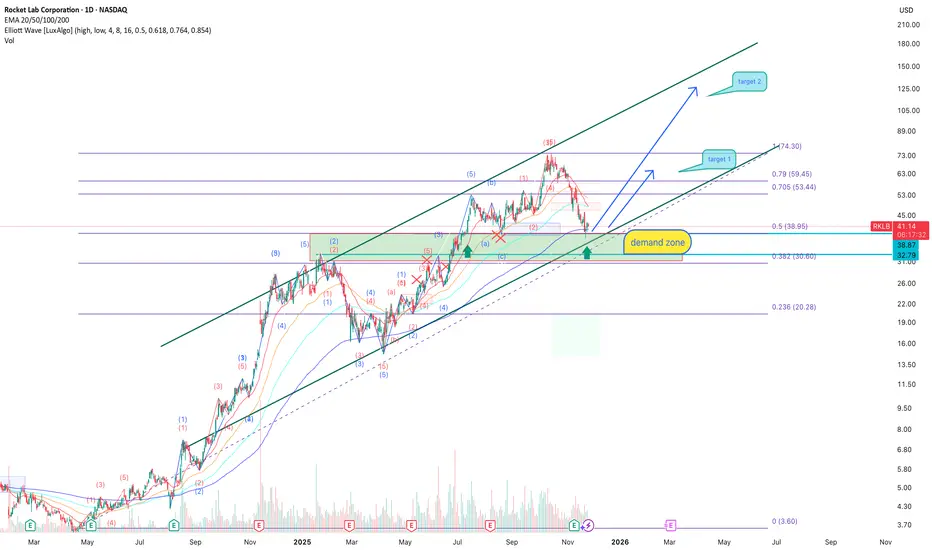
RKLB: demand zone may launch the next rallyRocket Lab remains one of the strongest long-term stories in the small-launch sector. The company continues expanding production capacity, scaling its launch cadence, securing new government contracts, and increasing recurring revenue from satellite services. The global demand for small-satellite deployment is growing faster than supply, and RKLB is steadily becoming the second major player after SpaceX in the commercial-launch and orbital-services niche. Additional growth in spacecraft manufacturing and analytics strengthens the company’s strategic positioning. From a long-term fundamental perspective, the recent price decline looks more like a technical correction inside a broader bullish cycle, rather than a structural reversal. For mid- and long-term investors, this area historically acts as a key accumulation zone -especially when fundamentals align with major technical supports.
Technically, price has held a major demand zone between 38–33 USD - the same zone that previously generated strong upward impulses. The correction stopped right at the 0.5 Fibonacci retracement (38.95), and buyers are showing absorption on lower timeframes. Price remains inside the broader ascending channel, while EMA 20/50 are stabilizing above the demand level, suggesting momentum may soon shift upward again. A clean entry setup forms once the market breaks and confirms the 0.705/0.79 Fibonacci cluster, opening the road toward the first target at 59.45 and then the extended target at 74.30. The bullish scenario remains valid as long as price stays within the demand zone and above the long-term trendline.
Fundamentally, the engine is already running -now all the chart needs is technical ignition to send RKLB back into the upper band of the long-term channel.
Blue Bird Corporation (NASDAQ: $BLBD) Set for Earnings ReportBlue Bird Corporation (NASDAQ: NASDAQ:BLBD ) is schedule to report her earnings results today after market close. The asset has close Friday's trading session up 6% trading within the ceiling of the resistant zone at $60.
With the RSI at 65, a little thrust from the bulls will break the ceiling of the $60 resistant as more buyers step in.
The stock price has increased by +36.95% in the last 52 weeks. In the last 12 months, Blue Bird had revenue of $1.42 billion and earned $115.89 million in profits. Earnings per share was $3.49.
The 6 analysts that cover Blue Bird stock have a consensus rating of "Strong Buy" and an average price target of $63, which forecasts a 17.06% increase in the stock price over the next year. The lowest target is $50 and the highest is $71.
Financial Performance
In 2024, Blue Bird's revenue was $1.35 billion, an increase of 18.92% compared to the previous year's $1.13 billion. Earnings were $105.55 million, an increase of 343.25%.
About BLBD
Blue Bird Corporation, together with its subsidiaries, designs, engineers, manufactures, and sells school buses in the United States, Canada, and internationally. The company operates through two segments, Bus and Parts. It offers Type C, Type D, and specialty buses; and alternative power options through its propane powered, gasoline powered, compressed natural gas powered, and electric powered school buses, as well as diesel engines.

Nasdaq NAS100 Analysis: The Conditions I Need Before Going ShortI'm keeping a close eye on NAS100 (Nasdaq) right now. 📉✨ On the 4H timeframe, price remains in a clean, sustained bearish trend, and I'm anticipating a potential continuation lower.
If price rejects the current level and fails to retrace through the 1H imbalance, and we see a rotation followed by a bearish break of structure, I'll be preparing for a short opportunity. 📊🔻
Not financial advice.

ROBINHOOD HOOD Bearish Playbook — Thief on Duty!📉 ROBINHOOD MARKETS INC. (HOOD) — Bearish Profit Playbook
🔥 Swing / Day-Trade Thesis with Thief Layer Strategy
🧭 Market Context & Core Idea
The bearish outlook is confirmed after HULL Moving Average shows a downside breakout, signaling momentum shifting toward sellers. This forms the backbone of today’s playbook 📉⚔️.
The setup focuses on a layered entry (Thief Strategy) — a structured way of placing multiple limit orders at different price levels to average into premium zones with precision.
🎯 Plan: Bearish Setup with Thief-Style Layered Execution
This plan uses multiple SELL LIMIT layers, allowing flexibility and better control across volatility zones:
🔻 Layered Entry Zones (Sell Limit Layers)
125.00
120.00
115.00
110.00
(You may increase the number of layers based on your own approach — thief style is flexible.) 😎🧤
🛑 Stop-Loss (Thief SL)
SL @ 130.00
⚠️ Dear Ladies & Gentlemen (Thief OGs), this SL is not a recommendation — adjust your stop according to your own risk appetite. You make the money, you take it at your own risk.
🏁 Target Zone
The Moving Average is acting as strong support, and current structure suggests oversold conditions + a possible bullish trap scenario.
🎯 Target @ 92.00
⚠️ Dear Ladies & Gentlemen (Thief OGs), this TP is not fixed — targets must match your personal risk-to-reward logic. Manage wisely.
📊 Why This Setup Works (Key Technical Notes)
✨ HULL Moving Average breakout confirms bearish flow
✨ Multi-layer entries help capture stretched price spikes
✨ Oversold conditions hint at potential profit-taking zones
✨ Support zones + price traps increase snap-back volatility
✨ Ideal for swing/day-traders who prefer structured scaling
🔍 Related Pairs to Watch (Correlation Radar)
Tracking correlated or sentiment-linked assets helps understand broader flows:
🧩 Tech / Growth Sentiment Links:
NASDAQ:QQQ — reflects overall high-beta sentiment & liquidity
CBOE:ARKK — tracks innovation/growth appetite
NASDAQ:COIN — crypto-linked sentiment often spills into HOOD
NYSE:XYZ — fintech risk appetite correlation
NASDAQ:SOFI — retail-driven growth behavior overlaps with HOOD
🧲 Key Takeaways:
When growth ETFs weaken, HOOD typically accelerates momentum
Retail-heavy assets show higher reaction to volatility spikes
Watching these helps confirm whether HOOD’s breakdown has strength
✨ “If you find value in my analysis, a 👍 and 🚀 boost is much appreciated — it helps me share more setups with the community!”
Disclaimer: This is a thief-style trading strategy just for fun.

COIN Short Trade Setup — Smart Entry Levels Revealed!🎯 COIN "The Crypto Exchange Heist" 💰
Stock Market Profit Playbook for Swing & Day Traders
📈 Analysis Overview 🔍
Asset: NASDAQ:COIN | Coinbase Global Inc. ⚡
Current Price: $295.22 (Nov 7, 2025) 💵
Market Cap: $79.60B 🏆
Trading Volume: Bullish liquidity ✅
Technical Bias: BEARISH CONFIRMED ⬇️
🎲 The Setup: Bearish Hull Moving Average Breakout
We've identified a critical bearish breakdown pattern with Hull Moving Average (HMA) confirmation. The rejection from the $350 resistance zone combined with oversold conditions creates the perfect "HEIST" opportunity for disciplined traders.
Key Technical Signals 🚨:
✅ Hull MA showing downtrend confirmation
✅ Price rejection from upper resistance
✅ Volume compression into breakdown
✅ RSI divergence in overbought territory
✅ Support trap formation at key levels
🎪 ENTRY STRATEGY: The "Layering Heist" Technique 💎
Method: Multiple Limit Order Layers (Position Stacking Strategy)
Instead of chasing ONE entry, we deploy the Thief OG Layering System — multiple entry levels to average down as the bearish thesis develops:
📍 Entry Layers (Top to Bottom):
Layer 1: $340.00 💎
Layer 2: $330.00 💎
Layer 3: $320.00 💎
Layer 4: $310.00 💎
Pro Tip: Feel free to add MORE layers based on your risk tolerance and account size! The more precise your layers, the better your average entry price. 🎯
🛑 Stop Loss Placement (Risk Management Critical)
Thief OG's Recommended SL: $350.00 🚫
This sits above the rejection zone — if price reclaims $350+, the bearish thesis is invalidated, and we exit.
⚠️ DISCLAIMER: This is YOUR trade. We recommend this SL, but YOU control your risk. Adjust based on your position size and risk appetite. No feelings — just math! 📊
🎁 PROFIT TARGET (The "Escape Plan")
Primary Target: $240.00 🎯
Target Type: Strong Support + Oversold Zone + Trap Confirmation
Why $240?
Historical support confluence 📍
RSI reaching oversold extremes 📉
Previous institutional accumulation zone 🏦
Fibonacci 0.618 retracement level ✨
⚠️ CRITICAL NOTE: This is YOUR profit target decision. Once you're in profit, TAKE YOUR MONEY — don't be greedy! Secure gains at comfortable levels. Risk management > Ego. 💪
📊 Correlation Pairs to Watch 🔗
Keep an eye on these related assets for confluence signals:
Bitcoin (BTC)
Price Action: CRYPTOCAP:BTC is COIN's strongest correlation driver
Why?: Crypto market sentiment flows through BTC first → COIN follows
Watch For: BTC breaking $100K could trigger COIN capitulation 📉
Ethereum (ETH) 💠
Price Action: CRYPTOCAP:ETH directional bias impacts institutional flows
Why?: ETH derivative volume is massive on COIN's platform
Watch For: ETH breaking below $3,500 = bearish acceleration ⬇️
Nasdaq 100 (QQQ) 📈
Price Action: NASDAQ:QQQ tech sector health matters
Why?: COIN correlates with tech rallies & risk-off dumps
Watch For: QQQ support breaks = COIN weakness confirmed 🔴
Fear & Greed Index 😨😊
Watch: Extreme Greed (75+) = Potential top | Extreme Fear (25-) = Potential bottom
Why?: COIN is highly sentiment-driven
Action: Lower entries during Fear zones for better risk/reward 🎰
📋 Trade Checklist Before You Enter ✅
Confirm HMA bearish alignment on your timeframe
Check BTC & ETH correlation for confluence
Position size = Max 2-3% portfolio risk per trade
Set alerts at each layer level
NEVER move SL in the red (that's a LOSS, not protection)
Secure profits on the way up (don't wait for PT)
Journal every trade (you learn more from losses)
💡 Pro Trading Tips 🧠
Size Down in Uncertainty — If volume is low, position smaller
Trail Your SL — Once profit doubles, move SL to breakeven
Partial Profits — Take 50% at $280, let the rest run to $240
Never Average-Up — Only add on confirmations going DOWN
Time Your Layers — Don't slam all orders at once; space them out
📢 Join The Community 🚀
✨ If you find value in my analysis, a 👍 and 🚀 boost is much appreciated — it helps me share more setups with the community!
#COIN #Coinbase #CryptoTrading #SwingTrade #DayTrade #TechnicalAnalysis #BearishSetup #TradingStrategy #CryptoExchange #NASDAQ #HullMovingAverage #TradingIdeas #CryptoMarkets #RiskManagement #ProfitPlaybook #ThiefStrategy #EditorPick 🚀✨

PayPal Under Pressure! Bearish WMA Break Signals Downside🎯 PYPL: The "Weighted MA Breakout Heist" 💰 | Bears Taking Control
📊 Asset Overview
PayPal Holdings Inc. (NASDAQ:PYPL) - Digital payments heavyweight showing bearish signals after weighted moving average breakdown.
🔍 The Setup: When Moving Averages Tell Tales
The chart's singing a bearish tune, folks! 🎵 We've got a Weighted Moving Average breakout to the downside — and when WMA breaks, it usually doesn't ask for permission to keep falling. Think of it like gravity... but for stock prices! 📉
💡 Trade Blueprint
🚪 Entry Zone
Flexible entry approach - Current market price works as entry. The beauty of this setup? The trend is your friend, so catching this wave at various levels could work. Just don't chase it blindly!
💭 Pro Tip: Scale in rather than going all-in at once. Dollar-cost averaging on the way down can be your best friend in bearish plays.
🛡️ Risk Management (The "Safety Net" Level)
Stop Loss: $68.00 🚨
Look, I'm calling this the "thief SL" because if price touches this level, you need to exit stage left — no questions asked! This isn't financial advice, just a technical level where the bearish thesis breaks down.
⚠️ Important: Set YOUR OWN stop loss based on your risk tolerance and account size. This is just a technical reference point, not a commandment carved in stone!
🎯 Profit Target (The "Escape Route")
Target: $60.00 💵
Why $60? Three compelling reasons:
📍 Moving Average Support Zone - Historical MA convergence area
📉 Oversold Territory - RSI/momentum indicators suggest potential bounce zone
Liquidity Trap Alert - Big money often parks orders here
⚠️ Reality Check: Markets don't move in straight lines. Take profits along the way! Suggested approach: Scale out 30% at $63, another 40% at $61.50, and let the final 30% ride to $60.
🔗 Related Pairs to Watch (Correlation Play)
Keep your eyes on these tickers — they often move in sympathy with PYPL:
SET:SQ (Block Inc.) - Fellow fintech, similar payment space dynamics 🔄
$V (Visa) - Traditional payment processor, inverse correlation during fintech weakness 💳
NYSE:MA (Mastercard) - Same logic as Visa, watch for divergence 🏦
NASDAQ:COIN (Coinbase) - Crypto exposure correlation with digital payment sentiment 🪙
NASDAQ:SHOP (Shopify) - E-commerce correlation, PYPL's merchant base overlap 🛒
Key Correlation Note: When fintech stocks sell off, traditional payment processors often see inflows. Watch the $V and NYSE:MA strength as potential confirmation of PYPL weakness!
📈 Technical Highlights
✅ Weighted Moving Average breakdown confirmed
✅ Volume supporting the bearish move
✅ Lower highs and lower lows pattern forming
✅ Key support zones identified below
✅ Risk-reward ratio favors the short side
⚡ The "Thief Style" Philosophy
This isn't about being greedy — it's about being strategic! 🎭 We identify the setup, execute with precision, and exit with profits before the crowd realizes what happened. That's the art of tactical trading!
Remember: The market doesn't care about your opinion. Price action is king 👑
✨ If you find value in my analysis, a 👍 and 🚀 boost is much appreciated — it helps me share more setups with the community!
#PYPL #PayPal #DayTrading #BearishSetup #TechnicalAnalysis #MovingAverageBreakout #SwingTrading #StockMarket #TradingView #ThiefStyle #PriceAction #RiskManagement #Fintech #NASDAQ #ShortSetup #TradingStrategy #ChartAnalysis #MarketAnalysis #TradingIdeas #StockTrading

US100 Reversal Map – Hull MA + Heikin Ashi Confirmation🧠 US100 / NASDAQ100 Profit Pathway Setup — The Thief’s Bullish Escape Plan! 💰🚀
📊 Market Bias: Bullish (Day Trade Setup)
The Thief Trader has spotted a golden pathway in the NASDAQ100 (US100)!
Here’s the breakdown of the plan — straight from the thief’s vault 🕵️♂️📈
🎯 Plan Overview
Bias: Bullish continuation confirmed
Technical Confirmation:
✅ Double Pullback on Hull Moving Average
✅ Retest Zone successfully defended
✅ Heikin Ashi Bullish Doji signaled a trend reversal confirmation
💡 Momentum is shifting upward — the trend has officially changed!
💎 Entry Strategy (Layered Thief Style)
The Thief Strategy applies a layered entry method — multiple buy limits to average into strength.
📥 Buy Limit Layers:
25,300
25,400
25,500
25,600
(Traders can adjust or add more layers based on risk appetite and confirmation zones.)
🛡️ Stop-Loss Setup
This is the Thief SL @ 25,100
⚠️ Note to Thief OG’s:
I’m not recommending my SL as your SL — always customize risk and secure your own bag. Manage your position with discipline and independence! 💼
🎯 Take-Profit Zone
Target: 26,200
🚨 The Police Barricade Zone acts as a strong resistance — overbought levels spotted and potential bull trap alert!
Kindly exit with profit before the officers arrive. 😎
⚠️ Note: Profit-taking is at your discretion. Book and Run!
📈 Related Pairs to Watch (Correlation Insight)
NASDAQ:NDX / CAPITALCOM:US100 / NASDAQ:QQQ : All mirror NASDAQ movement.
SP:SPX / AMEX:SPY : Often correlate with NASDAQ’s momentum (watch divergence for clues).
TVC:VIX : If volatility spikes, expect pullbacks on tech-heavy indices.
TVC:DXY : A weak dollar often fuels US100 bullish legs — keep an eye on it.
NASDAQ:AAPL / NASDAQ:MSFT / NASDAQ:NVDA : Leading drivers of NASDAQ — if they pump, the index follows. 💪
🧩 Key Insights
Hull MA alignment confirms momentum shift.
Retest + bullish Heikin Ashi Doji = market reversal confirmation.
Layered entries give flexibility in volatile intraday conditions.
Dynamic risk management is key — never marry a position.
✨ “If you find value in my analysis, a 👍 and 🚀 boost is much appreciated — it helps me share more setups with the community!”
#US100 #NASDAQ100 #ThiefTrader #DayTrading #IndexTrading #HullMA #HeikinAshi #LayeredEntries #TechnicalAnalysis #TradingSetup #PriceAction #MarketReversal #TradingCommunity #BullishPlan #SmartMoneyFlow #TradeIdeas #ThiefStrategy

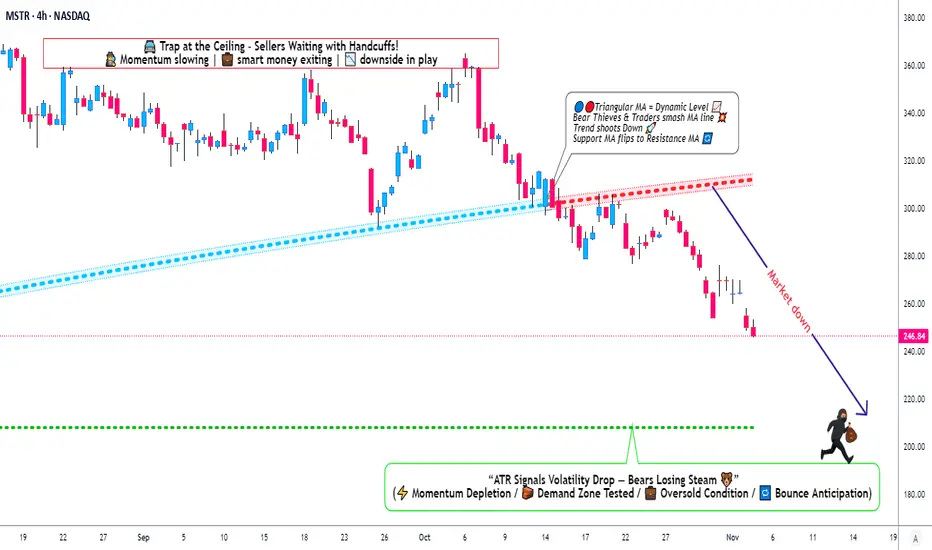
MicroStrategy Under Pressure: Bearish Playbook in Action🎯 MSTR: The "Thief's Playbook" - Strategic Bear Trap Setup! 💰🔥
📊 Asset Overview
MicroStrategy Inc. (MSTR) - Bitcoin's Proxy Play in the Stock Market
🎭 The Setup: When Bears Come to Party
Alright folks, gather 'round! We've got ourselves a textbook triangular moving average breakdown on MSTR that's screaming "short opportunity" louder than my portfolio after a bad trade week! 😅
Current Market Sentiment: 🐻 BEARISH CONFIRMED
The technicals are aligning like planets before a lunar eclipse - and trust me, this eclipse might cast some shadows on those long positions!
🎯 The "Thief Strategy" Game Plan
🚪 Entry Zones - The Layering Approach
Here's where it gets spicy! 🌶️ Instead of going all-in like a degen at a casino, we're using the "Thief Layering Method" - multiple limit sell orders to scale into this position:
Suggested Entry Layers:
🥇 Layer 1: $300
🥈 Layer 2: $290
🥉 Layer 3: $280
💎 Layer 4: $270
🔥 Layer 5: $260
Pro Tip: You can add MORE layers based on your risk appetite and account size. More layers = Better average entry = Smoother sleep at night! 😴
🛡️ Risk Management - The "Oh Sh*t" Line
Stop Loss: 🚨 $320
⚠️ IMPORTANT NOTICE: Dear Thief OGs, Ladies & Gentlemen! This SL is MY line in the sand. YOU need to decide YOUR own risk tolerance. Trade at your own risk, manage your own money, and don't blame me if things go sideways! This ain't financial advice - it's entertainment with charts! 🎪
🎁 Target Zone - Where We Cash Out
Take Profit Target: 🎯 $210
Why $210?
💪 Strong historical support level
📉 Oversold territory expected
Classic bull trap zone where longs get liquidated
⚠️ ANOTHER IMPORTANT NOTICE: Thief OGs! This is MY target. You do YOU! If you see profits earlier and want to secure the bag - DO IT! Don't be greedy. Take profits when YOU feel comfortable. Your account, your rules, your responsibility! 💼
🔗 Related Assets to Watch - The Correlation Game
Keep your eyes on these bad boys for confirmation:
📈 Direct Correlations:
NASDAQ:MARA (Marathon Digital) - Bitcoin miner, moves with crypto sentiment
NASDAQ:RIOT (Riot Platforms) - Another BTC miner, similar volatility pattern
NASDAQ:COIN (Coinbase) - Crypto exchange, sentiment indicator
CRYPTOCAP:BTC (Bitcoin spot) - The godfather! MSTR holds massive BTC, direct correlation
🧠 Key Points:
MSTR trades with ~1.5x-2x Bitcoin beta (more volatile than BTC itself)
When Bitcoin dumps, MSTR often dumps HARDER 📉
Watch BTC support at $60K - if it breaks, MSTR likely follows to our target zone
Tech sector weakness ( NASDAQ:QQQ , AMEX:SPY ) adds bearish pressure
⚡ Trading Psychology - The "Thief Mindset"
Look, this setup requires PATIENCE! 🧘♂️ Don't FOMO in at market price. Layer in like a professional thief planning a heist - calculated, methodical, strategic! This isn't gambling; it's probability management with a side of humor! 😎
🎪 Final Word from Your Friendly Neighborhood Chart Thief
Remember: Markets are wild, unpredictable, and don't care about your feelings OR your bills! This analysis is for educational and entertainment purposes ONLY. The "Thief Strategy" is MY trading style - it's risky, it's aggressive, and it's definitely NOT for everyone!
Do your own research. Manage your own risk. Trade what you can afford to lose. And for the love of all that's holy, don't mortgage your house based on some random internet chart analysis! 🏠❌
✨ If you find value in my analysis, a 👍 and 🚀 boost is much appreciated — it helps me share more setups with the community!
🏷️ #MSTR #MicroStrategy #ShortSetup #BearishBreakdown #SwingTrade #DayTrade #ThiefStrategy #BitcoinStocks #TechnicalAnalysis #MovingAverageCrossover #LayeringStrategy #RiskManagement #StockMarket #TradingIdeas #BTC #CryptoStocks #BearTrap #SupportAndResistance #ChartAnalysis #TradeSmart
🎯 Trade smart, layer in, manage risk, and may the profits be ever in your favor! 💰🚀