Nasdaq market analysis: 17-MAR-2025Good morning! Happy New Week! Happy New Day! Here's your daily Nasdaq market analysis. Learn, grow, and trade wisely.
Nasdaq100

TESLA: Is there light at the end of the tunnel? Attention!As we've all seen in recent weeks, the markets have taken a huge hit due to Mr. Trump's tariff policy, but if we have to single out any company in particular, it's undoubtedly TESLA. TESLA has clearly suffered a BOYCOTT as punishment for the tariffs. The punishment is so severe that it has already come to light that ELON MUSK HAS PRESSURED TRUMP on the tariff issue because they are seriously affecting his companies, TESLA and SPACEX.
--> Will ELON MUSK be able to convince Trump that he's not on the right path?
I think so, because Trump himself isn't interested in watching the American market continue to fall while Europe continues to skyrocket. Therefore, it's VERY PROBABLE that we'll start to see positive messages for the American market coming directly from the White House.
--> And TESLA? What is the company's technical outlook?
To analyze the company, we will use the H1 chart and the SUMMARY TABLE above. I have also added the Daily chart to get a general overview of its situation. If we analyze the table, we see the following:
1) Weekly: BULLISH (losing strength), meaning its trend remains BULLISH despite its declines, but it is losing strength.
2) Daily: NEUTRAL. The trend is NOT DEFINED on the daily chart, and therefore, we must look at another timeframe to be able to predict whether it will turn bullish or bearish at some point.
3) H4: BEARISH (losing strength). Its trend is BEARISH, but it is LOSING STRENGTH, meaning it is beginning to gain bullish momentum.
4) H1: BEARISH (retracement). The trend on H1 is DOWNWARD, but it's in a RECOVERY PHASE; it's RISING, as can be seen on the chart that has marked the BULL signal.
Therefore, looking at the H1 chart, let's see what key areas we need to monitor to know when to go long or short at some point.
1) On the downside, 200 is a very important support that SHOULD NOT BE LOST, because if it does, the fall could be much greater.
2) And on the upside, we have the 262 and 303 zones. If it clearly breaks through this last zone, it would be the START of a TREND CHANGE on the H1 TIME FRAME and therefore could be a good entry point, considering it could reach the year's highs again.
In short, we are still in a bullish trend in the long term and a bearish trend in the short term, BUT the H1 chart is starting to gain BULLISH STRENGTH. We'll be on the lookout for a possible long entry when the H1 chart shows an uptrend again. And ALL with TRUMP's permission!!!
Best regards and good luck in the markets!!

NASDAQ about to nuke?In my previous ideas and posts i told you about #nasdaq chart structure' s weaknesses. Well, it has already made the extended rally and the time has likely come.
In lower time frame, nasdaq, spx and dji already started dumps and broke the local supports.
In monthly candle stick size, i mean higher time frame, #nasdaq100 chart:
- Formed a huge bearish divergence
- Stoch RSI made bearish triple top
- MACD is warning about the trend reversal (Bullish to bearish)
The strong support zones in HTF are:
Monthly EMA Ribbon at 15000
Monthly İchimoku Cloud bottom at 12000
The stronghold the historical trendline support at 6000.
This strategy is NOT a SHORT TERM strategy and NOT FINANCIAL ADVICE. Dyor.
Just avoid being over greedy.

Appetite For Risk Through the Lens of Nasdaq and BitcoinBitcoin tends to track Wall Street sentiment well, particularly compared to the Nasdaq. Growing concerns that Trump's policies will tip the US (and therefore the global economy) into a recession, which currently has the Nasdaq on the ropes and bitcoin getting dragged along for the ride. And there could be further losses to follow, though a cheeky bounce at a minimum could be due first.
Matt Simpson, Market Analyst and City Index and Forex.com

META: Key support! Watch out for a possible opportunity!For a few weeks now we have been experiencing PANIC in the markets due to Trump's AGGRESSION with tariffs. The question we all have to ask ourselves is whether the USA will enter a RECESSION and ALL COMPANIES will continue to fall sharply, or on the contrary, if Trump will negotiate and therefore the markets will RECOVER.
From my point of view, TRUMP has become too aggressive and IS ALREADY STARTING TO WORRY ABOUT SOME COMMENTS OF THE LAST FEW DAYS, and HE WILL NEGOTIATE!! Regardless of this, there are companies that despite the great fall suffered, REMAIN BULLISH AND POSITIVE in the year, as is the case of META, which has risen by +2% in 2025.
The graph above SHOWS YEAR BY YEAR the trend and WHEN a CHANGE IN TREND occurs, in this way we will see more clearly the current situation of the company this year. In the graph below with H4 time frame we see a ZOOM of the current situation to know more precisely when a floor is formed and the retreat phase in which it is immersed ends.
If we look at this year 2025, its TREND is still BULLISH in a RECOIL PHASE and at this moment it is in A VERY IMPORTANT SUPPORT that it should respect (zone 580) in order NOT TO START A CHANGE IN TREND.
If the zone respects it and a BOTTOM is formed, the price will quickly rise towards its first resistance at 641, which if it is surpassed WE WILL SEE NEW MAXIMUMS in the value.
---> What do we do?
1) If our PROFILE is AGGRESSIVE, we enter LONG IN THE CURRENT ZONE.
2) If our PROFILE is CONSERVATIVE, WE WAIT for a floor to form or for the price to surpass the 641 zone.
-------------------------------------
Strategy to follow IF OUR PROFILE IS AGGRESSIVE:
ENTRY: We will open 2 long positions in the current zone of 610
POSITION 1 (TP1): We close the first position in the 640 zone (+5.5%)
--> Stop Loss at 568 (-6%).
POSITION 2 (TP2): We open a Trailing Stop type position.
--> Initial dynamic Stop Loss at (-6%) (coinciding with the 568 of position 1).
---We modify the dynamic Stop Loss to (-1%) when the price reaches TP1 (640).
-------------------------------------------
SET UP EXPLANATIONS
*** How do we know which 2 long positions to open? Let's take an example: If we want to invest 2,000 euros in the stock, what we do is divide that amount by 2, and instead of opening 1 position of 2,000, we will open 2 positions of 1,000 each.
*** What is a Trailing Stop? A Trailing Stop allows a trade to continue gaining value when the market price moves in a favorable direction, but automatically closes the trade if the market price suddenly moves in an unfavorable direction by a certain distance. That certain distance is the dynamic Stop Loss.
-->Example: If the dynamic Stop Loss is at -1%, it means that if the price drops by -1%, the position will be closed. If the price rises, the Stop Loss also rises to maintain that -1% during increases, therefore, the risk is increasingly lower until the position becomes profitable. In this way, very solid and stable price trends can be taken advantage of.

18 Times, +2000%, 5800 Days - All About NASDAQ100 Corrections!Hi, all!
I need to repost some of my recent ideas on TradingView due to issues with the platform's moderation. Let's start! The most up-to-date post is coming right away - one that serves as a timely reminder during these interesting times: never forget history.
From November 2008 to February 2025, the Nasdaq 100 (NDX) index has grown by over 2000%! Yes, that’s a 20x increase! This tech giant, made up of the 100 leading technology stocks, has shown impressive strength.
For comparison, the S&P 500 has risen about 820% in the same period. A great performance but Nasdaq 100 leaves it far behind.
Has this been a straight-line rise? Not really. Looking back, it may seem like the perfect investment. But the road was not smooth. Nasdaq 100’s success came with painful drops, investor panic, and moments when it felt like the market would never recover.
From the outside, everything looks great. But would you sit through a 30% drop, while the news is screaming about the "end of the world"?
So, I decided to analyze every correction of 10% or more since the market bottom in 2008.
- How long do corrections and recoveries last?
- How often do they happen?
- What should investors know?
- Can this help you in any way?
DATA ANALYSIS - 18 corrections in Nasdaq 100 (2008–2025), -10% or more.
Retracement Stats:
- Average drop: -15%
- Median drop: -13%
- Biggest drop: -37.72%
- Smallest drop: -10%
Correction Length (17 completed corrections): How many days does a correction last from the peak to the bottom?
- Average: 60 days
- Median: 35 days
- Longest: 325 days
- Shortest: 14 days
Recovery Time: From bottom back to new highs.
- Average: 165 days (~5.5 months)
- Median: 119 days (~4 months)
- Longest: 752 days (over 2 years)
- Shortest: 42 days (~1.5 months)
Correction Frequency
If we take a rough estimate, in 5800 days, there were 18 corrections, which means a correction happens every 322 days (~10.5 months) on average.
Total Time Spent in Corrections vs. Rising Markets
- Corrections lasted 1016 days
- Recoveries lasted 2801 days
- Total time spent in "work mode": 3817 days
- Total "smooth uptrend" days: 1983 days (~5.4 years)
Basically, like a hardworking employee – the market spends more time struggling than rising!
What Can Investors Learn from This?
1. Accept Volatility
Knowing that market swings are normal, investors can keep a long-term perspective and avoid panic-selling during downturns.
2. Nasdaq 100 Has Always Recovered
In the long run, Nasdaq 100 has always bounced back to new highs. Each recovery has been different, but so far, making new all-time highs has never been a problem.
3. Make Better Decisions
Understanding psychological biases helps investors make rational choices and manage risks better.
4. Market Drops = Opportunities, Not Threats
Most big market rallies started when most investors were too scared to buy.
"A simple rule dictates my buying: Be fearful when others are greedy, and be greedy when others are fearful." – Warren Buffett
Market drops always feel unique and scary but history shows they follow repeating patterns. And those who keep their emotions in check have the best opportunities.
"The time to buy is when there's blood in the streets." – Baron Rothschild
Final Thoughts: Is the current retracement a buying opportunity? No one knows for sure but history suggests - stay calm!
So, that's all. Like & Boost if you find this useful! 🚀
Have great day,
Vaido
💬 Before you leave... What’s your take on the current Nasdaq 100 correction? Drop your thoughts in the comments 👇
Nasdaq 100 Enters CorrectionNasdaq 100 Enters Correction
As shown on the Nasdaq 100 (US Tech 100 mini on FXOpen) index chart today:
→ The index has fallen below the psychological 20,000-point level, reaching its lowest in approximately six months.
→ The decline from the December peak now exceeds 10%, officially marking the start of a correction.
Why the Nasdaq 100 Is Falling Today
Bearish sentiment stems from a combination of factors, including (according to Zacks analysts):
→ The Trump administration’s tariff policies and their potential economic impact. Concerns increased after the latest jobs report showed unemployment rising from 4.0% to 4.1%.
→ Worries about AI investment costs and their long-term profitability.
→ Market anticipation of tomorrow’s Consumer Price Index (CPI) release at 15:30 GMT+3.
Technical Analysis of the Nasdaq 100 Chart
Price movements indicate that the steeper growth channel (marked in black), which had been in place since last August, has lost relevance. A broader view of the chart reveals that the index has now approached the lower boundary of a long-term channel (marked in blue), which has been forming since early 2024. Key price formations that helped define this channel are highlighted in orange.
Given that the index is at the lower boundary of the blue channel and the RSI indicator on the daily chart has dropped to multi-year lows, a short-term recovery may be likely. However, the fundamental backdrop will play a decisive role—clear signs of U.S. economic stability could support a rebound, while extreme fear (as reflected in CNN’s Fear & Greed Index) may continue to weigh on sentiment.
This article represents the opinion of the Companies operating under the FXOpen brand only. It is not to be construed as an offer, solicitation, or recommendation with respect to products and services provided by the Companies operating under the FXOpen brand, nor is it to be considered financial advice.

$NAS100 may settle around 17300 @ 0.382 Fib Retracement PEPPERSTONE:NAS100 is already in the correction territory with down more than 10%. If this bear market holds grip, then we might get into the bear market territory with 20% or more correction. This might be coincidental. Let’s get to the numbers behind this reasoning.
The lows on Aug 5th carry trade set back was 17300.
The Trump 1.0 tariff also send the PEPPERSTONE:NAS100 down by 23% before the market started a meaningful bounce. If we have a 23% drawdown from the top of PEPPERSTONE:NAS100 then we will be back @ 17300.
If you plot the upward sloping Fib retracement levels on PEPPERSTONE:NAS100 which we discussed in this blog on 01 March when I sounded bearish predicting a 10% downturn in the near term. Link here. The 0.382 Fib retracement level in this long term upward sloping channel lies around 17300.
Tell me coincidence but all these 3 indicators align at 17300. Will the PEPPERSTONE:NAS100 settle at 17300 before this bear market correction is done and dusted? No one knows.
Buy PEPPERSTONE:NAS100 from here till 17300.

NASDAQ 100 Elliott Wave Analysis – A High-Probability Setup in P📌 Is the NASDAQ 100 in a Bearish Impulse Wave?
Based on Elliott Wave analysis, NASDAQ 100 appears to be in Wave 3 of an ongoing bearish impulse (Wave A or 1). This setup suggests that after the current downward move, we might see a corrective structure before another leg down.
Key Insights:
🔹 Wave Structure: The first wave of this move was a leading diagonal, followed by a pullback. Now, we are likely in Wave 3, which could extend further before a corrective phase begins.
🔹 Retracement Zones: After Wave 3 completes, we expect a corrective structure (Wave 4), which typically retraces between 38.2% and 50% of Wave 3 before Wave 5 resumes.
🔹 Trading Strategy: The most favorable entry zone would be during Wave 5 of A (or 1), ideally in lower timeframes such as H1, H4, or even M15. Before entering a trade, we need to confirm a three-wave corrective structure—whether it forms a sideways correction or a complex zigzag.
📌 Critical Levels to Watch:
A break into Wave 1 territory could invalidate the impulse structure and shift the outlook.
If the corrective phase is shallow, a deeper drop may still be on the table.
🚀 Patience is key! Once the correction completes, the next move could offer a strong trading opportunity.
#NASDAQ100 #ElliottWave #StockMarket #TradingSetup #BearishImpulse
💬 What’s your take? Are we heading lower, or will the market surprise us?

Nasdaq 100 Drops More Than 4.0% Amid Market UncertaintyThe Nasdaq 100 index has already accumulated a loss of over 4.0% during today’s session and has declined more than 12% since its peak on February 18. The strong bearish movement remains intact as the market anticipates that the new 25% tariffs imposed on countries like Mexico and Canada could begin affecting production costs for U.S. companies. In the long run, this may lead to a low-return environment that could be unfavorable for the index.
Additionally, companies such as Amazon, Nvidia, and Microsoft have seen declines between 3% and 5% in recent sessions, reinforcing the bearish pressure on the Nasdaq due to their heavy weighting within the index.
Momentum Accelerates
With the strong downward bias currently present in the chart, selling pressure has been able to break through the support level at 19,700 points. However, the rapid price acceleration is beginning to have a significant impact, which could lead to short-term bullish corrections.
Oversold Indicators
Bollinger Bands: The bearish momentum has broken below the lower Bollinger Band, which could indicate a high acceleration in recent price movements.
RSI (Relative Strength Index): The RSI line continues to decline below the oversold level of 30, suggesting an imbalance between buying and selling forces.
MACD (Moving Average Convergence Divergence): The MACD histogram has dropped to levels not seen since July 2024, indicating a persistent downward acceleration without giving buyers an opportunity to regain control.
The alignment of these indicators suggests a significant acceleration of the bearish trend, which may lead to a standardization of bullish corrections in the short term.
Key Levels:
18,800 points – Near-Term Support: This level corresponds to lows not seen since September 2024. Persistent trading below this level could further accelerate the strong downward bias currently present in the chart.
19,700 points – New Resistance Zone: This level aligns with the lower Bollinger Band, which may serve as the area where potential bullish corrections could take place in the short term.
20,500 points – Distant Resistance: A neutral zone that has been tested by price movements in recent months. A sustained rally back to this level could challenge the current bearish sentiment prevailing in the market.
By Julian Pineda, CFA – Market Analyst

QQQ ShortBroke the weekly parallel channel with a bearish divergence in the weekly chart, confirming the down momentum. Could see a potential 380 ish range.

NASDAQ Futures Fall Following S&P's Worst Week Since SeptemberUS stock futures fell solidly Monday as investors and traders took the weekend to process the February jobs report and prepared for a busy week of economic data, headlined by a report on inflation amid concerns over its resurgence under President Trump's unpredictable trade policy.
Dow Jones Industrial Average futures (YM=F) fell 1%, while futures attached to the benchmark S&P 500 (ES=F) also dropped 1% after the index posted its worst week since September. Futures tied to the Nasdaq (NQ=F) also slipped around 1.79%.
All three major indexes looked set to build on losses of more than 2% last week.
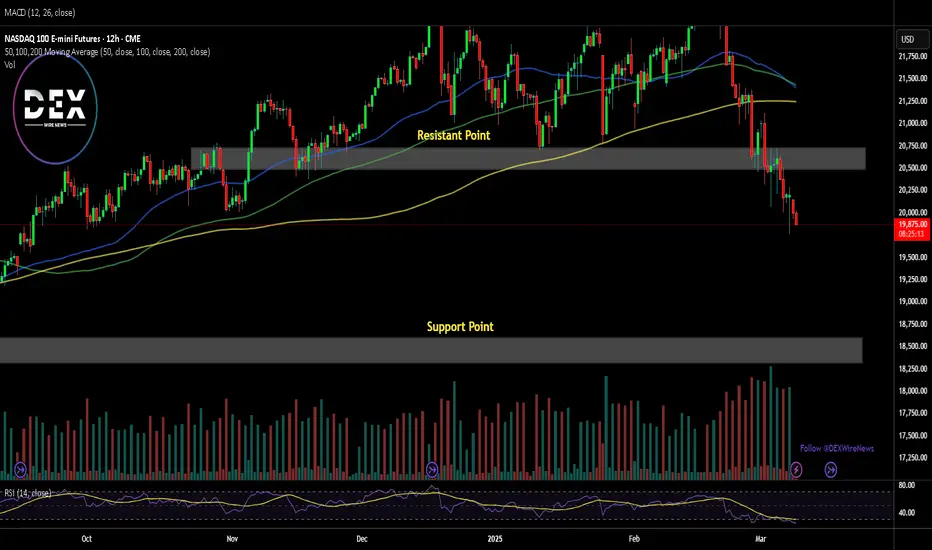
For the Nasdaq Composite, the resistance point has been faded with selling pressure increasing, the 18,500 point could serve as support point for Nasdaq price index. However, should a trend reversal occur, the break above the resistant pivot may catalyse a bullish spree as industries, investors and traders are dissecting President Trump's trade policy.
Weekly and Monday analysis for Nasdaq, Oil, and GoldNasdaq
The Nasdaq closed higher, forming a long lower wick as it rebounded. On continuous futures, the index bounced off the 60-week MA, while the daily chart shows a recovery after briefly dropping below the 240-day MA. Looking at the weekly chart, two weeks ago, a large bearish candle decisively broke below a key range, and last week, the Nasdaq failed to break above the 3-week MA, leading to further downside. This week, however, a rebound toward the 5-week MA near 21,050 remains possible.
On the daily chart, the Nasdaq successfully found support near 19,800, forming a potential range-bound structure. Although a technical target exists at the 60-day MA near 21,500, the downtrend remains strong, meaning that a full recovery may take time. Instead of an immediate rally, the Nasdaq may consolidate around the 240-day MA, making a range-trading strategy more effective.
On the 240-minute chart, the Nasdaq formed a bullish divergence, triggered a golden cross, and started to rebound. As long as price continues to base at the lows, further buying attempts may emerge, making chasing short positions risky. This week, traders should monitor Wednesday’s CPI report and Thursday’s PPI report, as both could increase market volatility.
Crude Oil
Crude oil closed higher, supported by potential sanctions on Russia. On the weekly chart, oil dropped to the 240-week MA before rebounding, but last week’s bearish close triggered a sell signal. Since this sell signal occurred near the zero line, further downside remains possible, making chasing long positions risky. A key upside level to watch is the 3-week MA at $68, while support is expected around the $66–67 range, where a short-term double-bottom formation could develop.
On the daily chart, if oil continues to rebound, traders should watch for resistance at $68, while stopping out below the $65 previous low remains essential. On the 240-minute chart, the MACD has formed a golden cross, with momentum gradually shifting higher. However, since the gap between the MACD and the zero line remains large, selling pressure could reemerge on rallies. Traders should focus on buying dips at strong support levels while keeping strict stop-loss management in place.
Gold
Gold closed lower, remaining within a range-bound market structure. The Non-Farm Payroll (NFP) report triggered significant volatility, but the daily MACD is now turning downward, increasing the risk of additional selling pressure.
On the weekly chart, gold is forming a long-term consolidation range. If this week’s candle closes lower, the weekly MACD may form a bearish crossover, increasing the likelihood of a negative divergence pattern. This makes chasing long positions riskier.
On the daily chart, despite short-term weakness, the MACD and signal line remain far from the zero line, meaning that intermittent rebound attempts are still possible. For now, the lower Bollinger Band serves as key support, reinforcing a range-bound strategy. On the 240-minute chart, $2,940 has become a strong resistance level, and a sell signal has been triggered. For now, traders should focus on selling into rallies while looking for buying opportunities at lower levels. If gold breaks above $2,940, a third wave of buying momentum could emerge, making it essential to adapt to market conditions dynamically. Gold is also likely to react to Wednesday’s CPI and Thursday’s PPI reports, increasing potential volatility.
U.S. market volatility is rising sharply, as seen in the VIX index, which surged above 22 last week. Using technical tools like VIX analysis, moving averages, and MACD strategies can help improve market navigation. Stay disciplined, manage risk carefully, and have a successful trading week! 🚀
If you like detailed this analysis and today's strategy, please follow me and give it a boost!

Nasdaq 100 drops below 20K after NFP, but could it rebound?The Nasdaq and S&P 500 were testing their weekly lows after what has been a bruising last few session. But with both indices testing their respective key support areas, could we see a recovery from around the current levels, especially in light of a weaker US jobs report?
Keep an eye on the area around 20,000 on the Nasdaq, where the Trump rally commenced back in November. It is a key psychological area for the market. Can we see a bounce, or will the selling continue as we head deeper into the US session?
At the time of writing, the index was below this level, but the session is not over yet. In any case, a confirmed reversal on the lower time frames should be observed by traders looking to potentially buy this dip. For example, if the index recovers to go bac above yesterday's low of 20180, that would be a bullish sign in my view. But right now it is looking quite bleak.
By Fawad Razaqzada, market analyst with FOREX.com

TSLA Weekly Chart Analysis- NFATSLA Weekly Chart Analysis- NFA
-4Hour chart showing Bullish RSI Divergence
- Expecting another bearish day to sweep Sellside ($238)
-Great place to buy longs here
-Weekly iFVG(Green rectangle) can act as support zone
-Also approaching Weekly 200 SMA(Support)

NASDAQ 100 - Is the Downtrend Losing Steam? The market has been in a clear bearish trend, forming a descending channel with lower highs and lower lows. However, we are now witnessing signs of stabilization as price action begins to consolidate at a critical level.
🔍 Key Observations:
- The price has tested resistance twice around 20,800, failing to break higher. This signals strong selling pressure at this level.
- At the same time, the market has established a short-term support around 20,000, holding the price from making new lows.
- The structure suggests a possible double top formation, which could indicate another rejection and continuation of the bearish trend.
Possible Scenarios:
1️⃣ Bullish Breakout: If the price manages to break above resistance, we could see a trend reversal, leading to a potential recovery towards 21,000+.
2️⃣ Bearish Rejection: If resistance holds strong, another drop could follow, with price targeting the previous support zone or even lower lows.
3️⃣ Range Formation: If the market continues to test this zone without clear direction, we might enter a sideways consolidation phase before the next major move.
What do you think? Will NASDAQ break resistance or head lower?
#NASDAQ #Trading #MarketAnalysis #DoubleTop #BearishOrBullish

NETFLIX: First warning of the END of the retracement!
On January 22, Netflix presented results that widely beat market estimates:
--> Sales 10,247 million dollars (+16% YoY) vs. 10,106 million dollars estimated by the consensus and 10,128 million dollars estimated by the company.
--> EBIT 2,243 million dollars (+52%) vs. 2,200 million dollars consensus and 2,190 million dollars estimated by the company.
--> BNA 1,869 million dollars (+99%) vs. 1,830 million dollars consensus and 1,847 million dollars estimated by the company.
--> EPS 4.27 dollars (+102%) vs. 4.18 dollars consensus and 4.23 dollars estimated by the company.
New subscriptions reach +18.9M, +44% YoY, vs. +9.2M expected. As anticipated by the Company, this is the last quarter in which it will publish this data. Total subscriptions exceed 301M (+15.9% YoY).
-----------------------------------------------------------------
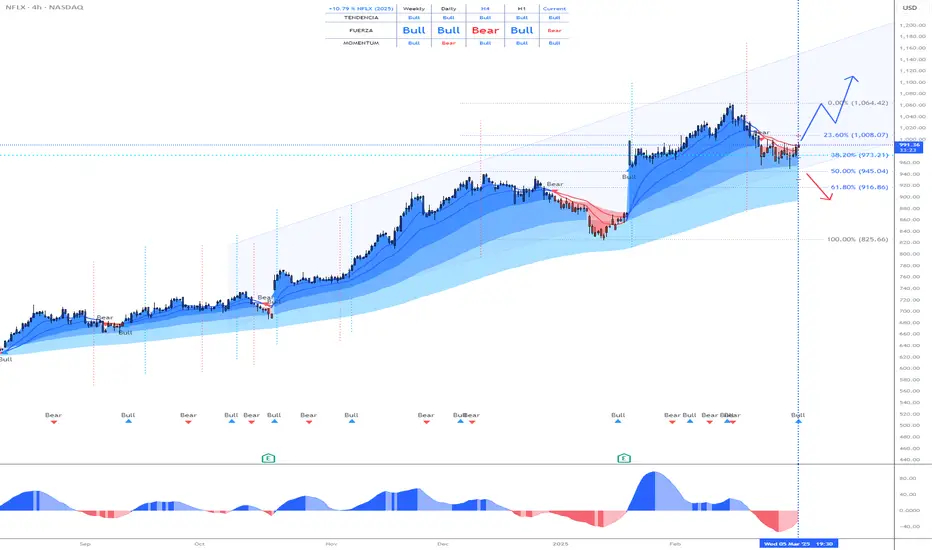
The share price reached its historical maximum on February 18th at 1,064 and has not stopped falling since then, due to the fact that the Nasdaq index began a correction caused mainly by the volatility generated by trade tariffs.
--> What is the technical situation?
The technical aspect is CLEARLY BULLISH and any setback in the price will be a good opportunity to enter the stock.
It has reached a 50% Fibonacci retracement (945), an area that it has respected, and that therefore, can be taken as the LOWER to start a NEW BULLISH IMPULSE.
--> What risks does it have?
Trump's TARIFFS, since they can cause falls in the NASDAQ INDEX that drag down the entire market. But the Nasdaq index is in a VERY PROBABLE LOWER area, so the ENTIRE market could rise strongly in the next few days.
-------------------------------------
Strategy to follow:
ENTRY: We will open 2 long positions if the H4 candle closes above 992
POSITION 1 (TP1): We close the first position in the maximum area (1,061) (+7%)
--> Stop Loss at 940 (-5%).
POSITION 2 (TP2): We open a Trailing Stop type position.
--> Initial dynamic Stop Loss at (-5%) (coinciding with the 940 of position 1).
--> We modify the dynamic Stop Loss to (-1%) when the price reaches TP1 (1,061).
-------------------------------------------
SET UP EXPLANATIONS
*** How do we know which 2 long positions to open? Let's take an example: If we want to invest 2,000 euros in the stock, what we do is divide that amount by 2, and instead of opening 1 position of 2,000, we will open 2 positions of 1,000 each.
*** What is a Trailing Stop? A Trailing Stop allows a trade to continue gaining value when the market price moves in a favorable direction, but automatically closes the trade if the market price suddenly moves in an unfavorable direction by a certain distance. That certain distance is the dynamic Stop Loss.
-->Example: If the dynamic Stop Loss is at -1%, it means that if the price drops by -1%, the position will be closed. If the price rises, the Stop Loss also rises to maintain that -1% in the rises, therefore, the risk is increasingly lower until the position becomes profitable. In this way, very solid and stable price trends can be taken advantage of, maximizing profits.
Actionable Nasdaq insights: 05-Mar-2025Rise and shine, traders! Start your day with actionable Nasdaq insights. Let's grow your skills together, one chart at a time.

Today analysis for Nasdaq, Oil, and GoldNasdaq
The Nasdaq closed lower as market volatility increased due to tariff concerns. Although the index dropped below the 240-day moving average, it formed a lower wick, indicating an attempt to establish a short-term bottom. On continuous futures, the 240-day MA is slightly below 20,000, meaning that the 20,100–20,000 zone is a key support area where a technical rebound is likely following the recent sharp decline. If the market falls into this zone, it could present a swing buying opportunity. Since the daily MACD and signal line are dropping steeply, a sideways consolidation period may be necessary to reduce their angle and separation before further directional movement.
Given that the Nasdaq rebounded strongly after forming a lower wick yesterday, a pullback in pre-market trading could provide a buy-the-dip opportunity. Additionally, potential bullish catalysts include today’s ADP Non-Farm Employment data and Friday’s Non-Farm Payroll report.
On the 240-minute chart, the index is forming a bullish divergence and attempting a golden cross, reinforcing the buy-the-dip strategy at current levels. Therefore, chasing shorts is not advisable, as the Nasdaq has entered a more attractive buying zone. A range-trading approach remains effective, with a preference for buying near support.
Crude Oil
Crude oil closed lower, finding support near previous demand zones. Despite the continued downtrend, the $66–67 range remains a strong support area, making it a potential rebound zone for technical buyers. However, on the daily chart, the MACD and signal line are sloping downward sharply, meaning that selling pressure could intensify further. Long positions should be initiated as close to the lower support zone as possible.
On the 240-minute chart, the MACD has formed another bearish crossover, confirming strong selling momentum. However, when compared to the previous MACD level near $68.50, price has declined further, but the MACD has not dropped as low, suggesting a potential bullish divergence. Since this zone has historically acted as strong support, a buy-the-dip strategy remains preferable, but traders should remain cautious of today’s Crude Oil Inventory report, which could lead to increased volatility.
Gold
Gold closed higher, successfully rebounding from support. Yesterday, gold reached the previously projected target of 2,925, aligning with the 240-day moving average characteristics.
If gold continues higher, the 2,940 level will act as resistance, as this is a previous supply zone on the daily chart. Therefore, further upside should be monitored carefully before making new decisions. Since the daily MACD and signal line remain widely separated, this is not an ideal condition for chasing long positions. Even if gold extends its rally, a pullback is likely, making buying dips a safer approach.
On the 240-minute chart, the MACD formed a golden cross, leading to a sharp rally. As expected, price reached the 60-day MA following the 240-day MA bounce. However, while the MACD has moved above zero, the signal line is still below zero, meaning that another corrective phase could occur before further upside. Additionally, there is a possibility that gold could revisit the 2,850 support zone to form a double-bottom structure, making buying dips a better strategy than chasing breakouts. Overall, a range-trading strategy—buying low and selling high—remains effective, and today’s ADP Non-Farm Employment data could introduce market volatility.
As market conditions shift, risk management remains crucial. Stay disciplined, adapt to volatility, and trade with confidence. Wishing you a successful trading day! 🚀
If you like my analysis, please follow me and give it a boost!
For additional strategies for today, check out my profile. Thank you!
Nasdaq100 - Where could we go?NASDAQ:QQQ
If we lose this Bullish Channel then here are the levels...
Level 1: $445-$450
Level 2: $385-$400
Not financial advice

POSITION REVERSED ON NASDAQWe reversed our position after that we got an IFVG to target the DLQ we have at 19785.48.

BUY NASDAQI'm sharing with you our trade this morning on NASDAQ which is based on the FVG after the LQ grab, to target the BUYSIDE LIQUIDITY.
Follow for more!

Today analysis for Nasdaq, Oil, and GoldNasdaq
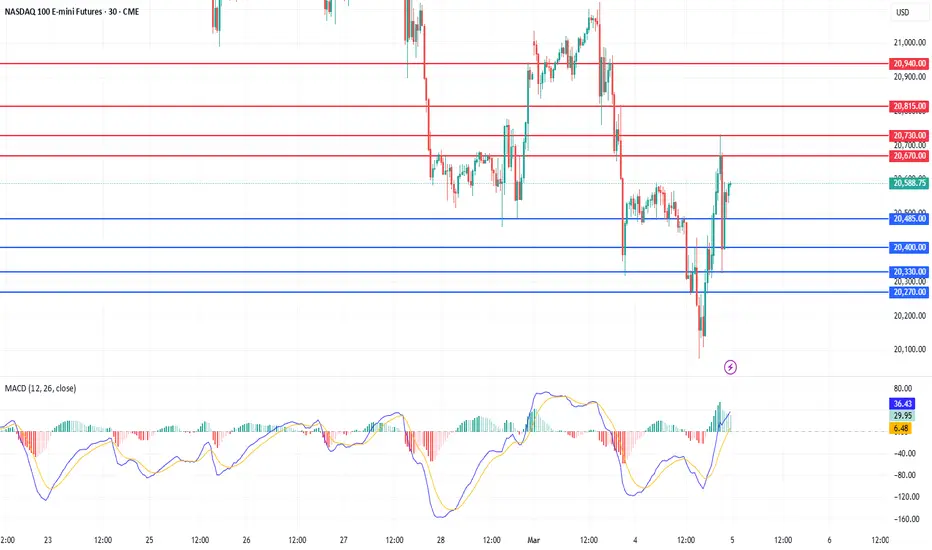
The Nasdaq closed sharply lower, rejecting resistance at the lower boundary of its previous range and dropping to the 240-day moving average. Testing the 240-day MA was an expected technical move, and after facing resistance at the 120-day MA, the index retested the 20,300–20,500 zone. This price action has formed the head of a head-and-shoulders pattern, making it crucial to watch for potential rebound attempts. However, since both the MACD and signal line have moved below the zero line, the market remains in a confirmed downtrend, making selling into rallies the preferred strategy.
As mentioned previously, if the Nasdaq finds support near the 240-day MA, a technical rebound toward the 60-day MA remains possible, as per moving average behavior. On the 240-minute chart, the index is holding support between 20,300–20,500 and still maintaining a golden cross. If the MACD avoids a bearish crossover with the signal line, the likelihood of a rebound increases, making buying near support a reasonable approach. However, the previous range low near 21,000–21,100 will likely act as strong resistance, making selling into rallies favorable. While no major economic reports are scheduled today, market volatility could increase due to comments from President Trump, so traders should maintain strict risk management.
Crude Oil
Crude oil closed lower following news that OPEC+ plans to increase production. On the daily chart, both the MACD and signal line are sloping downward, confirming a gradual downtrend. However, the $66–67 zone remains a strong support level, while the $70.50 level is the key resistance to watch. For now, trading within the range is the most effective strategy. If oil fails to stage a recovery this week, the weekly chart could confirm a sell signal, reinforcing further downside risk.
On the 240-minute chart, the MACD has formed another bearish crossover, suggesting that selling pressure is continuing. Instead of chasing shorts, traders should wait for a pullback to support near $66–67 and consider buying on dips. Given that market flows remain mixed, oil is likely to trade sideways, making range-bound trading the most effective approach for now.
Gold
Gold closed higher, finding support near previous highs. On the daily chart, the index rebounded to the 5-day moving average, and since both the MACD and signal line remain above zero, buying pressure remains intact. However, given the wide gap between the MACD and the signal line, even if gold continues higher, it may face another pullback, making chasing long positions risky. On the weekly chart, the bullish trend remains intact, but since gold is now approaching the 5-week moving average, breaking above resistance may take time.
On the 240-minute chart, a strong rebound emerged from the previous resistance zone, which aligns with the 240-day MA. The MACD has also formed a golden cross, meaning that if the uptrend continues, price targets could extend toward the 60-period MA on the 240-minute chart, potentially reaching the 2,925 area. However, since this initial move is a single-bottom formation, the market could attempt to form a double-bottom before continuing higher, making buying at lower levels more favorable. Gold could also enter a consolidation phase ahead of Friday’s Non-Farm Payroll (NFP) report, so traders should anticipate range-bound price action.
Risk management remains key, and I sincerely hope that March brings strong trading opportunities for all of you. Wishing you a successful trading day!
If you like my analysis, please follow me and give it a boost!
For additional strategies for today, check out my profile. Thank you!
