Palantir (PLTR) Bulls Preparing for Takeoff — Setup Explained💎 PALANTIR TECHNOLOGIES INC. (PLTR) — Swing Trade Profit Playbook 💎
Exchange: NASDAQ
Style: Swing Trade | Thief Layering Strategy | Bullish Pullback Setup
🧭 PLAN
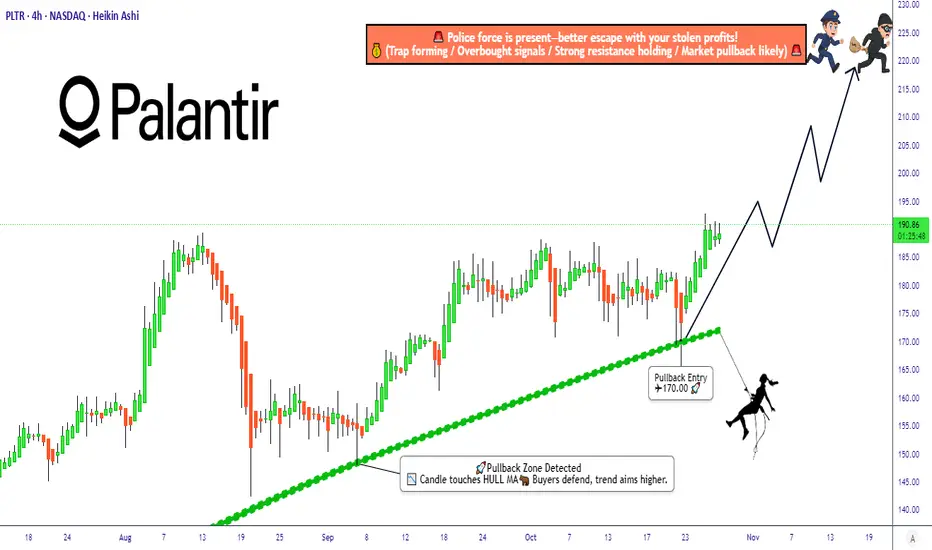
We’re plotting a bullish pullback setup confirmed by the Hull Moving Average and a Heikin Ashi reversal doji — signaling that buyers are regaining strength and getting ready to dominate again. 💪📊
This setup thrives when the crowd is sleeping — that’s when the thief plans the perfect entry on discount zones! 🕶️💸
🎯 ENTRY STRATEGY — “THIEF LAYERING SYSTEM”
Instead of chasing green candles, this strategy stacks multiple buy limit layers to build position quietly and efficiently. Each layer grabs value from dip zones — just like a thief collecting gold coins on the way down! 🏴☠️💰
Layered Entry Plan:
🔹 1st Layer: $175 — early scout entry, feel the market reaction.
🔹 2nd Layer: $180 — main position loading zone near Hull MA support.
🔹 3rd Layer: $185 — continuation confirmation layer if trend holds.
🔹 4th Layer: $190 — momentum add-on for breakout confirmation.
👉 You can add more layers if volatility gives deeper discounts. Adjust according to your risk profile — precision is key, greed is optional! 🎯
🛑 STOP LOSS
This is the Thief SL at $165 — clean, disciplined, and below the recent structural support.
⚠️ Note to all Thief OG’s: This isn’t a fixed stop for everyone. Manage your own risk — move smart, stay stealthy. Every thief has their own escape route! 🏃♂️💨
💰 TARGET / TAKE PROFIT
Our main target is $220, where the “police force” (strong resistance) is waiting to trap late buyers. That’s our signal to escape with profits while the market gets noisy. 🚨💵
⚠️ Note: Don’t copy-paste my TP — adjust it based on your risk-reward ratio. The thief gets in, takes the bag, and disappears like smoke! 😎💨
🌐 CORRELATIONS & RELATED PAIRS TO WATCH
While executing this PLTR play, keep an eye on related movers:
💡 NYSE:AI (C3.ai): another AI data stock — often mirrors PLTR’s momentum.
⚙️ NASDAQ:NVDA (NVIDIA): strong leader in AI space; when NVDA rallies, PLTR usually follows.
📊 NASDAQ:QQQ (NASDAQ ETF): overall tech sentiment indicator — if QQQ pulls back, expect PLTR sympathy moves.
🧠 NASDAQ:META , NASDAQ:GOOG : big-data and AI-driven plays that set tone for broader sector trends.
Key Insight: When NASDAQ:QQQ or NASDAQ:NVDA show continuation strength, PLTR tends to respond aggressively due to its higher volatility factor. A synchronized move could amplify this setup’s reward potential! 💥📈
⚙️ MARKET CONTEXT
Palantir continues to benefit from the AI and defense analytics boom, showing stronger fundamentals and recurring government contracts. The chart recently cooled off, forming a healthy reaccumulation base, ideal for swing traders planning layered re-entries before the next push to $220+. ⚔️📊
🕶️ DISCLAIMER (READ BEFORE HEISTING)
This is a Thief-Style Trading Strategy — meant for fun and education.
Trade smart, manage your capital, and always protect your loot! 🧠💼
✨ “If you find value in my analysis, a 👍 and 🚀 boost is much appreciated — it helps me share more setups with the community!”
#PLTR #Palantir #SwingTrade #ThiefStrategy #StockMarket #AI #BullishSetup #TechnicalAnalysis #HullMA #HeikinAshi #RiskManagement #NASDAQ #ProfitPlaybook
Nasdaq100
iShares Semiconductor ETF Eyes Bullish Continuation🚀 SOXX Breakout Play — Swing/Day Trade Setup 🎯
Asset: SOXX – iShares Semiconductor ETF
Playbook Type: Fund ETF Market Profit Playbook
Plan: 🔥 Bullish Plan (Swing/Day Trade Setup)
⚡️ Entry Plan
Looking for long entries after a confirmed breakout above $292.50.
Once this resistance gives way, momentum traders may pile in — that’s where our profit zone starts heating up! ⚙️
🛡️ Stop-Loss (Risk Control)
Stop Loss: $277.50 — a.k.a. The Thief SL.
Dear Ladies & Gentlemen (Thief OG’s) 👑 — I’m not recommending you to use only my SL. It’s your call, your risk, your money. Manage like a boss. 💼
💰 Profit Target
Target: $308.00 — this level sits near a strong resistance zone where the market might turn overbought or trap late buyers.
Be smart. Escape with profits before the herd does. 😎
Again, Thief OG’s — my TP is just my view. You decide when to take your money and run. 💸
🔗 Correlated Assets to Watch
Keep your eyes on these key players — they often front-run SOXX moves or confirm direction:
SMH (VanEck Semiconductor ETF) → Often mirrors SOXX behavior.
NASDAQ:SOX (Philadelphia Semiconductor Index) → Sector index — leads ETF flow.
NVDA / AMD / TSM → Chip giants that heavily influence ETF weight.
QQQ → Tech sentiment gauge; if NASDAQ rallies, SOXX gets wings.
💡 Tip: When NVDA and SMH break resistance together, SOXX rarely stays quiet — momentum usually follows fast.
⚠️ Key Watchpoints
Always confirm breakout volume before entry.
Keep an eye on macro headlines — rate decisions, chip demand, or supply chain data can shift the tone fast.
Protect profits once RSI hits overheated zones near the upper channel.
🧠 Thief Trader Mindset
This setup isn’t about guessing — it’s about waiting for confirmation, reacting fast, and locking profits like a pro thief in daylight. 🕶️
✨ “If you find value in my analysis, a 👍 and 🚀 boost is much appreciated — it helps me share more setups with the community!”
Disclaimer: This is a thief-style trading strategy just for fun. Always trade responsibly and at your own risk.
#SOXX #Semiconductors #ETF #BreakoutTrade #SwingTrade #DayTrade #TechSector #TradingView #TradeIdea #ThiefTrader #RiskManagement #MarketPlaybook

QUBT — Bullish Wave Formation or Another Trap Zone Ahead?🔬 QUBT – Quantum Computing Inc.
💸 Stock Market Profit Playbook (Swing / Day Trade)
🎯 Setup Overview
We’re looking at QUBT — the Quantum Beast of tech innovation 🧠⚙️.
The setup? A Bullish Breakout + Bullish Pullback combo that’s ready to roll if momentum confirms.
🧭 Trade Plan (Thief-Style Precision ⚔️)
💥 Breakout Entry:
If price breaks the previous neutral zone around $19.00, that’s your ignition switch 🔓 — buy above that zone once confirmation candle closes strong.
♻️ Pullback Entry:
Wait for the price to revisit the Triangular Moving Average (TMA) region near $13.00. If bulls defend that zone — that’s your wave start! 🏄♂️ Ride the bullish momentum from there.
💰 Thief Strategy (Layered Entry):
We thieves don’t chase — we layer. Place multiple buy limits like a pro sniper 🎯
First Layer ➤ $35.00
Second Layer ➤ $36.00
Third Layer ➤ $37.00
(You can extend your limit layers higher or lower based on your risk appetite and strategy.)
🛑 Stop Loss (SL):
This is my “Thief SL” @ $34.00 🧨 — but dear Ladies & Gentlemen (Thief OGs), this is not financial advice. Set your own SL based on your plan & comfort zone. Protect your pockets first, profits later! 💼
🎯 Take Profit (TP) / Target:
The Police Barricade awaits around $44.00 🚓 — strong resistance, overbought signals, and possible trap zone there!
So, our main escape point is $43.00, where smart thieves bag profits and disappear like smoke 💨💵
Note: Dear Thief OGs — I’m not recommending only my TP. Make your own move when you’re in profit.
🧩 Related Pairs / Market Correlation (For Cross-Eye Analysis 👀)
Keep these tickers in your radar when QUBT starts heating up 🔥:
NASDAQ:AMD → Tracks semiconductor + tech demand. If AMD rips, quantum stocks often follow the vibe! ⚙️
NASDAQ:NVDA → The AI overlord 👑 — any surge here can reflect positive sector sentiment toward compute innovation (including quantum).
CBOE:ARKQ → ARK’s innovation ETF 🚀 — often holds early-stage quantum exposure; its movement shows if deep-tech is gaining capital inflow.
NASDAQ:SOXX → The semiconductor index ETF. When it rallies, it confirms broad tech strength 🌐
When these tickers move in sync → that’s your quantum confirmation ripple 🌊
⚙️ How To Use This Setup (The Thief Way 🕶️)
Layer entries smartly, not emotionally.
🧠 Define SL & TP your way — mine’s just a reference.
💎 Manage exposure — if multiple layers trigger, scale wisely.
📈 Track volume + candle structure near breakout zones.
🕰️ Patience pays — let the setup prove itself.
✨ “If you find value in my analysis, a 👍 and 🚀 boost is much appreciated — it helps me share more setups with the community!”
⚠️ Disclaimer: This is thief-style trading strategy just for fun. Always DYOR (Do Your Own Research) before entering any trade.
#QUBT #QuantumComputing #StockAnalysis #SwingTrade #DayTrade #Breakout #Pullback #TradingStrategy #ThiefStyle #TechStocks #TradeSetup #ProfitPlaybook #StockMarket

Reversal From ATH, Momentum Turns Cautious Reversal From ATH, Momentum Turns Cautious
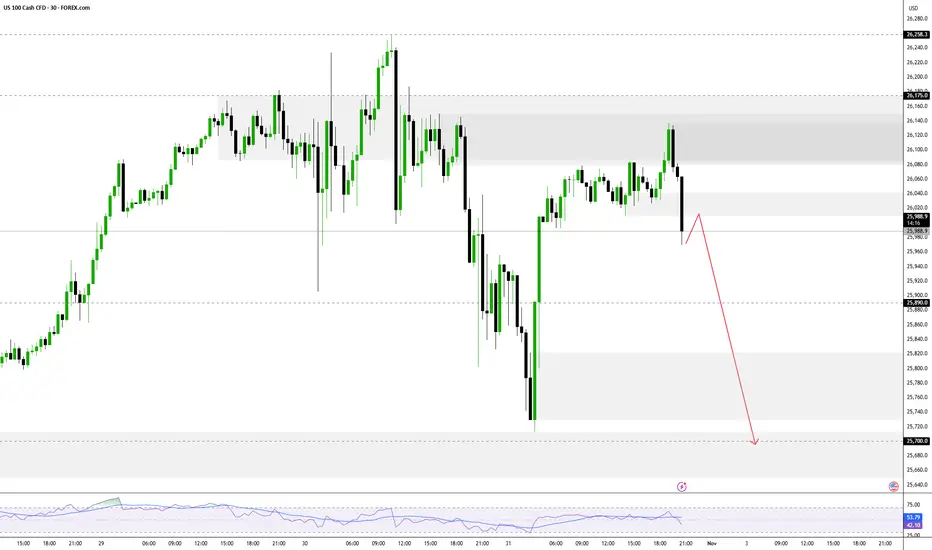
The NASDAQ reversed from its all-time high and remains below 26,175, signaling short-term bearish momentum.
➡️ Below 26,175: Bearish bias toward 25,890 → 25,700 → 25,340.
➡️ Above 26,245: Bullish continuation toward 26,500 → 26,850.
Pivot POINT: 26,175
Support: 25,890 · 25,700 · 25,340
Resistance: 26,500 · 26,850 · 27,000
USNAS100 remains bearish while below 26,175, but a 1H close above 26,245 would confirm a bullish breakout toward higher targets.
LLY Market Blueprint – From Pullback Base to Profit Zone🎯 LLY Stock Market Heist Plan 🏦💰 | Swing Trade Setup
📊 Asset Overview
Eli Lilly and Company (LLY) - NYSE
Pharmaceutical Giant | Market Cap Leader
🔍 The Setup: What We're Seeing
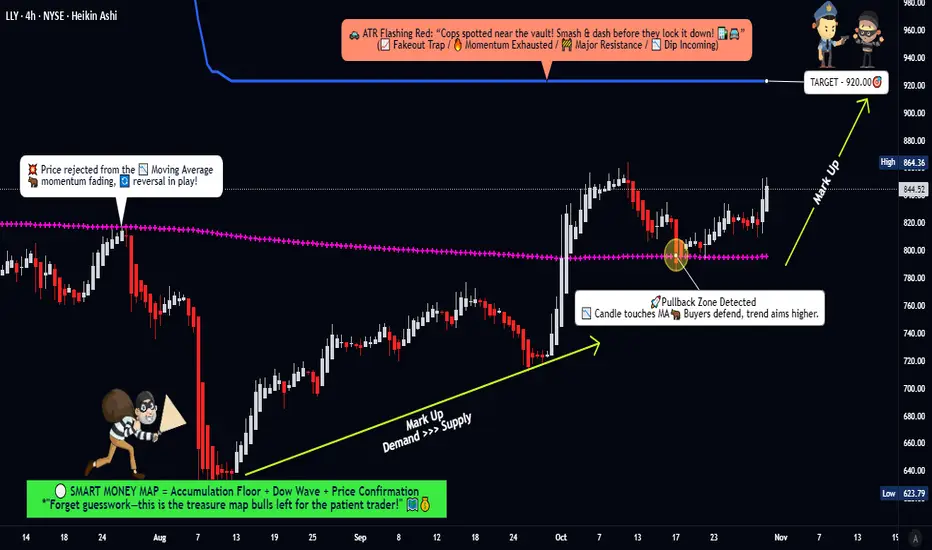
The chart is screaming opportunity! 🚨 LLY is showing classic bullish pullback behavior with strong accumulation zone activity. We've got:
✅ Accumulation Zone Pressure - Big money is quietly loading up
✅ Weighted Moving Average Breakout & Retest - Technical confirmation ✓
✅ Bullish Momentum Building - The spring is coiling for the next leg up
🎯 The Thief's Game Plan
Entry Strategy: The Layered Approach 🪜
You've got two options here, fellow thieves:
Option 1: Simple Entry
→ Any current price level works if you're confident in the setup
Option 2: The Thief's Layered Entry 🧠
This is where we get tactical. Use multiple limit orders to ladder into the position:
Layer 1: $780
Layer 2: $800
Layer 3: $820
Layer 4: $840
You can add more layers based on your capital and risk tolerance. This approach averages your entry and reduces timing risk.
🛑 Risk Management: The Escape Hatch
Stop Loss: $760
⚠️ Important Note: This is MY stop loss level based on my risk tolerance and analysis. You are the captain of your own ship! Set your SL based on YOUR risk appetite. Make money, take money - but do it at your own risk. 🎲
💰 Target: The Vault 🏦
Take Profit: $920
Here's the situation: The ATR line is sitting at $920 acting like a police barricade 🚔. This is a strong resistance zone where:
Overbought conditions likely
Potential trap zone for late entries
Natural profit-taking area
🎯 My Advice: When you reach the vault, grab the cash and RUN! Don't get greedy.
⚠️ Another Important Note: This is MY target. You make your own rules. Scale out, hold longer, take profits earlier - whatever fits YOUR trading plan. This is your heist, not mine! 💼
📈 Related Pairs to Watch
Keep these on your radar for correlation and broader market context:
Healthcare/Pharma Sector:
NYSE:JNJ (Johnson & Johnson) - Healthcare bellwether, moves often correlate
NYSE:UNH (UnitedHealth Group) - Health sector leader, shows sector strength
NYSE:PFE (Pfizer) - Direct pharma competitor, industry sentiment gauge
NYSE:ABBV (AbbVie) - Biopharmaceutical peer, similar market dynamics
Market Context:
AMEX:SPY (S&P 500 ETF) - Overall market direction matters
AMEX:XLV (Health Care Select Sector SPDR) - Sector health indicator
Key Correlation Points:
LLY often leads pharma sector during strong diabetes/obesity drug cycles
Watch NYSE:JNJ for defensive rotation signals
AMEX:SPY correlation increases during risk-on markets
AMEX:XLV breakouts often precede individual pharma stock runs
🎭 The Thief's Philosophy
This setup combines patience (layered entries), discipline (clear stop loss), and calculated risk-taking (defined target). We're not gambling - we're executing a well-planned heist with multiple contingencies.
The market is the vault. The chart is the blueprint. Your risk management is your getaway car. 🚗💨
Remember: The best thieves know when to strike AND when to walk away. Don't fall in love with a position. Take your profits and live to steal another day! 😎
✨ If you find value in my analysis, a 👍 and 🚀 boost is much appreciated — it helps me share more setups with the community!
#LLY #EliLilly #SwingTrading #StockMarket #TechnicalAnalysis #NYSE #PharmaStocks #BullishSetup #TradingStrategy #ThiefStyle #LayeredEntry #RiskManagement #PriceAction #MovingAverage #AccumulationZone #HealthcareStocks #TradingIdeas #StockTrading #ChartAnalysis #MarketHeist
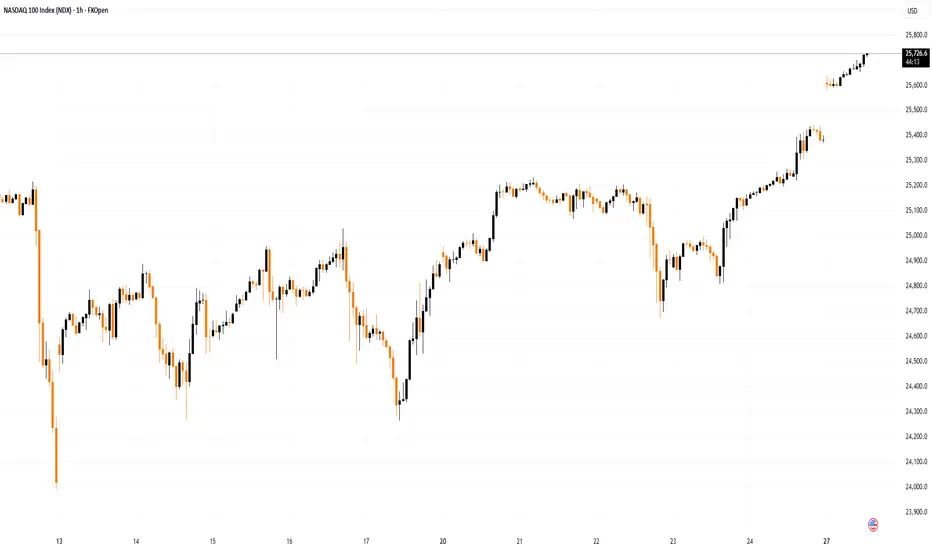
News Whirlwind Propels Nasdaq 100 to a Fresh All-Time HighNews Whirlwind Propels Nasdaq 100 to a Fresh All-Time High
According to the chart, the Nasdaq 100 index has climbed above the 26,260 mark for the first time in history. Market sentiment is being driven by an extraordinary combination of powerful news factors:
→ Meeting between US President Donald Trump and China’s leader Xi Jinping in Busan, South Korea. The talks lasted around one hour and forty minutes. Xi emphasised the importance of “steering the giant ship” of bilateral relations, while Trump described the meeting as “tremendous” and “fantastic”. However, few concrete details about a potential trade deal were revealed.
→ Federal Reserve rate cut. As expected, the Fed cut interest rates by 0.25% yesterday. Jerome Powell struck a cautious tone, using the metaphor of “driving through fog” to describe the lack of key inflation and labour market data due to the government shutdown. He also highlighted divisions within the committee, suggesting that another rate cut – possibly in December – remains uncertain.
→ Tech giant earnings reports. After the US stock market closed yesterday, Microsoft (MSFT), Alphabet (GOOGL), and Meta Platforms (META) released their quarterly results. A key theme across all three was massive capital expenditure on artificial intelligence. Investors are now questioning whether these heavy investments are beginning to pay off.
Technical analysis of the Nasdaq 100 chart
At the start of the week, when analysing the hourly chart of the Nasdaq 100, we:
→ used the outlines of the 10 October sell-off to construct an upward channel (shown in blue);
→ drew a steeper trajectory using three orange trendlines;
→ suggested that the price target was the upper boundary of the blue channel.
That target has now been reached, and the upper boundary is showing signs of resistance — evidenced by the price slipping below the middle orange line and now being supported by the lower one.
Given the emerging RSI divergence, it is reasonable to assume that the upward momentum (+6% since the start of the month) may begin to slow. Note the recent bearish candlestick (marked by an arrow), notable for its strong move. Profit-taking could soon occur, with bears potentially attempting to push the Nasdaq 100 back down towards the median of the blue channel.
This article represents the opinion of the Companies operating under the FXOpen brand only. It is not to be construed as an offer, solicitation, or recommendation with respect to products and services provided by the Companies operating under the FXOpen brand, nor is it to be considered financial advice.

Nasdaq Computer sector & Nasdaq nearing pullback areaNasdaq Computer (IXCO) Is nearing pullback territory (23,717 resistance). IXCO being the largest sector in Nasdaq (IXIC) means the composite index, now that it's over previous resistance, is also looking for a pullback into support (20,160).
It's possible IXCO will break resistance next year and if that happens whatever gains are made will be lost on an eventual drop back into support.
If you have call options on NVDA or other tech companies closing them when IXCO hits 23,717 is highly advisable. If it hits there around this January it could be 2 years before IXCO resumes the uptrend past 23,717. Calls will likely get destroyed during this time.
Another note is lots of tech IPOs are occurring this year with lofty valuations. When this IXCO pullback comes they are likely to get hit hard. It's a great opportunity to short or wait to buy up the ones you like when the pullback is over.
As always good luck and try your best to avoid getting into new tech related trades as this year ends. It's going to be a great idea to have cash ready next year.

OPEN: Time to Accumulate? Layer Entry Method Explained🎯 OPEN: The Heist is ON! 🏠💰 Strategic Swing Trade Setup
📊 Asset Overview
Ticker: OPEN (Opendoor Technologies Inc.)
Exchange: NASDAQ
Trade Type: Swing Trade
Bias: 🐂 BULLISH
🎭 The Master Plan: "Operation Real Estate Robbery"
Listen up, fellow wealth redistributors! 👋 Opendoor's chart is screaming opportunity louder than a house alarm at 3 AM. We're setting up a classic layered accumulation strategy (aka "The Thief's Multi-Pocket Approach") to maximize our position while managing risk like professionals.
🚪 Entry Strategy: The Layered Infiltration Method
Primary Approach: Multiple Limit Orders (Ladder Strategy)
Instead of going all-in at one price (rookie move 😅), we're spreading our capital across strategic levels:
Recommended Entry Layers:
🎯 Layer 1: $6.50
🎯 Layer 2: $7.00
🎯 Layer 3: $7.50
🎯 Layer 4: $8.00
Flexibility Note: You can adjust the number of layers and position sizing based on your capital and risk appetite. Some traders prefer tighter layers ($0.25 increments), others go wider. Make it yours! 💪
Alternative: If you prefer simplicity, current market price entry works too, but layering gives you better average cost basis on dips.
🛡️ Risk Management: The Escape Hatch
Stop Loss: $6.00
⚠️ Important Disclaimer: This SL level is based on technical structure, but YOU are the captain of your own ship. Adjust based on:
Your risk tolerance
Account size
Market volatility
Personal trading rules
Risk Management Tip: Never risk more than 1-2% of your total capital on a single trade. Set your position size accordingly!
🎯 Target: The Grand Exit
Primary Target: $10.00
At this level, we're expecting:
🚨 Strong resistance zone
📈 Potential overbought conditions
Possible bull trap area
💰 Excellent risk-reward ratio
Scaling Out Strategy (Advanced Move):
Consider taking 30-50% profits at $9.00-$9.50
Trail stop-loss on remaining position
Lock in gains progressively
Remember: Nobody went broke taking profits! 💵 If the market gives you money, take it. Don't get greedy waiting for the "perfect" exit.
🔗 Related Assets to Watch
Keep these correlated symbols on your radar for confluence:
📍 $Z (Zillow Group) - Direct competitor in real estate tech, strong correlation with OPEN's price action
📍 BLACKBULL:RDFN (Redfin Corporation) - Another proptech player, moves in sympathy with sector sentiment
📍 NASDAQ:EXPI (eXp World Holdings) - Real estate brokerage, broader sector health indicator
📍 AMEX:IYR (iShares U.S. Real Estate ETF) - Overall real estate sector strength/weakness gauge
📍 AMEX:XHB (SPDR S&P Homebuilders ETF) - Housing market sentiment indicator
Correlation Logic: When real estate tech and housing sectors show strength, OPEN typically benefits. Conversely, sector weakness can drag OPEN down regardless of individual fundamentals. Watch for divergences—they often signal important reversals! 🔄
📈 Technical Synopsis
This setup combines:
✅ Strategic layered entries for optimal positioning
✅ Defined risk with clear stop-loss
✅ Realistic profit target with strong R:R ratio
✅ Sector correlation awareness
✅ Flexible execution for different trading styles
The swing trade timeframe gives this setup room to breathe and develop, perfect for traders who don't want to be glued to charts all day! ⏰
⚡ The Bottom Line
This isn't financial advice—it's a strategic roadmap presented with personality! The "thief style" approach is all about:
🎯 Strategic positioning
🛡️ Risk management
💰 Profit-taking discipline
😎 Having fun while trading
Trade smart. Trade safe. Trade YOUR plan.
✨ If you find value in my analysis, a 👍 and 🚀 boost is much appreciated — it helps me share more setups with the community!
#OPEN #OpendoorTechnologies #SwingTrade #NASDAQ #StockMarket #TechnicalAnalysis #TradingStrategy #RealEstateTech #PropTech #BullishSetup #LayeredEntry #RiskManagement #TradingView #StockTrading #MarketAnalysis #TradingIdeas #SwingTrading #DayTrading

NasdaqHello traders! Last Friday, we had a major selloff in the 25,000 region, which quickly sent the Nasdaq crashing by more than 4% in just a few hours. In technical analysis, 24,000 is a price that has been broken previously and is now being tested as weekly support. If we expand this movement, we project a target price of 26,000, continuing the upward movement. The technology sector remains promising with advances in artificial intelligence, and we have no news of a Federal Reserve interest rate hike. Happy trading!

Breaking: TEN Holdings, Inc. (NASDAQ:XHLD) Spike Over 100% TodayThe price of TEN Holdings, Inc. (NASDAQ NASDAQ:XHLD ) broke out of a falling wedge spiking over 100% today during Tuesday early market session.
With buying momentum increasing as seen by the RSI at 88, NASDAQ:XHLD might reclaim the $2 resistance in the short to long term.
In another news, TEN Holdings, Inc. (NASDAQ NASDAQ:XHLD ) recently announces a strategic agreement with V-Cube, Inc., its controlling stockholder and a leader in the global virtual events industry in Japan and Singapore.
TEN Holdings and V-Cube are unifying their respective technologies and expertise to deliver advanced communication and event technology tailored for the North American enterprise market, valued at USD 34.39 billion in 2024 (Grand View Research).
About XHLD
TEN Holdings, Inc. provides event planning, production, and broadcasting services in the United States. The company organize virtual, hybrid, and physical events, including conferences, marketing events, product launches, trainings, and investors and shareholder meetings. Its events are enabled by its Xyvid Pro Platform, an internet-based broadcast platform with interactive engagement tools designed to provide web broadcast audiences with a dynamic, interactive, and engaging virtual event experience.

NTSK Netskope: the rocket is on the padNetskope’s shares (ticker NTSK) are trading after a successful IPO, but the chart suggests we’re still in early accumulation phase. The price is hovering in the ~$21-24 zone, and a breakout above near resistance is needed to confirm strength. The first target is $28, with potential extension toward $35–40 if the structure holds. Given IPO volatility, entry requires careful stop-management and confirmation of trend support.
Netskope operates in the rapidly expanding cloud security market (SASE/Zero Trust). With revenue growth exceeding 30% and narrowing losses, the company is well-positioned in the AI-security wave. While the TAM (total addressable market) is large and growth prospects strong, the business still faces profitability and competitive risks.
The rocket may not yet be launched, but the launchpad is set. Stay patient, wait for the “ignition” signal, and let the engine build thrust before liftoff.

RECAP TODAY. USING THE SIGNALS AND TOOLS Fellow traders - followers,
I have some today to recap on the day.
Now I will say this. Today went the way they said it would go UP! All the overnight new, the morning media and the tech headlines all made today a profitable day for the bulls! I will also say this: it is a scary situation, because we have no resistance levels up here, so where does all this up trend movement stop? What do we know or where to put our stop losses?
In building these indicators, I'm learning a few things. I'm learning more about myself and about what to look for exactly. There will be days where I will lose. Just like Friday: -$280! The price action was just not as consistent and friendly like it was today.
Let me break down today:
1. I attached the 5min chart to show you what the " Golden Pocket " of my indicator resembles.
A confirmation of price action and direction.
It reacted perfectly. 10:15am Bear candle - 10:20am Bull Doji inside pocket - 10:30am Engulfing Bull candle with a long signal! You couldn't ask for a better set up to the upside to make your money!
2. The 15min time frame was a little more of a bulky solid read. Bull candles with wicks.
The 10:15am candle carried the long signal with it. The wick within that candle was our 5min candles playing out.
Weather you waited for the 15min plays or you entered in the 5mins. You won.
3. So, with all this, there is another indicator I play. That is my 0dte Context bundle. How this works in our favor is that in this specific situation you want to make sure your trends are moving where they need to go. The EMA, SMA and VWAP lines all had same up direction. The Green EMA/SMA Cloud all indicated up is where it's going.
You have the tools to assist in decisions. If you need more help with reading these indicators. Let me know. I'm always down to help out.
Patient is still key. Confirmations are still key. Remember that when trading. Do not get antsy and enter in trades that are not strong or that will not check all your entry boxes.
Thank you again for the follows and the support. I hope these are helpful.
God Bless,
Trades with B!

COIN | 200 SMA Confluence + Bullish Doji = High-Value Setup🎯 COIN: The 200 MA Heist — Dip Buyers Stacking Bags While Others Panic 💼🔥
📊 Asset Intelligence
Coinbase Global Inc (COIN) — NASDAQ
Strategy Classification: Swing/Day Trade Hybrid
Market Bias: Bullish Pullback Confirmation
Risk Profile: Calculated Aggression
🧠 Technical Thesis — Why This Setup Slaps
Listen up, Thief OG's 👀
COIN just pulled back to the 200 Simple Moving Average and did exactly what professional setups do — it respected support and reversed. We got a textbook Heikin Ashi reversal doji candle forming right at the MA, signaling buyer exhaustion turned into buyer dominance.
Translation for the streets: Big money stepped in. Retail panicked. We capitalize.
📈 What We're Seeing:
200 SMA holding like a vault door 🔐
Heikin Ashi doji = indecision flipped to bullish conviction
Volume profile showing accumulation, not distribution
Buyers got the juice to push this higher
This isn't hopium. This is structure meeting momentum at a critical support zone.
💰 The "Thief Strategy" Entry Playbook
We don't chase. We layer. We scale. We steal profits from emotional traders.
Instead of slapping market buy like a degen, we're using layered limit orders to build our position as price moves in our favor. Think of it like planting money traps on the way down.
🎯 Entry Layers (Limit Orders):
Layer 1: $330 💵
Layer 2: $340 💵
Layer 3: $350 💵
Layer 4: $360 💵
You can add more layers if you're feeling spicy 🌶️. The goal is to dollar-cost average into strength, not weakness. Let the market come to YOU.
Pro Tip: Not all layers need to fill. Sometimes you only catch 2-3. That's fine. Better to miss some entry than to get caught in a fake-out.
🛡️ Risk Management — Protect Ya Neck
Stop Loss: $310 🚨
Real talk, Thief OG's: This is MY stop based on MY risk tolerance. You are NOT me. You don't have my account size, my strategy, or my psychology.
Set your own stop based on:
How much you're willing to lose per trade
Your position size
Your personal pain threshold
If COIN breaks below $310, the thesis is invalidated. The 200 MA failed. Buyers lost control. We exit, regroup, and find the next heist. No ego. No revenge trading. Just discipline.
🎯 Target Acquisition — Where We Take the Bag
Primary Target: $430 💎
⚡⚠️ WARNING: Resistance Fortress Ahead
At $430, we're walking into a battlefield:
Historical resistance = sellers have limit orders stacked
Overbought territory = indicators flashing red
Trap zone activated = late buyers will get liquidated here
What smart money does: Lock profits. Don't marry the trade. Don't get greedy.
Potential scenarios:
🟢 Strong momentum? Trail your stop and let winners run
🟡 Consolidation at $420? Take 50-75% off the table
🔴 Rejection at $430? Exit immediately, don't hope
(Thief OG's — again, this is MY target. You might want to exit at $400 for quick profits. You might want to hold for $450. Your rules. Your capital. Your consequences.)
🔗 Correlated Assets — The Bigger Picture
Don't trade COIN blind. Context is king.
Watch These Tickers:
BITSTAMP:BTCUSD & BITSTAMP:ETHUSD
Correlation: STRONG
COIN is basically a leveraged play on crypto sentiment. Bitcoin pumps = COIN pumps harder. Bitcoin dumps = COIN dumps harder. Always check the crypto market before entering.
⛏️ NASDAQ:MARA & NASDAQ:RIOT
Correlation: HIGH
Fellow crypto-exposed stocks. If they're ripping, COIN usually follows. If they're bleeding, stay cautious.
💳 SET:SQ (Block Inc.)
Correlation: MODERATE
Fintech + crypto exposure. Similar institutional money flows. Good confirmation indicator.
💵 TVC:DXY (US Dollar Index)
Correlation: INVERSE
Strong dollar = crypto weakness = COIN weakness
Weak dollar = crypto strength = COIN strength
Simple math. Don't ignore macro.
🔑 Key Insight: If Bitcoin is fighting resistance at $70K while COIN is trying to break out, one of them is lying. Read the room.
📌 Technical Breakdown — The Charts Don't Lie
✅ 200 SMA Support: Holding firm — institutional support level
✅ Heikin Ashi Reversal: Doji + bullish follow-through = momentum shift confirmed
✅ Volume Analysis: Accumulation on dips, not capitulation
✅ Risk/Reward Ratio: Solid if stops are honored and targets are realistic
⚠️ Resistance at $430: Real, tested, and dangerous — respect it
⚠️ Crypto Market Dependency: If BTC drops 10%, COIN drops 15%. Stay alert.
📢 Thief OG Community Rules
Never risk more than you can afford to lose — period.
Position sizing > entry price — manage your risk first, profits second.
Stick to YOUR plan — my plan is mine. Yours is yours.
Take profits — unrealized gains aren't real until you close the trade.
No FOMO, no revenge trades — discipline beats emotion every time.
✨ If you find value in my analysis, a 👍 and 🚀 boost is much appreciated — it helps me share more setups with the community!
#COIN #Coinbase #SwingTrading #DayTrading #ThiefStrategy #CryptoStocks #TechnicalAnalysis #PullbackSetup #HeikinAshi #200MA #NASDAQ #BullishSetup #LayeredEntry #RiskManagement #SmartMoney #PriceAction #TradingView #StockMarket #SwingTrader

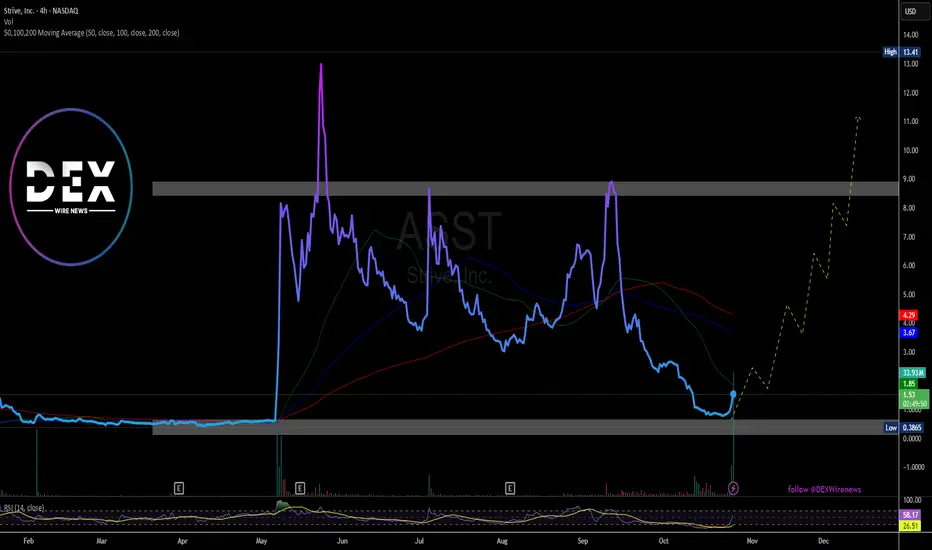
Just In: Strive Asset Management, LLC ($ASST) Spike 40% TodayThe price of Strive Asset Management, LLC (NASDAQ: NASDAQ:ASST ) Spike 40% on Monday's market open bouncing from the $0.38 support point albeit present market conditions the asset is gearing for a move to the $8 resistant point.
With the RSI at 57, NASDAQ:ASST stock seems more than ready to achieve that fit.
The stock is already trading below key moving averages giving it ample time to capitalize on that level.
In recent news, Strive, Inc. (Nasdaq: NASDAQ:ASST ) announced the appointment of Ben Werkman as Chief Investment Officer (“CIO”) reporting to Strive Chairman and Chief Executive Officer (“CEO”) Matt Cole.
Mr. Werkman founded NumerisX, a boutique Bitcoin treasury advisory firm, where he guided corporations in developing and implementing Bitcoin treasury strategies.
About ASST
Strive Asset Management, LLC is a privately owned investment manager. It primarily provides its services to investment companies. The firm is a large advisory firm, an investment adviser to an investment company which provides portfolio management for investment companies
Nasdaq 100 Analysis: Index Reaches an All-Time HighNasdaq 100 Analysis: Index Reaches an All-Time High
As the chart shows, trading in the Nasdaq 100 opened with a bullish gap today, with the price rising above the 25,600 mark for the first time in history.
The upbeat sentiment is being driven by:
→ expectations of a potential interest rate cut, with the Federal Reserve’s decision due on Wednesday;
→ the upcoming meeting between Chinese and U.S. leaders, where the presidents may announce a new trade agreement;
→ anticipation of quarterly earnings reports from major tech firms – Amazon (AMZN), Apple (AAPL), Microsoft (MSFT), Alphabet (GOOGL) and Meta Platforms (META) are all set to release results this week.
Technical Analysis of the Nasdaq 100 Chart
A closer look at the hourly Nasdaq 100 chart, within the context of this month’s volatility, shows a steady recovery from the sharp drop on 10 October – the day President Trump suggested imposing 100% tariffs on Chinese goods.
The contours of that sell-off can now be used to outline an ascending channel, which neatly captures the market’s current price swings. Notably, today the index climbed into the upper half of that channel, overcoming resistance levels at:
→ the channel’s median line;
→ the 25,220 mark.
Since last Thursday’s low, the price has advanced by more than 3.5% – a strong rally – forming a steep upward trajectory (highlighted in orange). In this context:
→ the next potential target lies at the upper boundary of the blue channel, which would mark a new record high near 26,000 for the Nasdaq 100;
→ however, with RSI signalling overbought conditions, a short-term correction towards 25,500 would be a healthy development.
Should this week’s key events deliver the optimism investors are hoping for, the bulls may well succeed in reaching those ambitious targets.
This article represents the opinion of the Companies operating under the FXOpen brand only. It is not to be construed as an offer, solicitation, or recommendation with respect to products and services provided by the Companies operating under the FXOpen brand, nor is it to be considered financial advice.
Nasdaq100 Breakout Map – Bullish Targets Ahead?🕵️♂️ NDX/US100 “NASDAQ100” Market Wealth Strategy Map (Swing/Day Trade) 🚀
📊 Plan: Bullish Bias (Swing/Day Trade)
🎯 Entry Idea (Thief Layering Style):
Using a layering strategy (multiple limit orders). My preferred buy zones are:
🟢 24,300
🟢 24,400
🟢 24,500
🟢 24,600
(Feel free to adjust/add layers based on your own style — flexibility is key.)
🔒 Protective Stop (Thief SL):
❌ Around 24,000 (but note: this is just my map, you can manage risk as per your own plan).
💰 Target Area (Profit Zone):
🚧 25,500 = strong resistance barricade + overbought region + potential bull trap.
✅ My preferred exit: 25,400 (just before the “police barricade” 🚓).
⚠️ Note for Thief OG’s:
I’m not recommending to only follow my SL/TP. This is an educational trade map, not a fixed financial call. Adapt, adjust, and take profits your way.
🔑 Key Catalysts & Correlation Map:
Tech Sector Strength: US100 often mirrors mega-cap tech momentum ( NASDAQ:AAPL , NASDAQ:MSFT , NASDAQ:NVDA ).
Risk-On/Off Mood: Watch TVC:VIX — if fear spikes, layers may fill quicker.
Dollar Impact: TVC:DXY weakness often fuels NASDAQ:NDX upside.
Bond Yields: Higher yields = pressure on tech. Keep TVC:US10Y in your radar.
📌 Other Related Charts to Watch:
SP:SPX / CME_MINI:ES1! → Correlated US equity benchmark.
TVC:DXY → Inverse correlation (watch dollar moves).
TVC:VIX → Volatility indicator for risk sentiment.
BITSTAMP:BTCUSD → Risk sentiment cousin, moves with tech flows sometimes.
✨ “If you find value in my analysis, a 👍 and 🚀 boost is much appreciated — it helps me share more setups with the community!”
⚠️ Disclaimer:
This is a Thief Style Trading Strategy Map — created for fun, educational purposes, and market observation only. Not financial advice. Trade at your own risk, ladies & gentlemen. 🕵️♂️💸
#NASDAQ100 #NDX #US100 #SPX #Stocks #Indices #Trading #SwingTrade #DayTrade #LayeringStrategy #ThiefTrader

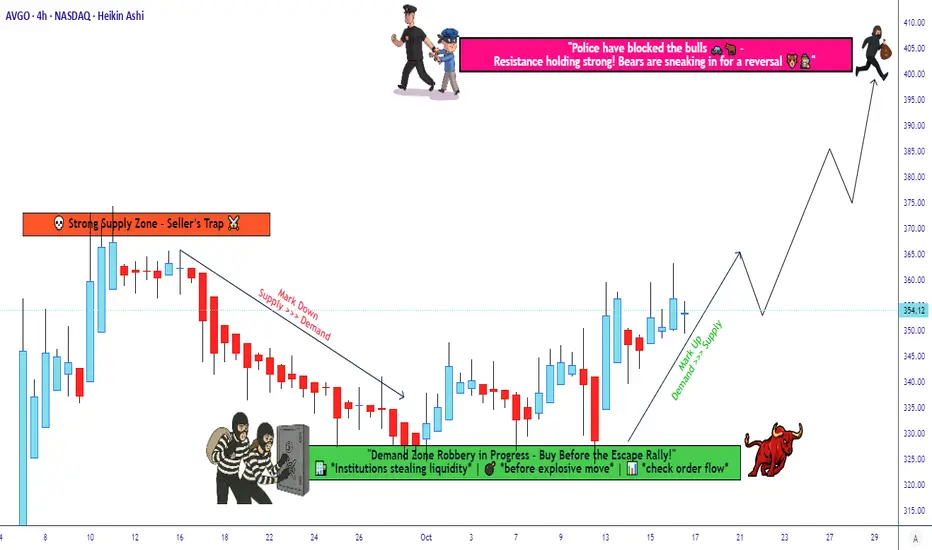
Broadcom Technical Setup - Systematic Entry Approach🎯 AVGO: The Great Heist Setup | Layered Entry Strategy 💰
📊 Asset Overview
Broadcom Inc. (AVGO) - The semiconductor kingpin that's been printing money like a Vegas casino! 🎰
🎭 The Heist Plan: BULLISH Setup
Strategy Style: The "Thief Method" - Layered Limit Orders (Ocean's Eleven style but legal! 😎)
🚪 ENTRY ZONE: The Multi-Layer Approach
This ain't your grandma's single entry point! We're going full stealth mode with multiple limit buy orders spread across the zone like a well-planned heist:
Suggested Entry Layers:
💵 Layer 1: $330
💵 Layer 2: $340
💵 Layer 3: $345
💵 Layer 4: $350
💵 Layer 5: $355
OR feel free to enter at ANY current price level if you're feeling bold! 🎲
Pro Tip: You can add more layers based on your capital and risk appetite. More layers = Better average price = Smoother ride! 🎢
🛑 STOP LOSS: The Emergency Exit
Thief's Escape Hatch: $320
⚠️ RISK DISCLAIMER: Dear Thief OG's (Ladies & Gentlemen of Fortune), this is MY stop loss level for MY strategy. You're the boss of your own money! Set your SL based on YOUR risk tolerance. Make money, take money - at your own risk! 🎲
🎯 TARGET: The Vault Unlocks Here!
POLICE BARRICADE ZONE (Strong Resistance Alert! 🚨): $400
This level is where we expect:
💪 Strong resistance
📈 Overbought conditions brewing
Bull traps potentially forming
Strategy: Escape with your bags of cash before the sirens go off! 🚔💨
⚠️ PROFIT DISCLAIMER: Again, Thief OG's - this is MY target, not financial advice! Take profits whenever YOUR plan says so. Your money, your rules, your responsibility! 💯
🔗 Related Pairs to Watch (Correlation Play)
Keep your eyes on these accomplices in the semiconductor/tech heist:
NASDAQ:NVDA (NVIDIA) - The GPU mastermind, moves often correlate with AVGO
NASDAQ:AMD (Advanced Micro Devices) - Another chip champ in the gang
NYSE:TSM (Taiwan Semiconductor) - The supplier kingpin
NASDAQ:QCOM (Qualcomm) - Wireless chip crew member
NASDAQ:SMH (VanEck Semiconductor ETF) - The whole gang in one basket
Key Correlation: When semiconductor sector heats up, AVGO typically rides the wave. Watch NASDAQ:SMH for sector-wide momentum! 📡
🎪 Why This Setup Works (Technical Edge)
✅ Layered entries reduce timing risk
✅ Multiple support zones below current price
✅ Clear risk/reward structure
✅ Room to run toward resistance at $400
✅ Semiconductor sector showing strength
🎬 Final Words from Your Friendly Neighborhood Thief
This is the "Thief Strategy" - a layered, calculated approach to catching moves in AVGO. It's all about spreading your risk, averaging your entry, and having a clear exit plan whether things go right (🎯 $400) or wrong (🛑 $320).
Remember: The best thieves always have an escape plan! 🏃💨
Trade smart, not hard! And always remember: Past performance doesn't guarantee future results, but a solid plan beats panic every time! 🧠💪
✨ If you find value in my analysis, a 👍 and 🚀 boost is much appreciated — it helps me share more setups with the community!
#AVGO #Broadcom #SwingTrading #DayTrading #TradingStrategy #StockMarket #TechnicalAnalysis #LayeredEntry #ThiefStrategy #Semiconductors #TechStocks #RiskManagement #TradingIdeas #StockTrading #BullishSetup #TradingView #MarketAnalysis #PriceAction #SupportAndResistance
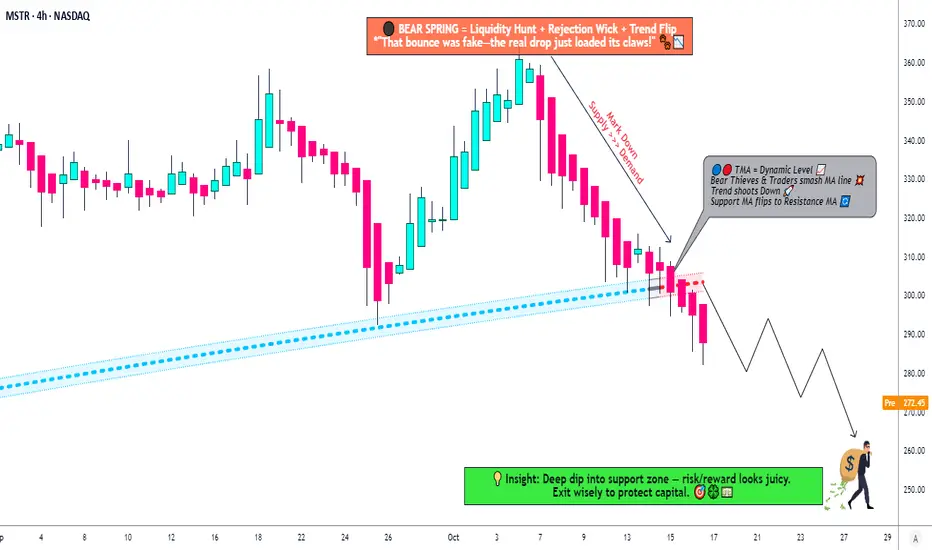
MSTR: Time to Short? Death Cross + Triangle Break Analysis🐻 MSTR "STRATEGY INC." - The Bear's Playground | Thief's Multi-Layer Setup 💰
📊 MARKET SNAPSHOT
Asset: NASDAQ:MSTR (Strategy Inc. - formerly MicroStrategy)
Current Price: ~$291.23 (Oct 17, 2025)
Setup Type: Swing/Day Trade - Bearish Confirmation
Strategy Style: "Thief Method" - Layered Limit Orders 🎯
🔍 THE SETUP - Why This Bearish Play Makes Sense
Ladies and Gentlemen, welcome to the Thief's playbook! 👋 MSTR just gave us a beautiful bearish signal with a triangular moving average breakdown. Here's what the charts are screaming:
🎯 The "Thief" Entry Strategy - Layered Limit Orders
This isn't your typical "buy now" play. We're sneaking in like a thief in the night with MULTIPLE SELL LIMIT LAYERS:
Entry Zones (Layer Your Shorts):
Layer 1: $310 (First resistance retest)
Layer 2: $300 (Psychological level)
Layer 3: $290 (Current consolidation zone)
💡 Pro Tip: Scale into your position! You can add MORE layers based on your risk tolerance (e.g., $305, $295, $285). The "Thief Method" is all about spreading your entries to catch the perfect price zones.
🛑 RISK MANAGEMENT - The Thief's Insurance Policy
Stop Loss: $320 🚨
(This is the Thief's emergency exit - if price breaks above this, the bears lost control)
⚠️ IMPORTANT NOTE:
Dear Thief OG's (Original Gangsters), this is MY stop loss level based on MY analysis. You should set YOUR OWN stop loss based on YOUR risk tolerance. Don't copy blindly - manage YOUR money, take YOUR profits (or losses) at YOUR own risk! This is YOUR trade, not mine. 💯
🎯 PROFIT TARGET - Where the Money's Hiding
Primary Target: $250 🎉
Why $250?
Strong historical support level
Oversold bounce zone (RSI typically rebounds here)
TRAP ALERT: Institutional buyers often accumulate at this level - be ready to ESCAPE with your profits before the bulls wake up! 🐂💤
⚠️ TAKE PROFIT NOTE:
Dear Thief OG's, $250 is MY target based on MY analysis. You can (and should) set YOUR own targets. If you're in profit at $270, $260, or even $280 - TAKE THE MONEY AND RUN! 💰 No shame in banking profits early. Remember: pigs get fat, hogs get slaughtered. This is YOUR trade, YOUR risk, YOUR decision!
🔗 RELATED ASSETS TO WATCH - The Correlation Game
MSTR doesn't trade in a vacuum! Keep your eyes on these correlated assets:
📈 Primary Correlation:
CRYPTOCAP:BTC (Bitcoin): ~$108,625 (Oct 17, 2025) - MSTR holds 640,000+ BTC (3%+ of total supply!)
Correlation Strength: 🔥🔥🔥🔥🔥 ULTRA HIGH
Why It Matters: MSTR is essentially a leveraged Bitcoin play. When BTC sneezes, MSTR catches a cold. Bitcoin's current bearish pressure directly impacts MSTR's valuation.
🔄 Secondary Watchlist:
NASDAQ:COIN (Coinbase): Crypto exchange - sentiment indicator
NASDAQ:RIOT (Riot Platforms): Bitcoin mining stock
NASDAQ:MARA (Marathon Digital): Another BTC-related equity
NASDAQ:CLSK (CleanSpark): Bitcoin mining operations
Key Point: If Bitcoin breaks below $105K support, expect MSTR to accelerate downward. Conversely, if BTC rallies back above $115K, this bearish setup could invalidate. Watch Bitcoin like a hawk! 🦅
📊 THE BIGGER PICTURE - Why MSTR Is Vulnerable Right Now
Bitcoin Pressure: BTC down -2.19% today, testing critical support levels
Institutional Caution: Recent S&P 500 rejection (not included in index) = credibility questions
Valuation Concerns: Trading at significant premium to NAV (Net Asset Value)
Technical Breakdown: Multiple MA crosses + trend reversal signals
Macro Headwinds: Risk-off sentiment in crypto markets (3-day consecutive decline)
🎓 THE THIEF'S WISDOM - Final Thoughts
This setup combines:
✅ Technical confirmation (MA breakout)
✅ Layered entry strategy (better average price)
✅ Clear risk management (defined stop loss)
✅ Realistic profit targets (strong support zone)
✅ Correlated asset monitoring (BTC relationship)
Remember: The market doesn't care about your opinion. Respect the charts, manage your risk, and don't get greedy. The "Thief Method" is about stealing profits intelligently, not gambling recklessly! 🎰❌
💬 TRADE SMART, NOT HARD!
This is a BEARISH SETUP with defined entries, exits, and risk parameters. Whether you're swing trading or day trading, the key is DISCIPLINE. Stick to your plan, don't chase, and protect your capital.
Questions? Thoughts? Drop them below! 👇
Let's build a community of smart traders who help each other win! 🤝
✨ If you find value in my analysis, a 👍 and 🚀 boost is much appreciated — it helps me share more setups with the community!
#MSTR #Bitcoin #BTC #TradingView #SwingTrading #DayTrading #BearishSetup #ShortSetup #CryptoStocks #TechnicalAnalysis #MovingAverages #LayeredEntry #RiskManagement #ProfitTarget #StrategyInc #MicroStrategy #ThiefMethod #TradingStrategy #StockMarket #NASDAQ
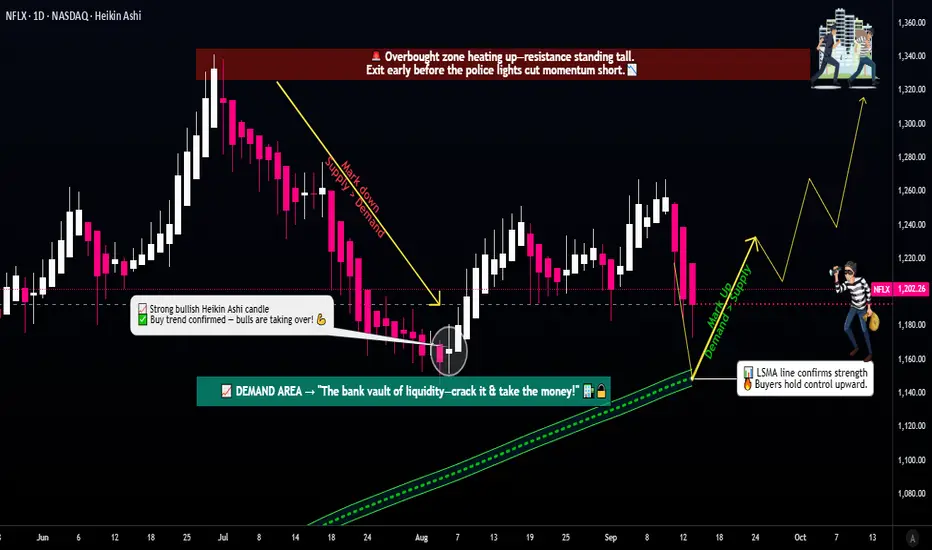
Popcorn Ready? Netflix Layering Setup for Bold Traders🎬 Netflix Stock | Thief Trader’s Profit Realization Blueprint 🍿💰
🧭 Market Outlook
Netflix (NFLX) is lining up for a bullish playbook — and here’s how the Thief Strategy goes down. This setup is purely educational and shares how I personally view price behavior with a layering approach.
🎯 Trading Plan (Swing/Day Trade Idea)
Entry (Layering Style 🥷): Instead of one-shot entries, the thief strategy is about multiple buy-limit layers. Example blueprint:
👉 1160 | 1170 | 1180 | 1190 | 1200 (more can be added if liquidity allows)
Stop Loss 🛡️: Thief-style SL ~1120 (after breakout levels are confirmed).
⚠️ Note to Thief OG’s: Manage your own SL & adapt risk. My level is an example, not a fixed call.
Target 🎯: Eyeing the 1340 zone, where resistance + overbought vibes + possible trap signals align. The thief rule? Escape before the crowd escapes 🚪💨.
⚠️ Again — not a fixed TP. Manage your own exits depending on profit goals & risk appetite.
🕵️♂️ Thief Trader Philosophy
This is not financial advice. It’s a “steal-and-escape” blueprint to show how layered entries can help smooth entries across zones instead of one rigid buy point. Adapt, manage, and steal profits like a pro before the market takes them back.
🔗 Related Assets to Watch
NASDAQ:AMZN — often shows correlation in big tech swings 📦
NASDAQ:AAPL — mega-cap sentiment driver 🍏
NASDAQ:MSFT — growth stock momentum check 💻
NASDAQ:QQQ — ETF to track Nasdaq 100 flow 📊
AMEX:SPY — broad market sentiment monitor 🏦
📌 Key Correlation Notes
Big tech stocks often move in sympathy — when Nasdaq pumps, Netflix usually gets extra popcorn 🍿 fuel.
Watch volatility spikes in TVC:VIX , as they can trap over-leveraged longs & shorts.
Macro cues (USD strength, yields, Fed talk) can shift momentum across all growth stocks.
✨ “If you find value in my analysis, a 👍 and 🚀 boost is much appreciated — it helps me share more setups with the community!”
#NFLX #Netflix #Stocks #SwingTrade #DayTrade #LayeringStrategy #Options #StockMarket #TradingView #ThiefTrader #Equities #QQQ #SPY #StockAnalysis
HEY NAZ, WHATS NEWS GONNA MAKE YOU DO?! NAZ Bias-Bearish(personally) HOWEVER-----
Let price show us the way. I believe that price will be looking for key levels to bounce around on before making its true climb or decline. The reason I am bearish this week is the belief that negative news is coming and a lack of pullbacks on daily/HTF charts. So sauce.... Im looking for price to come down and hit a fibs retracement at this FVG for a
GOOD BUY bounce! Around 25,428-25,394! First, setup; after that, the IPP (important price point) to look at will be how price interacts with 25,509-25,491. If it doesn't break above on a higher time frame, I believe we push LL to hit BIG FVG 25,214!! which i really want to buy from there but if it breaks above we can see a strong retest of SOB and HH's! Either way, WE GET PAID! Sitting on my hands until the price shows me where we're riding! GDluckThisWeek and happy hunting!

Can NQ1! Push Through $25K+ Resistance Zone?🎯 The Great NQ Heist: Layered Entry Strategy for E-Mini NASDAQ-100 Futures
📊 Market Overview
**Asset:** NQ1! (E-Mini NASDAQ-100 Futures)
**Strategy Type:** Swing/Day Trade - Wealth Accumulation Map
**Bias:** 🐂 **BULLISH**
🎭 The "Gentleman Thief" Layering Strategy
💰 Entry Philosophy: Layer Like a Pro
This setup uses a **sophisticated layering approach** - think of it as strategically placing multiple limit orders to capture the best average entry. You're not going all-in at one price; you're building your position like a chess master.
📍 Suggested Layer Entry Zones:
- 🎯 Layer 1: **24,800**
- 🎯 Layer 2: **24,900**
- 🎯 Layer 3: **25,000**
- 🎯 Layer 4: **25,100**
Note: You can scale in at ANY price level using this layering method. Add more layers based on your position size and risk tolerance. The beauty of this strategy is flexibility - enter where the market gives you opportunity! 🎪
🛡️ Risk Management
Stop Loss Zone: **24,700**
⚠️ **Important:** This is MY stop loss level based on technical structure. However, trading is a personal journey - YOU decide your own risk parameters. Protect your capital first, profits second. Your SL should align with YOUR risk tolerance and account size.
🎯 Profit Target
Target Zone: **25,600** 🚀
This level represents a confluence of:
- 💪 Strong resistance zone
- 📈 Overbought conditions
- Potential bull trap area
**Smart Exit Strategy:** As we approach this zone, consider scaling out of positions. Don't get greedy - take profits when the market offers them!
⚠️ **Reminder:** This is MY target projection. You're the captain of your own ship - take profits when YOU feel comfortable. Trail stops, scale out, or hold for moon - your money, your rules! 🌙
🔗 Related Pairs to Watch
Keep your eyes on these correlated instruments
- SEED_ALEXDRAYM_SHORTINTEREST2:NQ =F** - NASDAQ-100 Futures (spot reference)
- NASDAQ:QQQ - Invesco QQQ Trust (ETF equivalent)
- NASDAQ:AAPL , NASDAQ:MSFT , NASDAQ:NVDA , NASDAQ:GOOGL ** - Top NASDAQ-100 components
- NASDAQ:NDX - NASDAQ-100 Index (cash)
- CME_MINI:ES1! - E-Mini S&P 500 Futures (broader market correlation)
📌 Why these matter:** The NASDAQ-100 is tech-heavy, so major tech stocks drive NQ movement. Watch QQQ for retail sentiment and ES for overall risk appetite. When big tech moves, NQ follows! 💻
🎓 Strategy Breakdown
This "layering" or "scaling-in" approach offers several advantages:
- ✅ **Better average entry** - Dollar-cost averaging into position
- ✅ **Reduced timing risk** - Not dependent on perfect entry
- ✅ **Psychological comfort** - Builds confidence as position develops
- ✅ **Flexibility** - Adapt to market conditions in real-time
📢 Final Thoughts
The market rewards patience and discipline. This layered entry strategy is about working WITH the market, not against it. Whether you're a swing trader holding for days or a day trader scalping ticks, the principle remains: **Control your risk, let profits run.** 🏃♂️💨
✨ **If you find value in my analysis, a 👍 and 🚀 boost is much appreciated — it helps me share more setups with the community!**
**⚠️ DISCLAIMER:** This analysis represents a "gentleman thief" style layered trading strategy intended for educational and entertainment purposes only. This is NOT financial advice. Trading futures involves substantial risk of loss and is not suitable for all investors. Past performance is not indicative of future results. Always trade with risk capital you can afford to lose. Make your own trading decisions based on your personal risk tolerance, account size, and market analysis. 🎭📊
#NQ1 #NASDAQ100 #NASDAQFutures #EminiNQ #FuturesTrading #DayTrading #SwingTrading #TechnicalAnalysis #LayeringStrategy #ScalingIn #TradingSetup #FuturesMarket #TechFutures #NDX #QQQ #RiskManagement #TradingStrategy #MarketAnalysis #BullishSetup

NAS100 Intraday & Swing Trade Setup🎯 NAS100 (NASDAQ-100) Technical Analysis: Oct 27-31, 2025 | Intraday & Swing Trade Setup
Closing Price: 25,373.7 | Date: Oct 25, 2025 12:54 AM UTC+4 | Timeframes: 5M, 15M, 30M, 1H, 4H, 1D
━━━━━━━━━━━━━━━━━━━━━━━━━━━━━━━━━━━━━━━━━━━━━━━━━━━━
📊 ELLIOTT WAVE & STRUCTURAL ANALYSIS 🌊
From the daily chart perspective, NAS100 shows completion of Wave 4 correction around 25,100-25,200 support zone. Current positioning at 25,373.7 suggests early Wave 5 development with bullish impulse structure emerging. The 4H timeframe confirms impulsive uptrend with higher highs and higher lows—classic Elliott Wave signature for institutional accumulation phase.
💡 KEY INSIGHT: If 25,900-26,050 resistance breaks decisively on 4H close with volume confirmation, we target Wave 5 extension toward 26,400-26,800 range through mid-week.
━━━━━━━━━━━━━━━━━━━━━━━━━━━━━━━━━━━━━━━━━━━━━━━━━━━━
🔄 DOW THEORY & TREND CONFIRMATION ⬆️
Primary Trend: Bullish | Higher highs established above 25,600 on 1H charts
Secondary Trend: Consolidation above 25,300-25,350 support validates buyer control
Confirmation Signal: Volume surge on breakouts above 25,900 confirms institutional participation
The daily VWAP sits at 25,420, acting as dynamic support. Price trading above VWAP with 1D EMA(20) > EMA(50) > EMA(200) alignment signals strong bullish conviction for the coming week.
━━━━━━━━━━━━━━━━━━━━━━━━━━━━━━━━━━━━━━━━━━━━━━━━━━━━
⚡ INTRADAY SETUPS: 5M TO 1H TIMEFRAMES
5M & 15M: Utilize Ichimoku Cloud crosses for quick scalp entries. Tenkan-sen/Kijun-sen crossover signals 3-5 minute momentum trades. Bollinger Bands (20,2) show tight squeeze—breakout imminent. RSI <30 on 5M = panic-sell exhaustion reversal opportunity.
30M: This is the swing trader's sweet spot . Harmonic patterns—particularly Butterfly and Bat patterns—should be monitored around 25,200-25,100 support confluence. Gann angles from Oct 22 low project resistance at 25,888, 26,150.
1H: Primary intraday timeframe for entry/exit. Support: 25,300 (VWAP), 25,100. Resistance: 25,900 (breakout trigger), 26,050. RSI overbought above 70 = profit-taking zone. EMA(9) above EMA(21) = trend strength confirmation.
━━━━━━━━━━━━━━━━━━━━━━━━━━━━━━━━━━━━━━━━━━━━━━━━━━━━
🎪 WYCKOFF METHOD & ACCUMULATION PHASE 📈
Current price action displays classic Wyckoff accumulation: Spring formation around 25,200 + subsequent recovery above neckline. Effort (volume) on upside breakouts now exceeds effort on downside—textbook Wyckoff buying climax setup. Watch for secondary test of 25,300—if holds above with lower volume, expect breakout run to 26,000+.
⚠️ WARNING: Climax volume spike above 26,000 may indicate exhaustion—take profits on target.
━━━━━━━━━━━━━━━━━━━━━━━━━━━━━━━━━━━━━━━━━━━━━━━━━━━━
🔷 HARMONIC PATTERNS & FIBONACCI LEVELS 📐
Gartley Pattern forming in 4H with D-point targeting 25,850-25,920 (78.6% Fib retracement). Potential risk/reward ratio of 1:3+ makes this ideal swing entry zone. Support cluster: 25,300-25,420 (multiple MA confluence + VWAP). Extended Fib target: 26,400 (161.8% extension from Oct 22 impulse base).
━━━━━━━━━━━━━━━━━━━━━━━━━━━━━━━━━━━━━━━━━━━━━━━━━━━━
📍 TRADING PLAN: MON-FRI (OCT 27-31) 🗓️
INTRADAY SCALPERS (5M-30M): Target 25,750-25,850 breakout on Monday. Stop: 25,250. Take profit 1: 25,650 (+300 pips). Repeat breakout patterns on every higher low formation.
SWING TRADERS (4H-1D): Accumulate longs 25,300-25,420 on dips. Primary target: 26,150-26,250 (Wave 5 target). Secondary: 26,400-26,800. Stop loss: 24,900 (break below daily cloud). Risk/reward: 1:2.5 minimum.
⏰ OPTIMAL TIMING: US market open (13:30 UTC) provides best 5M-1H breakout volatility.
━━━━━━━━━━━━━━━━━━━━━━━━━━━━━━━━━━━━━━━━━━━━━━━━━━━━
🚨 REVERSAL & BREAKOUT SIGNALS 🎯
Reversal Alert: If RSI divergence forms (lower high on price, lower high on RSI) at 26,000+ = sell-off imminent. Initial support: 25,650. Hard stop: 25,420.
Breakout Confirmation: Volume >200M shares on 4H close above 26,000 = institutional breakout, extend targets to 26,600+. Failure to hold 25,900 three times = bullish setup invalidation.
━━━━━━━━━━━━━━━━━━━━━━━━━━━━━━━━━━━━━━━━━━━━━━━━━━━━
📊 VOLATILITY & BOLLINGER BAND SQUEEZE 📉
Current Bollinger Band width suggests compression before expansion . Watch 1H BB (20,2) for band walk breakout into 26,000+ on closing above upper band. ATR expansion above 250-300 points validates trending move. Consolidation below upper band = power accumulation before next leg up.
━━━━━━━━━━━━━━━━━━━━━━━━━━━━━━━━━━━━━━━━━━━━━━━━━━━━
⚖️ RISK MANAGEMENT CHECKLIST ✅
Daily loss limit: 2% portfolio | Use 1:2 minimum risk/reward ratio
Position sizing: Reduce entries above 26,200 (resistance cluster)
Breakout confirmation: Require 5-minute close above resistance + volume spike
Support holds: If 25,300 closes below on daily, trend invalidates—exit swings
━━━━━━━━━━━━━━━━━━━━━━━━━━━━━━━━━━━━━━━━━━━━━━━━━━━━
🎓 Technical Theory Applied: Elliott Wave (Wave 5 setup) | Wyckoff (Accumulation completion) | Dow Theory (Higher highs confirmation) | Harmonic Patterns (Gartley D-point) | Gann (Angular resistance) | Japanese Candlesticks (Bullish engulfing on 4H)
🛠️ Indicators Aligned: Bollinger Bands (squeeze breakout), RSI (bullish divergence), Volume (accumulation), VWAP (dynamic support), MAs (uptrend slopes), Ichimoku Cloud (bullish crossover).
📈 Bias: BULLISH with caution above 26,200
━━━━━━━━━━━━━━━━━━━━━━━━━━━━━━━━━━━━━━━━━━━━━━━━━━━━
⚠️ Disclaimer: This post is educational content and does not constitute investment advice, financial advice, or trading recommendations. The views expressed here are based on technical analysis and are shared solely for informational purposes. The stock market is subject to risks, including capital loss, and readers should exercise due diligence before investing. We do not take responsibility for decisions made based on this content. Consult a certified financial advisor for personalized guidance.

NAS100 Why I'm Watching for a Countertrend Short on US100The NASDAQ (US100) has pushed aggressively into fresh all-time highs, tapping into a key liquidity zone where buy-side liquidity sits above previous swing highs. 📈💧
Price has extended without any meaningful pullback, suggesting we may soon see exhaustion and a corrective move. As we approach the end of the week, institutional traders often rebalance or close positions, which can trigger short-term retracements. 🏦🔄
If price breaks structure to the downside, I’ll be watching for a counter—
residing in a premium zone to—butter to the downside swings—for a potential countertrend—but—
🛑 Not financial advice. For educational purposes only.
