SMH Bullish Setup – Breakout Plan for the Perfect Heist!🔥🚀 THIEF TRADER ALERT: SMH BULLISH HEIST PLAN! 🚀🔥
Asset: VANECK SEMICONDUCTOR ETF (SMH)
Plan: BULLISH BREAKOUT HEIST 🎯 (Resistance wall breakout candle close above 298.00)
🎯 THIEF ENTRY STRATEGY (LAYERING METHOD) 🎯
"Steal the dip like a PRO!" 💰🔪
Multiple Limit Orders (Layer Entry) 👇
1st Layer: 298.00 (Breakout Confirmation)
2nd Layer: 292.00 (Pullback Steal)
3rd Layer: 288.00 (Aggressive Discount)
4th Layer: 284.00 (Max Pain = Max Gain)
(Add more layers if you’re a risk-loving THIEF!)
⚠️ WARNING: DO NOT place SL or orders before breakout! (Only real THIEFS wait for confirmation!)
🛑 THIEF STOP LOSS (OG STYLE) 🛑
"Protect your loot or get wrecked!" 💣
SL @ 280.00 (Hard floor – adjust based on your risk appetite!)
Place SL ONLY AFTER breakout! (No premature stops – patience = profit!)
🎯 TARGET: 324.00 🚀 (OR ESCAPE EARLY IF MARKET TURNS)
Scalpers: Ride the waves, but stay LONG ONLY! 🌊
Swing Thieves: Hold & rob big! Use Trailing SL to lock gains! 🔐💰
📢 THIEF PRO TIPS:
✅ Set Alerts! (Don’t miss the breakout!) 🔔
✅ Watch for News! (Avoid getting caught in volatility traps!) 📉📈
✅ Boost & Support! (More boosts = more heists!) 💖🚀
🔥 FINAL MESSAGE:
"The market is a casino, and WE are the robbers! 🎰💰 Steal smart, escape rich! 🏴☠️💸"
👉 LIKE, BOOST & FOLLOW FOR MORE HEIST PLANS! 👈
🚀 NEXT HEIST COMING SOON… STAY TUNED! 🚀
#ThiefTrader #SMH #BreakoutHeist #LayerEntry #LimitOrderBandit 🎯🔥
Nasdaq100

NASDAQ NAS100 Analysis: Three-Drive Pattern, VWAP & Trade Plan📊 The NASDAQ 100 has been riding a strong bullish trend, pushing higher with relentless momentum. On the daily timeframe, price now looks heavily overextended 📈.
🔎 Zooming into the 4-hour chart, the overextension is even more apparent. In trending markets, we often observe a three-drive pattern (sometimes a fourth) before an aggressive correction occurs.
⚡ I’m keeping an eye out for a sharp pullback. If price finds support and confirms with a bullish break of market structure, this could present a high-probability long entry setup 🚀.
📹 In the video, I also dive into how I use the VWAP and Fibonacci retracement tools. Both are powerful indicators that provide valuable insight and a trading edge 🔧.
⚠️ Disclaimer: This analysis is for educational purposes only and not financial advice. Always trade responsibly and manage your risk.

NasdaqNasdaq consolidated another support level at 24740 in today's session. If the price remains above this support, buyers remain in control, and we could reach 25000, an important level that could signal the end of the bullish rally. An H1 candlestick closing above 24800 could confirm continuation.

NASDAQ 100 (NQ1!): Bullish! Wait For The Pullback, Then Buy ItWelcome back to the Weekly Forex Forecast for the week of Sept 22 - 26th.
In this video, we will analyze the following FX market: NASDAQ (NQ1!) NAS100
The NASDAQ is bullish. Let the market pullback to the +FVG (Internal Range Liquidity) a +FVG, and look for valid long setups on the lower timeframes.
Should the -FVG fail, then wait until it moves to a lower +FVG that will act as support. I do not recommend shorting this market until there is a clear bearish BOS.
Enjoy!
May profits be upon you.
Leave any questions or comments in the comment section.
I appreciate any feedback from my viewers!
Like and/or subscribe if you want more accurate analysis.
Thank you so much!
Disclaimer:
I do not provide personal investment advice and I am not a qualified licensed investment advisor.
All information found here, including any ideas, opinions, views, predictions, forecasts, commentaries, suggestions, expressed or implied herein, are for informational, entertainment or educational purposes only and should not be construed as personal investment advice. While the information provided is believed to be accurate, it may include errors or inaccuracies.
I will not and cannot be held liable for any actions you take as a result of anything you read here.
Conduct your own due diligence, or consult a licensed financial advisor or broker before making any and all investment decisions. Any investments, trades, speculations, or decisions made on the basis of any information found on this channel, expressed or implied herein, are committed at your own risk, financial or otherwise.

Nasdaq-100 (NDX) Weekly Chart 2025 Chart Context
This weekly timeframe analysis of the Nasdaq-100 Index (NDX) forms a key pillar in our 2025 macro analysis series. Following the breakout structure seen in TOTAL, TOTAL2, BTC.D, and US10Y, this chart utilizes 2 Fibonacci tools (1 trend-based extensions and 1 retracement) to project potential corrective and expansion scenarios.
Fibonacci Tools Used:
Fibonacci Retracement : Applies to the recent smaller swing to determine micro retracement zones and cluster supports.
0=20674 and 100=10504
Trend-Based Fibonacci Extension: Drawn using a three-leg structure (point A= 3993 to B=16724 to C10504) to forecast upside targets beyond ATH.
All take-profit (TP) levels: TP1 (~23,400), TP2 (~26,700), and TP3 (~30,344.49)—are located at confluence zones where Fibonacci levels from different tools align, reinforcing their validity and strength.
There is a 4TP above all the Visible TPs
Key price references:
0% retracement: ~20,674.71
Next Resistance ~23,400 (confluence of extensions and psychological resistance)
Projected TPs:
1TP=~23,400,
2TP=~26,700,
3TP=~30,344.49,
4TP=44000
Support/Resistance:
Red zone: ~16,700–18,300 (historical S/R and correction target and Fib Confluences)
Resistance zone: ~23,000–23,400 ,
22000(ATH area)
Key Technical Observations:
Fibonacci Retracement from ~20674 to ~15732 marks the initial corrective range.
Trend-Based Extensions forecast:
TP1 (~23,400): First breakout resistance
TP2 (~26,700): Medium-term expansion zone
TP3 (~30,344): Long-term target if macro tailwinds persist
Scenario Pathways:
Bullish Continuation: Breaks above ATH to reach TP2/TP3
Healthy Correction: Pullback to ~20,600 or deeper ~18,300 before resumption
Deep Correction: Revisits ~16,700 zone if macro environment deteriorates
Fundamental Context:
Tech Stocks & Economic Sentiment: NDX is often the first to move during liquidity expansions. Its performance signals risk-on behavior across global equity markets.
Rate Cuts in 2025: With anticipated Fed rate cuts, tech stocks are primed for inflows. Forward earnings valuations rise, justifying extended upside in high-beta tech.
AI Boom & Earnings Growth: Nasdaq is heavily weighted toward AI, cloud, and semiconductors—sectors expected to lead earnings surprises.
NDX Influence on Gold and Crypto
When NDX rallies:
Crypto: Risk appetite improves. Capital rotation flows into altcoins and layer-1 assets.
Bitcoin: Often sees parallel inflows, especially during strong tech rallies (e.g., 2020).
TOTAL & TOTAL3: Begin breakout patterns if NDX continues to surge.
Gold: May stall or correct as investors favor risk assets. However, gold still holds due to macro hedging and real yield pressures.
When NDX corrects:
Crypto: Volatility spikes. Altcoins bleed faster.
Bitcoin: Short-term dip but may decouple if viewed as digital gold.
Gold: Benefits from flight-to-safety behavior.
US10Y: Often reacts inversely to NDX moves—used for confirmation.
Search Highlights (2024–2025):
Institutions view NDX correction as signal to rotate into commodities (incl. gold).
Cross-market correlations show NDX peaks often precede crypto mini-rallies.
De-risking from NDX often triggers gold strength, especially in geopolitical or inflationary backdrops.
Bias & Strategy Implication
Primary Bias: Bullish
Expecting upside continuation to 26,700–30,000 zone
Multiple correction opportunities are present even during rally
Strategic Actions:
Monitor for correction to yellow/red zones for accumulation
Use NDX behavior as leading macro signal for crypto rotations
Watch resistance at 23,400 closely; breakout confirms trend extension
Time Horizon
Short-Term (1–2 months): Watch for breakout or correction to ~20,600–18,300
Mid-Term (3–6 months): Probable test of ~26,700
Long-Term (6–12 months): Potential expansion to ~30,344.49

NAS100 Technical Forecast: Key Levels & Traps🚀 NAS100 Technical Forecast: Key Levels & Traps 🐻
*Analysis as of Sept 20, 2025 (12:50 AM UTC+4)*
📊 Overall Market Context:
Price: 24,610. Geopolitical events remain a key volatility driver. Current price action suggests a cautious market seeking direction after recent moves.
🔍 Key Technical Indicators:
• RSI (14): Neutral zone (~50). No strong overbought/oversold signal.
• Bollinger Bands (20): Price near the middle band, indicating balanced volatility.
• Moving Averages: Watching for a potential bearish crossover on the 4H chart. Key resistance at the 50-EMA.
• VWAP: Current price trading around the session's VWAP; a break above signals intraday bullish bias.
🎯 Critical Support & Resistance:
• Immediate Resistance: 24,800 -> 25,000 (Psychological)
• Strong Resistance: 25,250 (Previous High)
• Immediate Support: 24,500 -> 24,300
• Strong Support: 24,000 (Key Level)
⚠️ Pattern Watch:
• Bull Trap Risk: A false breakout above 24,800 could lure buyers before a drop.
• Bear Trap Risk: A sharp rejection from 24,300 could trap sellers before a rally.
• No clear Harmonic or Elliott Wave pattern on lower timeframes; monitoring for setup.
📈 Intraday Trading (5M-1H Charts):
• BUY (Long): Above 24,650, targeting 24,800. Stop Loss: 24,550.
• SELL (Short): Below 24,500, targeting 24,300. Stop Loss: 24,650.
*Confirmation: Use 5-min RSI divergence and volume spikes.*
📉 Swing Trading (4H-Daily Charts):
• BUY Swing: On a bullish reversal candle at 24,300 support, target 25,000+. SL below 24,000.
• SELL Swing: On a rejection at 24,800 resistance, target 24,000. SL above 25,100.
*Wait for a 4H close above/below key levels for confirmation.*
🎲 Risk Management:
Always use a 1:2 Risk/Reward ratio. Protect your capital.
For individuals seeking to enhance their trading abilities based on the analyses provided, I recommend exploring the mentoring program offered by Shunya Trade. (Website: shunya dot trade)
I would appreciate your feedback on this analysis, as it will serve as a valuable resource for future endeavors.
Sincerely,
Shunya.Trade
Website: shunya dot trade
📝 TRADING CHECKLIST
Before entering any position:
- ✅ Confirm volume supports move
- ✅ Check RSI for divergences
- ✅ Verify multiple timeframe alignment
- ✅ Set stop loss before entry
- ✅ Calculate position size
- ✅ Review correlation with DXY/SPX
- ✅ Check economic calendar
- ✅ Assess market sentiment
⚠️Disclaimer: This post is intended solely for educational purposes and does not constitute investment advice, financial advice, or trading recommendations. The views expressed herein are derived from technical analysis and are shared for informational purposes only. The stock market inherently carries risks, including the potential for capital loss. Therefore, readers are strongly advised to exercise prudent judgment before making any investment decisions. We assume no liability for any actions taken based on this content. For personalized guidance, it is recommended to consult a certified financial advisor.

NASDAQ 100 (NQ1!): Bullish! Buy The Dip!Welcome back to the Weekly Forex Forecast for the week of Sept 15 - 19th.
In this video, we will analyze the following FX market: NASDAQ (NQ1!) NAS100
The NASDAQ is bullish. No reason in the world to start looking for shorts! Let the market pullback to Internal Range Liquidity (IRL), a +FVG or +OB, and look for valid long setups on the lower timeframes.
Enjoy!
May profits be upon you.
Leave any questions or comments in the comment section.
I appreciate any feedback from my viewers!
Like and/or subscribe if you want more accurate analysis.
Thank you so much!
Disclaimer:
I do not provide personal investment advice and I am not a qualified licensed investment advisor.
All information found here, including any ideas, opinions, views, predictions, forecasts, commentaries, suggestions, expressed or implied herein, are for informational, entertainment or educational purposes only and should not be construed as personal investment advice. While the information provided is believed to be accurate, it may include errors or inaccuracies.
I will not and cannot be held liable for any actions you take as a result of anything you read here.
Conduct your own due diligence, or consult a licensed financial advisor or broker before making any and all investment decisions. Any investments, trades, speculations, or decisions made on the basis of any information found on this channel, expressed or implied herein, are committed at your own risk, financial or otherwise.

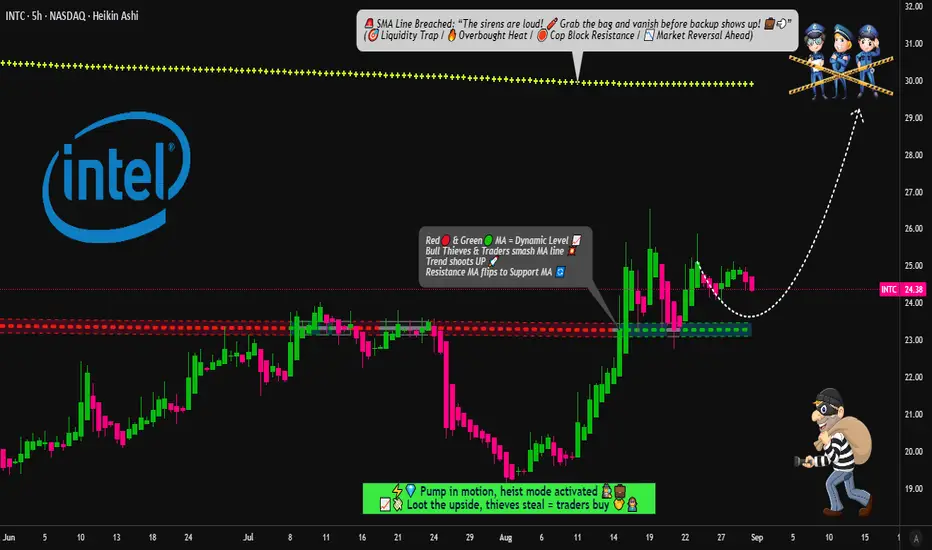
INTEL Heist Playbook: Buy the Dips, Escape Before the Sirens🔓💻 INTEL CORPORATION "Chip Heist" Stock Raid 💻🔓
🎯 Plan: Bullish Robbery | Targeting $30.00 | Stop Loss: $21.00
💰 Layered Limit Entries | Silicon Valley Loot | Calculated Takedown
🚨⚠️ Attention TRADERS, Tech Pirates & Market Mercenaries! ⚠️🚨
The INTC data vault is cracked, and the Thief Trader squad is executing a multi-layer LIMIT ENTRY HEIST – stacking shares like we're loading the getaway van. 🚐💾⚡
👀 We ain't chasing price – we're ambushing it with precision. Every discount? A planned acquisition.
💥 ENTRY: Any Price Level is a Gift 💥
"Bullish on Silicon" – we're collecting shares on any dip into value town!
Deploy buy limits at key psychological support layers: $25.00, $24.00, $23.00 (Add more layers based on your own capital).
Thief-style: We don't buy the hype; we steal the undervalued chips.
🛑 STOP LOSS: This is a Thief SL @ $21.00 🔐
Dear Ladies & Gentleman (Thief OG's), this is set at the breakdown panic zone – where the weak hands get shaken out.
Adjust your final SL based on your own risk appetite and strategy. Size wisely.
🎯 TARGET: $30.00 💸
The police barricade is there, so kindly escape with your stolen money before arrival.
We're targeting the next major resistance vault. Take profits and live to trade another day.
🧠 Swing Traders? Load the boat. Day Traders? Snatch the quick flips. Investors? Stack and hold. 💵☕
Use a trailing stop loss to protect your capital as the trend accelerates.
🕵️♂️ THIEF TRADER INSIGHTS:
📊 Backed by tech sector momentum, oversold bounces, and order block analysis.
🗞️ Earnings? Chip news? = increased volatility = adjust your layers accordingly.
⚠️ HEIST PROTOCOL:
✅ Avoid over-leveraging – this is a layering strategy, not a casino bet. 📉
✅ Use risk-adjusted position sizing on every limit order.
✅ Discipline is key. The market will deliver the discounts; you just need to be patient.
❤️🔥 Hit that 💥 LIKE & FOLLOW 💥 if you're riding with the Thief Squad!
Support the strategy. Respect the plan. Stack your gains like a true Market Outlaw.
🔔 Follow for the next HEIST. Big bags only. 💼🚀📈
“The market is a river of money—flowing from the impatient to the patient.” – Thief Trader
#INTC #Intel #StocksToWatch #TradingPlan #SwingTrading #StockMarket #Investing #LayeredEntries #ThiefTrader #ChipHeist
NASDAQ100 HIGH PROBABILITY SETUP SOON!!!🚨 NAS100 HIGH PROBABILITY SELL SETUP 🚨
* Here We Can See Clearly The Next Potential Move For US100 Coming Hours/Days.
* Keep Your Eyes Close On Your Trading Positions.
* Happy PIP Hunting Traders.
FXKILLA.

Nasdaq 100 Analysis: Index Hits All-Time HighNasdaq 100 Analysis: Index Hits All-Time High
As the chart shows, today the Nasdaq 100 index has, for the first time in history, climbed above the 24,500 level.
According to media reports, bullish sentiment was driven by the long-awaited Fed decision to cut interest rates for the first time in 2025.
Although the Fed also indicated it would remain cautious about further cuts, the easing acted as a bullish catalyst for the entire stock market – European equities also advanced today, with technology companies leading the way.
Technical Analysis of the Nasdaq 100
When looking at the Nasdaq 100 index within the context of the September rally (highlighted by the blue channel), we note the following:
→ In mid-September, price action reflected market optimism, as the index traded in the upper half of the channel – with resistance at the upper boundary (R) and support at line S.
→ Yesterday’s volatility spike produced a similar move (marked with an arrow) to the one we highlighted in today’s earlier gold analysis, namely a sharp reversal from the lower boundary of the channel (essentially a bullish engulfing pattern, albeit less clear due to volatility and the chosen timeframe).
Following the reversal from the lower boundary, which unfolded aggressively (a sign of bullish conviction), the price advanced steadily, breaking through key levels:
→ the midline of the blue channel;
→ the R2 resistance line shown in red;
→ the former all-time high at 24,165.
Moreover, the index’s behaviour around 24,300 demonstrated the persistence of buyers – the price moved above a cluster of local resistances and then extended its rally.
Bearish view:
→ bullish momentum has pushed the RSI indicator into overbought zone;
→ when attempting to break above the psychological 24,500 level, the price failed to hold, suggesting a false bullish breakout.
Given the above, we could assume that optimism prevails in the market, supported by the Fed’s decision:
→ on the one hand, further gains towards the upper boundary of the blue channel may take place;
→ on the other hand, the market may be overheated and vulnerable to a correction (for instance, back towards the blue midline).
This article represents the opinion of the Companies operating under the FXOpen brand only. It is not to be construed as an offer, solicitation, or recommendation with respect to products and services provided by the Companies operating under the FXOpen brand, nor is it to be considered financial advice.

What Could Derail the Nasdaq 100 Uptrend?The chart shows the US100 (Nasdaq 100, daily timeframe) extending its bullish momentum within a rising channel. Here’s the breakdown:
Trend & Structure:
The index has been in a steady uptrend since rebounding from its April lows, with price action respecting the boundaries of the ascending channel. It remains above both the 50-day SMA (23,416) and the 200-day SMA (21,481), confirming strong bullish structure.
Support Levels:
The lower channel boundary around 23,500 is immediate dynamic support.
The 50-day SMA provides further backing below that.
A key horizontal support is at 21,150, near the 200-day SMA, which marks the broader trendline base.
Resistance Levels:
The upper channel boundary near 24,500 is the immediate resistance.
A breakout above this region could extend gains toward 25,000, the next psychological target.
Momentum Indicators:
MACD remains positive, confirming upward momentum.
RSI (68.7) is approaching overbought levels but still has room before signaling exhaustion.
Outlook:
The Nasdaq 100 remains firmly bullish, with higher highs and higher lows supporting the trend. While the RSI hints at stretched conditions, momentum remains strong, and as long as price holds above 23,500, the path of least resistance points toward 24,500–25,000.
-MW

NAS100 Pullback into Fibonacci Zone: Watching for Bullish Break📊 NASDAQ 100 (NAS100) Update 📊
The NAS100 is in a strong bullish trend 🟢📈, clearly visible on the 4H chart ⏰ with consistent higher highs and higher lows 🔼🔼.
Currently, price has pulled back 🔽 right into my optimal entry zone 🎯 based on the Fibonacci retracement 🔢. From here, I’ll be watching closely for a bullish break of structure (BOS) 🔓 on the 15M timeframe ⏰ — that would be my signal to look for a long entry 🚀.
⚠️ This breakdown is educational only and not financial advice. 📚

NASDAQ100 HIGH PROBABILITY SETUP SOON!!!🚨 NAS100 HIGH PROBABILITY SELL SETUP 🚨
* Here We Can See Clearly The Next Potential Move For US100 Coming Hours/Days.
* Keep Your Eyes Close On Your Trading Positions.
* Happy PIP Hunting Traders.
FXKILLA.

NAS100 Trend Analysis: From Higher Highs to a Potential Shift📊 NASDAQ 100 (NAS100) Analysis 📊
Someone recently asked me to cover the NAS100 🤔 as price action can look a little confusing right now. On the 4H chart ⏰, we’ve been trending strongly 🟢📈 throughout the week. However, as we head into the end of the week 📅, things are starting to shift.
Zooming into the 30M timeframe 🔍, price action is showing early signs of weakness ⚠️. We’ve had a high, then a higher high ⬆️, and now a lower high 🔽 — instead of a continuation of higher highs.
In the video, we take a deep dive 🎥 into market structure 🏗️, price action 💡, and the trend 📊, highlighting what to watch out for as institutions and big players wind up or unwind positions 💼 into the week’s close.
💬 Your thoughts and comments are welcome!
⚠️ This is educational only and not financial advice. 📚

NQ (Nasdaq Futures) – Tuesday Setup 09/09/2025
🧠 Market Context
Weekly Bias: Buy-side liquidity above Friday’s and Monday’s highs remains intact → a natural draw for price.
Daily Bias: Price is consolidating near these highs, suggesting engineered liquidity.
Tuesday Profile (ICT concept): Often prints the high or low of the week. Expect a Judas Swing in the morning session before the real move develops.
🎯 Trading Idea
I expect New York Open (9:30–10:00 NY) to deliver a pump above Monday/Tuesday highs → running buy stops (BSL).
After this liquidity grab, look for rejection + Market Structure Shift (MSS) on 5m/15m charts.
That would confirm distribution and set up the short.
✅ Execution Plan
Wait for the Sweep:
Levels to watch: 23,890–23,910 (Friday & Monday highs).
Confirmation:
SMT divergence (ES fails to make new high while NQ takes it).
BOS/MSS on 5m → entry on FVG/OB retracement.
Targets:
TP1 → 23,800 (intra-day liquidity).
TP2 → 23,750 (Weekly Open level).
📌 Key Notes
If price continues bullish above 23,910 without rejection, invalidate the short idea → bias shifts to continuation higher (24,000+).
Otherwise, this is a textbook “Tuesday High of the Week” setup.
✍️ Summary:
I’m anticipating a Judas Swing to the upside at NY Open, taking buy-side liquidity, followed by a reversal into sell-side liquidity at 23,750.

NASDAQ NAS100 at a Crossroads: Riding Nvidias Surge with CautionThe immediate reaction to Nvidia's stellar earnings has been decidedly bullish, propelling the NASDAQ higher. We saw a classic "buy the rumor, sell the news" event where the "news" was so powerful it triggered a "fear of missing out" (FOMO) rally with a healthy correction on Friday.
In the next one to two weeks, the near-term bias is bullish, but with extreme caution. The market has received the fundamental "all-clear" it was waiting for from its most important company. However, the index is now technically overextended and sentiment is euphoric, making it vulnerable to a short-term pullback or consolidation. The primary trend, however, remains bullish IMO.
1. The Catalyst: Nvidia Earnings
Nvidia didn't just beat expectations; it shattered them and raised future guidance, validating the entire AI investment thesis.
Revenue & EPS: Significant beats on both the top and bottom lines.
Guidance: Q2 revenue guidance of ~$28B was vastly higher than analyst estimates of ~$26.6B, demonstrating unprecedented demand for its Blackwell and Hopper architecture chips.
Data Center: Revenue of $22.6B, up 427% year-over-year, is the core of the story. This shows that AI infrastructure spending is not slowing; it's accelerating.
Stock Split: The announcement of a 10-for-1 stock split adds a psychological boost for retail investors, improving accessibility and reinforcing bullish sentiment.
Analyst Interpretation: This wasn't just a quarterly report; it was a fundamental confirmation that the AI revolution has tangible, massive earnings power. It alleviated fears that the AI trade was a bubble. For the NASDAQ, which is market-cap weighted and heavily influenced by NVDA, this was rocket fuel.
2. Technical Analysis (One-Day Timeframe Post-Earnings)
Price Action: The NASDAQ gapped up powerfully at the open, breaking cleanly above its previous consolidation range. This was a strong bullish signal.
Volume: The rally was accompanied by massive volume, confirming broad institutional participation. This wasn't a low-volume grind; it was a conviction move.
3. Macro & Fundamental Backdrop
Interest Rates: The market is currently pricing in a higher-for-longer stance from the Fed. However, recent economic data (PMIs, jobless claims) has shown slight signs of softening, which keeps hopes alive for a potential rate cut later in the year. A stable, non-accelerating rate environment is acceptable for tech stocks, especially those like Nvidia with explosive earnings growth that outweighs rate concerns.
Geopolitics: While always a risk (U.S.-China tensions, elections), the market has largely shrugged off these concerns for now, choosing to focus on the stellar corporate fundamentals.
Market Breadth: A key watch-out. The rally has been narrow, led primarily by the "Magnificent 7" (now perhaps the "Fab 1" - Nvidia). For the rally to be sustainable, we need to see broader participation from other sectors and smaller-cap stocks within the NASDAQ.
4. Likely Outcome for the Next 1-2 Weeks: Bullish with a Caveat
Bullish Scenario (60% Probability):
The momentum from Nvidia is likely to carry the NASDAQ higher in the very near term. We could see a continued "melt-up" towards 17,400-17,500 as underinvested funds are forced to chase performance and add equity exposure. Any dip will likely be shallow and bought aggressively, with the 17,000 level holding firm.
Consolidation/Pullback Scenario (35% Probability):
This is the most likely healthy outcome. After such a massive, emotion-driven surge, the market is likely to need a period of digestion. We could see the NASDAQ chop sideways for a week or two to work off the overbought conditions. This would reset the momentum indicators and allow the market to build a new base for the next leg higher. This is not a bearish signal; it is a strengthening signal.
Bearish Reversal Scenario (5% Probability):
A sharp reversal below the 17,000 support level and a fill of the earnings gap (~16,900) would be a significant warning. This would likely require a new, negative macro catalyst (e.g., unexpectedly hot inflation data, a major geopolitical escalation) that forcefully changes the interest rate narrative.
Trading & Investment Implication
For Bulls / Existing Longs: Hold positions. Consider taking partial profits on extreme strength, but avoid selling your entire position. The trend is your friend. Use any pullback to the 17,000 support as a potential buying opportunity.
For New Entrants: Chasing the green spike is high-risk. Be patient. Wait for the inevitable pullback or period of consolidation to establish a position. The risk/reward is poor on the day after a massive gap up.
For Bears: Fighting this tape is exceptionally dangerous. The fundamental news from NVDA is a game-changer for the index. Shorting based solely on overbought conditions is a quick path to losses.
Final Analyst Call: The next week is likely bullish with high volatility, potentially extending gains. However, the following week is highly susceptible to a consolidation or pullback as the initial euphoria settles. The overall trajectory for the next two weeks is cautiously bullish, with the understanding that a 2-4% pullback is a normal and healthy part of a strong uptrend.
The burden of proof is now on the bears to prove they can wrestle control back from a market that just received the best possible news from its most important constituent.
Not financial advice, this is just my opinion.

ZGM | NASDAQ SNIPER ZONES FOR LONGTERM BASED ON SNR Nasdaq Trade !
NASDAQ H4 BREAKOUT THE SELL TRENDLINE FIRST , AND BOX OF RBS CALLED (RESISTANCE BECOME SUPPORT) HAVE A X SETUP
X SETUP EXPLAINED !
The Sell TL Broke And Nasdaq Have A Buy TL Thats Means Its The XSetup
X SETUP + QM SETUP + SUPPORT
FOLLOW US FOR MORE KNOWLEDGE AND TRADE IDEAS

Nasdaq 100 (NQ) - Technical Analysis Report - 20250908Analysis Date: September 8, 2025
Current Price: 23,671
Market Session: Post-Market Analysis
---
Executive Summary
Nasdaq 100 presents a moderately extended equity position requiring defensive management, but with meaningful institutional support structure revealed through 3-quarter volume profile analysis. While trading above recent institutional accumulation, the presence of multiple quarterly POCs creates a more robust support framework than initially assessed. This positioning requires cautious defensive strategies rather than emergency liquidation, with clear institutional reference levels for risk management.
---
Quarterly Volume Profile Analysis
3-Quarter Institutional Positioning Intelligence
The 3-quarter volume profile (Q1-Q3 2025) reveals a complex but supportive institutional positioning pattern across multiple price ranges:
Multi-Quarter Institutional Activity Zones:
Q1 2025: Heavy blue institutional accumulation at 21,800-22,200 range
Q2 2025: Substantial blue volume during correction at 19,800-20,500 range
Q3 2025: Fresh institutional activity developing at 22,000-22,400 levels
Current price (23,671) moderately extended above most recent institutional positioning
Comprehensive Support Structure:
Primary Support: 22,000-22,400 (Q1/Q3 institutional convergence zone)
Secondary Support: 20,200-20,500 (Q2 correction accumulation)
Extended Support: 19,500-20,000 (historical institutional floor)
Current Extension: 6-8% above primary institutional zones (manageable vs. catastrophic)
Institutional Pattern Analysis:
21,800-22,200: Q1 original institutional positioning validates current levels
19,800-20,500: Q2 correction buying shows institutional conviction during weakness
22,000-22,400: Q3 re-engagement demonstrates continued institutional participation
Above 23,000: Moderate extension requiring defensive positioning
Price Structure Context
Historical Pattern Recognition:
The 3-quarter analysis reveals continuous institutional engagement rather than abandonment, indicating healthy market structure with multiple layers of smart money support. This pattern suggests institutional rotation and repositioning rather than wholesale exit from technology exposure.
Revised Risk Assessment:
Moderate Extension: 6-8% above institutional levels vs. previously assessed 18%+
Multiple Support Layers: Three quarterly POCs provide robust institutional framework
Institutional Continuity: Ongoing smart money participation throughout 2025
Risk Definition: Clear institutional boundaries at multiple levels for defensive management
Sector Composition and Market Leadership
Technology Sector Positioning:
Artificial intelligence leadership driving institutional reallocation
Mega-cap concentration providing stability and institutional interest
Innovation premium supporting elevated valuation multiples
Defensive technology characteristics during uncertain economic cycles
---
Execution Chart Technical Analysis
Current Technical Configuration - MIXED SIGNALS
DEMA Analysis - MOMENTUM CONCERNS:
Black Line (Fast DEMA 12): Currently at 23,671
Orange Line (Slow DEMA 20): Currently at 23,597
Configuration: Bullish but showing momentum deceleration
Trend Bias: Technical momentum weakening despite continued bullish bias
DMI/ADX Assessment - TREND MATURITY:
ADX Level: Declining from previous highs, indicating mature trend phase
+DI vs -DI: +DI maintaining slight edge but margin narrowing
Momentum Direction: Signs of trend maturation after extended advance
Trend Strength: Weakening ADX suggests institutional repositioning phase
Stochastic Analysis - OVERBOUGHT BUT NOT EXTREME:
Tactical Stochastic (5,3,3): Overbought with some negative divergence
Strategic Stochastic (50,3,3): Extended levels but within historical norms
Divergence Analysis: Moderate negative divergences suggesting consolidation need
Support and Resistance Levels
Critical Technical Levels:
Current Resistance: 24,000 (psychological and technical barrier)
Immediate Support: 23,400 (DEMA cluster support)
Key Support: 22,800 (recent consolidation boundary)
Major Support: 22,200 (Q1/Q3 institutional convergence)
Critical Support: 20,500 (Q2 institutional accumulation)
Ultimate Support: 19,500-20,000 (historical institutional floor)
---
Trading Scenarios and Setup Criteria
Scenario 1: Defensive Profit-Taking Setup (PRIMARY)
Recommended Position Management:
Systematic reduction of existing positions by 50-75%
Profit-taking priority given moderate extension above institutional levels
Maintain small tactical exposure with tight risk management
Capital reallocation to higher-conviction institutional accumulation opportunities
Profit-Taking Protocol:
Primary Action: Reduce positions by 50-75% at current levels
Secondary Reduction: Complete exit on failure to hold 22,500 support
Stop Management: Trail stops using 22,200 institutional support
Cash Allocation: Redirect capital to commodity opportunities with stronger institutional backing
Scenario 2: Tactical Range Trading (SECONDARY)
Range-Bound Management:
Defined range: 22,200-23,800 (institutional support to resistance)
Small position tactical trading within institutional boundaries
Quick profit-taking on bounces toward 23,500-23,800
Defensive positioning on approaches to 22,200 support
Range Parameters:
Long Zone: 22,200-22,500 (institutional support approach)
Short Zone: 23,600-23,800 (resistance approach)
Stop Distance: 400-600 points maximum
Position Size: Reduced allocation (1% account risk maximum)
Scenario 3: Breakdown Management (DEFENSIVE)
Support Violation Protocol:
Break below 22,200 requires immediate position liquidation
Institutional support violation indicates potential deeper correction
Target return to 20,200-20,500 Q2 institutional accumulation
Complete avoidance until clear institutional re-engagement
Breakdown Parameters:
Critical Level: 22,200 (institutional support)
Action Required: Immediate exit of all positions
Targets: 20,500, 20,000, 19,500 (institutional accumulation zones)
Re-entry Criteria: New institutional accumulation evidence required
---
Risk Management Protocols
Position Sizing Guidelines
Defensive Approach (Recommended):
Maximum Risk: 1.5% of account (reduced from standard due to extension)
Contract Calculation: Account Size × 0.015 ÷ (Stop Distance × $5)
Example: $100,000 account with 500-point stop = 40 contracts maximum
Rationale: Extended positioning requires conservative allocation
Stop Loss Hierarchy
Tactical Stop: 23,200 (execution chart support cluster)
Strategic Stop: 22,200 (institutional support boundary)
Emergency Stop: 20,500 (Q2 institutional accumulation violation)
Portfolio Management Framework
Defensive Positioning Strategy:
Current Holdings: Reduce exposure by 50-75%
New Positions: Limited tactical exposure only
Capital Reallocation: Redirect to institutional accumulation opportunities (NG, CL, 6E)
Monitoring Frequency: Daily assessment of institutional level respect
---
Market Context and External Factors
Technology Sector Fundamental Assessment
Supporting Factors:
Artificial intelligence revolution driving institutional reallocation
Productivity gains supporting elevated valuation multiples
Defensive growth characteristics during economic uncertainty
Innovation leadership providing competitive advantages
Risk Factors:
Interest rate sensitivity affecting growth stock premiums
Regulatory scrutiny on mega-cap technology companies
Valuation concerns at current extension levels
Economic cycle sensitivity for discretionary technology spending
Institutional Investment Trends
Smart Money Positioning:
Continued institutional engagement evidenced by Q3 volume activity
Rotation within technology rather than wholesale sector exit
Quality focus on mega-cap names with defensive characteristics
AI theme driving strategic institutional reallocation
---
Monitoring Checklist and Alert Levels
Daily Monitoring Requirements
Institutional Respect: Monitor behavior at 22,200 support boundary
DEMA Configuration: Watch for momentum deterioration or bearish crossover
Volume Analysis: Track institutional activity at current levels
Sector Rotation: Monitor technology vs defensive sector performance
Policy Impact: Federal Reserve decisions affecting growth stock valuations
Critical Alert Levels
Risk Escalation Alerts:
Break below 22,200 institutional support with volume
DEMA bearish crossover below 23,400
ADX declining below 20 with -DI gaining dominance
Technology sector rotation accelerating toward defensives
Defensive Action Triggers:
Multiple failures to break above 24,000 resistance
Volume decline on any rally attempts above 23,500
Institutional selling evidence (yellow volume) at current levels
Federal Reserve policy shifts affecting interest rate outlook
---
Strategic Outlook and Risk Assessment
Risk/Reward Analysis
Moderate Risk Profile:
Upside Potential: Limited 500-1,000 points to major resistance
Downside Risk: 1,500-3,000 points to institutional accumulation zones
Risk/Reward Ratio: Unfavorable 1:2+ downside bias
Probability Assessment: Moderate (35%) for further upside, High (65%) for correction
Portfolio Allocation Recommendation
Defensive Management Required
Nasdaq 100 requires defensive positioning due to moderate extension above institutional levels, but the presence of multiple quarterly POCs provides meaningful support structure. While not emergency territory, the asymmetric risk profile favors systematic profit-taking and capital reallocation to higher-conviction opportunities with stronger institutional backing. The 3-quarter analysis reveals ongoing institutional engagement, allowing for tactical exposure with proper risk management.
Allocation Framework:
Current Portfolio Weight: Reduce to 8-12% maximum (from higher previous levels)
Entry Method: Limited tactical positions only until institutional re-accumulation
Hold Period: Short-term tactical only, systematic profit-taking
Exit Strategy: Defensive reduction with 22,200 as critical support
---
Conclusion and Strategic Assessment
Nasdaq 100 analysis demonstrates the importance of comprehensive timeframe evaluation in institutional intelligence assessment. The 3-quarter volume profile reveals a more nuanced risk picture than initially assessed, showing continued institutional engagement across multiple price levels. While defensive positioning remains appropriate due to moderate extension, the presence of multiple institutional support layers allows for tactical exposure rather than complete avoidance. Current conditions warrant systematic profit-taking with clear institutional boundaries for risk management.
Strategic Priority: Defensive positioning with systematic profit-taking while respecting institutional support levels at 22,200 and 20,500 as critical risk management boundaries.
Next Review: Daily monitoring of institutional level respect and momentum indicators
Position Management: Systematic reduction with defensive stops at institutional boundaries
---
Important Disclaimer
Risk Warning and Educational Purpose Statement
This analysis is provided for educational and informational purposes only and does not constitute financial advice, investment recommendations, or trading signals. All trading and investment decisions are solely the responsibility of the individual trader or investor.
Key Risk Considerations:
Futures trading involves substantial risk of loss and is not suitable for all investors
Past performance does not guarantee future results
Market conditions can change rapidly, invalidating any analysis
Leverage can amplify both profits and losses significantly
Individual financial circumstances and risk tolerance vary greatly
Professional Guidance: Before making any trading decisions, consult with qualified financial advisors, conduct your own research, and ensure you fully understand the risks involved. Only trade with capital you can afford to lose.
Methodology Limitations: Volume profile analysis and technical indicators are tools for market assessment but are not infallible predictors of future price movement. Market dynamics include numerous variables that cannot be fully captured in any single analytical framework.
The views and analysis presented represent one interpretation of market data and should be considered alongside other forms of analysis and individual judgment.
NQ100 Intraday Outlook – Sept 8, 2025🧠 NQ100 Intraday Outlook – Sept 8, 2025
Bias: Intraday Bearish after NY Open
Price is currently trading within a well-defined premium zone, between the Sunday-Monday Order Block and the BPR M30 area.
🧩 Key Observations:
Price tapped into a minor M5 Order Block (OB) right after the 8:30 NY macro event.
We're seeing a reaction to a short-term OB, with a small push up likely to grab liquidity above the London session high.
Expecting liquidity run + rejection from the upper OB zone (23,810–23,830).
🔽 Bearish Scenario:
After the sweep of local highs, I anticipate a sell-off toward the Imbalance zone below (23,710 area).
Main targets are:
Imbalance fill
Possibly further down toward Weekly Open near 23,680
🔧 Confluence:
Midnight Open has already been reclaimed.
NY AM session is about to open – expecting expansion to provide confirmation.
Potential divergence between NQ (stronger) and ES (weaker) gives context for relative weakness later in the session.
📌 Idea Summary:
I expect one final push into the premium zone to grab liquidity before reversing down toward the Imbalance and possibly into the Weekly Open.

NASDAQ (NQ1!): Buy It Until The Market Notifies Us Otherwise!Welcome back to the Weekly Forex Forecast for the week of Sept 8 - 12.
In this video, we will analyze the following FX market: NASDAQ (NQ1!) NAS100
The NASDAQ looks poised to move higher. There is potential for it to make a new ATH.
Wait for pullbacks to poi's for valid long setups.
I do not see a reason to sell this market. Until there is a bearish break of market structure, buys are the ticket.
Enjoy!
May profits be upon you.
Leave any questions or comments in the comment section.
I appreciate any feedback from my viewers!
Like and/or subscribe if you want more accurate analysis.
Thank you so much!
Disclaimer:
I do not provide personal investment advice and I am not a qualified licensed investment advisor.
All information found here, including any ideas, opinions, views, predictions, forecasts, commentaries, suggestions, expressed or implied herein, are for informational, entertainment or educational purposes only and should not be construed as personal investment advice. While the information provided is believed to be accurate, it may include errors or inaccuracies.
I will not and cannot be held liable for any actions you take as a result of anything you read here.
Conduct your own due diligence, or consult a licensed financial advisor or broker before making any and all investment decisions. Any investments, trades, speculations, or decisions made on the basis of any information found on this channel, expressed or implied herein, are committed at your own risk, financial or otherwise.

NAS100 At Major Resistance - Breakout or Reversal?NAS100 Technical Analysis: 🚀 At Major Resistance - Breakout or Reversal? 📉
Asset: NAS100 (NASDAQ 100 CFD)
Analysis Date: September 5, 2025
Current Closing Price: 23,639.8 (as of 12:59 AM UTC+4)
Timeframes Analyzed: 1H, 4H, D, W
Executive Summary & Market Outlook 🧐
The NAS100 is at a critical technical juncture, testing a formidable resistance zone between 23,600 and 23,800. 📊 The index is in a clear long-term bullish trend but shows signs of short-term exhaustion after a powerful rally. This is a classic "make-or-break" level. A decisive breakout above 23,800 could ignite a new leg up towards 24,500, while a rejection here may trigger a significant corrective pullback towards 22,800. This analysis provides a roadmap for both intraday traders 🎯 and swing traders 📈.
Multi-Timeframe Technical Analysis 🔍
1. Trend Analysis (Daily & 4-Hour Chart):
Primary Trend: 🟢 Bullish. Price is above all major Daily Moving Averages (200, 100, 50 EMA), which are aligned bullishly.
Short-Term Trend: 🟡 Bullish but Overextended. The rally has been near-vertical, suggesting the market is ripe for a pause or pullback.
2. Key Chart Patterns & Theories:
Resistance Confluence Zone 🧱: The current price is battling a massive resistance cluster. This zone includes:
A prior major swing high (Price Action Resistance).
The 127.2% and 161.8% Fibonacci extension levels from the last significant correction.
A potential Bullish Cypher pattern's Potential Reversal Zone (PRZ).
Elliott Wave Theory 🌊: The rally from the last major low is best counted as a powerful Impulse Wave. We are likely in the final stages of Wave 5 or a complex Wave 3 extension. This implies that while the trend is up, a larger Wave (4) correction is increasingly probable. Typical retracement targets for a Wave 4 are the 38.2% Fib level near 22,800.
Ichimoku Cloud (H4/D1) ☁️: Price is trading high above the Cloud on daily charts, confirming the strong bullish trend. The Lagging Span (Chikou Span) is also well above price, indicating sustained buying pressure. However, such extreme extensions often precede consolidation.
Gann Theory ⏳: The 23,600-23,800 area represents a key mathematical resistance zone. A daily close above this could open the path to the next Gann angle target.
3. Critical Support & Resistance Levels:
Resistance (R1): 23,800 - 24,000 (Key Psychological & Technical Ceiling) 🚨
Resistance (R2): 24,500 (Projected Target)
Current Closing Price: ~23,640
Support (S1): 23,200 - 23,400 (Immediate Support & 21-period EMA) ✅
Support (S2): 22,800 - 23,000 (Major Support - 38.2% Fib & Prior Breakout Zone) 🛡️
Support (S3): 22,200 (200-Day EMA & 50% Fib)
4. Indicator Consensus:
RSI (14-period on 4H/D): Reading is above 70 on both timeframes, signaling severely overbought conditions. 📛 This is a warning against chasing longs at these highs. A bearish divergence is forming on the 4H chart, hinting at weakening momentum.
Bollinger Bands (4H) 📏: Price is consistently riding the upper band, a sign of a strong trend. However, a move back towards the middle band (20-period SMA) is a common next step after such extensions.
Moving Averages: The bullish alignment (EMA8 > EMA21 > EMA50) is intact. The EMA 21 on the 4H chart (~23,400) is critical immediate support.
Volume & VWAP: Volume has been declining on the most recent push higher, a potential bearish divergence 📉 suggesting a lack of conviction at these highs.
Trading Strategy & Forecast 🎯
A. Intraday Trading Strategy (5M - 1H Charts):
Bearish Scenario (Rejection Play) ⬇️: This is the preferred setup given overbought conditions. Look for bearish reversal candlestick patterns (e.g., Bearish Engulfing, Evening Star 🌟) at or near the 23,800 resistance.
Entry: On confirmation of rejection.
Stop Loss: Tight, above 23,850.
Target: 23,400 (TP1), 23,200 (TP2).
Bullish Scenario (Breakout Play) ⬆️: If buyers overpower and we get a strong 1H close above 23,850, a momentum long could be viable.
Entry: On a small pullback to ~23,780 (re-test as support) or on the breakout.
Stop Loss: Below 23,650.
Target: 24,200 (TP1), 24,500 (TP2).
B. Swing Trading Strategy (4H - D Charts):
Strategy: WAIT FOR A PULLBACK. The risk/reward for new long entries at this resistance is poor. 🚫 The optimal strategy is to wait for a healthy correction to key support zones to add long positions.
Ideal Long Zones: 23,200 (shallow pullback) or 22,800 (deeper correction). ✅
Bearish Risk: A daily close below 22,800 would signal a much deeper correction is likely underway, potentially targeting 22,200.
Risk Management & Conclusion ⚠️
Key Risk Events: High-impact US economic data (e.g., NFP, CPI) and Fed policy announcements are paramount. 🔥 Any hawkish surprises could be the catalyst for a sharp tech-led selloff.
Position Sizing: The potential for increased volatility demands conservative risk management. Never risk more than 1-2% of your account on a single trade.
Conclusion: The NAS100 is bullish but exhausted. 🥴 The current resistance zone is a high-risk area for new longs and a high-probability area for a pullback. 🎯 Swing traders should be patient for a better entry. Intraday traders can play the range between 23,200 and 23,800 until a decisive break occurs. The overall trend remains up, but a period of consolidation or correction is the most probable outcome in the near term.
Overall Bias: 🟢 Bullish above 22,800 | 🟡 Neutral/Bearish below 23,200
For individuals seeking to enhance their trading abilities based on the analyses provided, I recommend exploring the mentoring program offered by Shunya Trade. (Website: shunya dot trade)
I would appreciate your feedback on this analysis, as it will serve as a valuable resource for future endeavors.
Sincerely,
Shunya.Trade
Website: shunya dot trade
Disclaimer: This post is intended solely for educational purposes and does not constitute investment advice, financial advice, or trading recommendations. The views expressed herein are derived from technical analysis and are shared for informational purposes only. The stock market inherently carries risks, including the potential for capital loss. Therefore, readers are strongly advised to exercise prudent judgment before making any investment decisions. We assume no liability for any actions taken based on this content. For personalized guidance, it is recommended to consult a certified financial advisor.

Nasdaq - Preparing for another correction!🚔Nasdaq ( TVC:NDQ ) is starting to look weak:
🔎Analysis summary:
Over the course of the past couple of months, we witnessed an incredible rally on the Nasdaq. Following this previous price action, it is quite likely that we will soon see another correction. This could start with the current retest of the channel resistance trendline.
📝Levels to watch:
$23.000
SwingTraderPhil
SwingTrading.Simplified. | Investing.Simplified. | #LONGTERMVISION

Fed cut odds hit 97% ahead of Friday’s jobs report Markets are waiting for Friday’s U.S. NFP jobs report, which could heavily influence the Federal Reserve’s next move on interest rates.
Traders want a result that supports the case for rate cuts but doesn’t raise fears of a weakening economy. The ADP private payrolls report showed 54,000 new jobs in August. Stocks moved higher on the news, as wall street saw the number as weak enough for the Fed to cut rates in September, but not so weak that it signals a recession.
According to CME Group’s FedWatch tool, there is now a 97% chance the Fed will lower rates when it meets in two weeks.
