eBay: Progress!Recently, eBay has shifted upward and has achieved consistent gains since. We now consider waves C in green and b in orange as completed and expect an imminent arrival at our red Short Target Zone between $92.40 and $98.54. There, the orange three-part move is projected to complete blue wave (ii), after which we anticipate significant sell-offs in the following wave (iii) below the support at $75.29.
Nasdaqstock

NASDAQ100 Technical Roadmap for Swing Traders📈 NASDAQ100 Bullish Swing Setup — Pullback to Power Move?
Asset:
NAS100 / US100 — NASDAQ 100 Index 💻📊
Market Type: Index
Trade Style: Swing Trade
📌 Market Plan (Bias):
🟢 Bullish structure confirmed
Price is respecting the Triangular Moving Average (TMA) pullback, signaling continuation strength within the broader uptrend.
🎯 Entry Strategy:
✅ Any Price Level Entry (Layered Approach Allowed)
Layering / Scaling-In Method:
This plan uses a multiple limit order (layering) strategy to optimize average entry during pullbacks.
Buy Limit Layers:
24900
25000
25100
📌 (You may increase or adjust layers based on your own risk and capital allocation)
🛑 Stop Loss (Risk Control):
🔴 Thief SL: 24700
📢 Adjust your stop loss according to your personal risk management and strategy.
This level invalidates the bullish pullback structure if broken.
🎯 Target / Exit Plan:
🟠 Primary Target: 25800
📌 Rationale:
Strong resistance zone
Overbought conditions may appear
Trap potential near highs
Possible corrective move from resistance
💡 Action: Secure profits near resistance — don’t overstay.
⚠️ Risk Disclaimer:
📢 Stop loss and target levels are for educational purposes only.
📢 Always manage risk independently and trade responsibly.
🔗 Related Markets to Watch (Correlation & Confirmation):
📊 US Indices (Direct Correlation):
US30 (Dow Jones) 🏭
→ Strength confirms broad US equity participation
SPX500 (S&P 500) 📈
→ Institutional flow confirmation for NASDAQ strength
💵 USD Index & Rates (Inverse / Indirect Impact):
DXY (US Dollar Index) 💲
→ Strong USD can slow tech upside; weakness supports NAS100
US10Y Treasury Yield 📉
→ Falling yields = bullish for growth & tech stocks
🧠 Risk Sentiment Assets:
BTC/USD ₿
→ Risk-on flows often align with NASDAQ momentum
VIX (Volatility Index) ⚡
→ Rising VIX = caution; falling VIX = trend continuation
💬 Final Note:
📈 Follow structure, respect risk, scale wisely.
🧠 Let price confirm — don’t chase.
👍 If this plan helps your analysis, boost with a like and share your view.

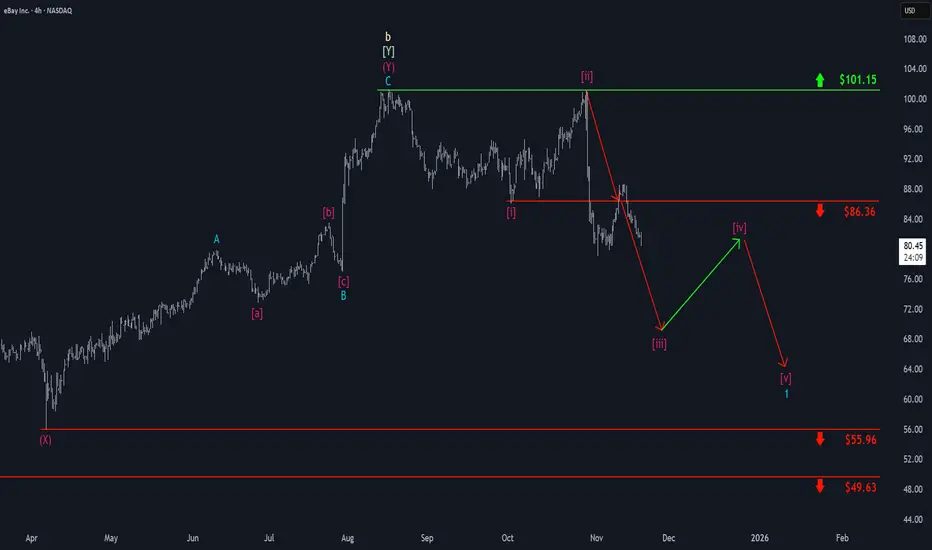
eBay: Set for Further DeclineseBay has recently made another move higher, briefly reclaiming the $86.36 level. However, the stock has since resumed its downward trajectory as anticipated and is expected to continue selling off soon as part of magenta wave . Overall, this magenta downward impulse should push price closer to support at $55.96, completing turquoise wave 1.
Booking: Persistent Counter PressureBooking has continued to face persistent counter pressure to the upside, which resulted in only limited downward movement. We still primarily expect that, within the current magenta downward impulse, price will move closer to—and eventually fall below—the support level at $4,093. However, if stronger upward momentum emerges and pushes price above the $6,101 resistance, we will then have to consider the stock as remaining in a broader uptrend, with the potential for a new high in blue wave alt.(I) (probability: 37%).

NBIS : Long worth TryingNebius group stocks are technically strong.
The downtrend since November 9, 2021 has been broken and the price is trading above the 50 and 200-period moving averages.
When we draw a medium-term Fibonacci level, we can take the take profit point at 0.618 and the stop-loss point at 0.382.
This gives us a Risk/Reward Ratio of 3.00.
A small position size is ideal.
Risk/Reward Ratio : 3.00
Stop-Loss : 43.46
Take-Profit : 60.00

RGTI : First Long Position AreaNASDAQ listed Rigetti Computing Inc. stock is currently trading above the 50 and 200 period moving averages.
Once it gained momentum, it later lost it but its outlook is not weak at the moment.
Right now, if the Iran-Israel war uncertainty is overcome and if there is no bad news affecting the index, the gap may close.
Risk/Reward ratio of 3.00 is a very valuable ratio to try with small position amounts.
Risk/Reward Ratio : 3.00
Stop-Loss : 9.91
Take-Profit : 18.2
Regards.

Can NASDAQ100’s Retest Turn Into a Full-Fledged Rally?⚡ NASDAQ100 — “The Wall Street Engine” Trade Opportunity Guide (Swing / Day Trade)
Plan:
📈 Bullish confirmation awaited at the Hull Moving Average retest.
When price respects that dynamic zone and momentum aligns, the Thief layers up — ready to stack positions like a pro!
💰 Thief Strategy Playbook:
Thief’s weapon? Layering entries — the art of scaling in like a patient hunter.
Multiple buy limit orders are placed around:
🔹 24,400 🔹 24,500 🔹 24,600
(You can adjust or add more layers based on your own trading structure and capital.)
🛡️ Stop-Loss:
This is the Thief’s SL → @24,200
🕵️♂️ Note to all Thief OGs:
I’m not recommending that you copy my SL — risk management is your call.
Remember: Make money, then take money at your own risk.
🎯 Target Zone:
@25,300 — where the POLICE BARRICADE (resistance) stands tall!
⚠️ The zone aligns with overbought levels + liquidity trap potential, so don’t overstay your welcome.
Escape with profits like a smart thief before the market cuffs you! 💨
🕵️♂️ Note again to Thief OGs:
Targets are flexible — adapt based on your execution and structure confirmation.
🔍 Correlated Assets to Watch:
SP:SPX (S&P500) — often mirrors NASDAQ’s overall direction.
TVC:DJI (Dow Jones) — gives early risk-on/risk-off sentiment clues.
TVC:US10Y (US Treasury Yield) — rising yields can pressure tech stocks.
TVC:VIX (Volatility Index) — watch for volatility spikes; they often precede reversals.
Correlation Key Insight:
When the dollar weakens and yields cool, NASDAQ tends to fly 🚀 — liquidity rotation favors growth stocks and tech-heavy indices.
⚙️ Quick Recap:
✅ Bias: Bullish (with retest confirmation at Hull MA)
💸 Entry Zone: 24,400 → 24,600 (Layered limits)
🧱 SL: 24,200 (risk-controlled zone)
🎯 TP: 25,300 (liquidity + resistance zone)
⚠️ Risk: Adjust position size and trail stops as structure evolves
✨ “If you find value in my analysis, a 👍 and 🚀 boost is much appreciated — it helps me share more setups with the community!”
📜 Disclaimer:
This is a Thief-style trading strategy — designed for entertainment, education, and market storytelling. Trade responsibly; it’s just for fun, not financial advice.
#NASDAQ100 #US100 #IndexTrading #HullMA #PriceAction #MarketStructure #SwingTrade #DayTrade #TechnicalAnalysis #SmartMoneyConcepts #TradingCommunity #ThiefTrader #ChartArt #EditorPickCandidate

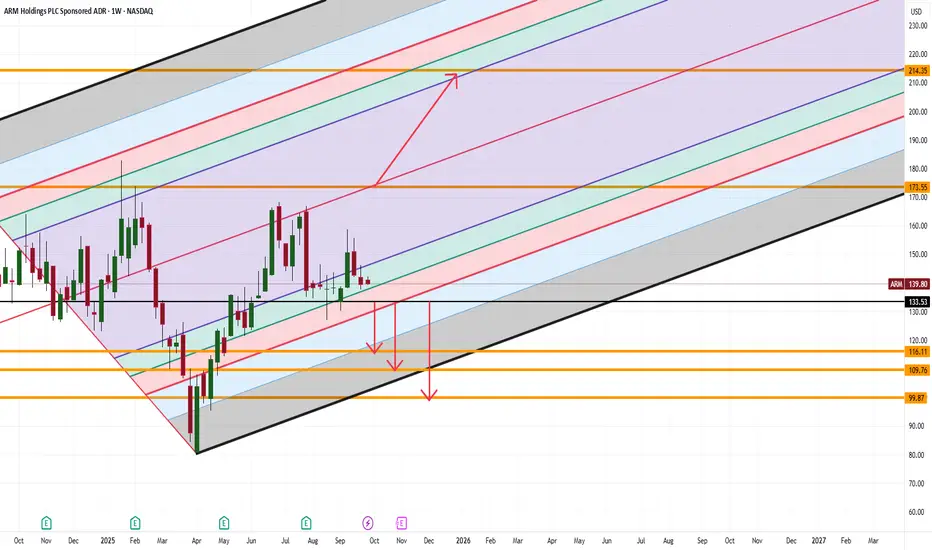
ARM Traders Won’t Like This SetupARM Holdings is sitting at a pivotal zone, and the next move could be brutal for one side of the market.
-If $133.53 breaks, momentum opens a slide toward $116, then $109, with $99 lurking as the deeper target.
-But if price can reclaim $173, the stage is set for a rally toward $213.
Here’s what makes this fascinating: most traders get tunnel vision on the current chop… while the real story is how violent ARM tends to move once it clears a range.
👉 The question isn’t if it moves, it’s which side gets trapped first.
How are you preparing for either outcome?
SMH Bullish Setup – Breakout Plan for the Perfect Heist!🔥🚀 THIEF TRADER ALERT: SMH BULLISH HEIST PLAN! 🚀🔥
Asset: VANECK SEMICONDUCTOR ETF (SMH)
Plan: BULLISH BREAKOUT HEIST 🎯 (Resistance wall breakout candle close above 298.00)
🎯 THIEF ENTRY STRATEGY (LAYERING METHOD) 🎯
"Steal the dip like a PRO!" 💰🔪
Multiple Limit Orders (Layer Entry) 👇
1st Layer: 298.00 (Breakout Confirmation)
2nd Layer: 292.00 (Pullback Steal)
3rd Layer: 288.00 (Aggressive Discount)
4th Layer: 284.00 (Max Pain = Max Gain)
(Add more layers if you’re a risk-loving THIEF!)
⚠️ WARNING: DO NOT place SL or orders before breakout! (Only real THIEFS wait for confirmation!)
🛑 THIEF STOP LOSS (OG STYLE) 🛑
"Protect your loot or get wrecked!" 💣
SL @ 280.00 (Hard floor – adjust based on your risk appetite!)
Place SL ONLY AFTER breakout! (No premature stops – patience = profit!)
🎯 TARGET: 324.00 🚀 (OR ESCAPE EARLY IF MARKET TURNS)
Scalpers: Ride the waves, but stay LONG ONLY! 🌊
Swing Thieves: Hold & rob big! Use Trailing SL to lock gains! 🔐💰
📢 THIEF PRO TIPS:
✅ Set Alerts! (Don’t miss the breakout!) 🔔
✅ Watch for News! (Avoid getting caught in volatility traps!) 📉📈
✅ Boost & Support! (More boosts = more heists!) 💖🚀
🔥 FINAL MESSAGE:
"The market is a casino, and WE are the robbers! 🎰💰 Steal smart, escape rich! 🏴☠️💸"
👉 LIKE, BOOST & FOLLOW FOR MORE HEIST PLANS! 👈
🚀 NEXT HEIST COMING SOON… STAY TUNED! 🚀
#ThiefTrader #SMH #BreakoutHeist #LayerEntry #LimitOrderBandit 🎯🔥

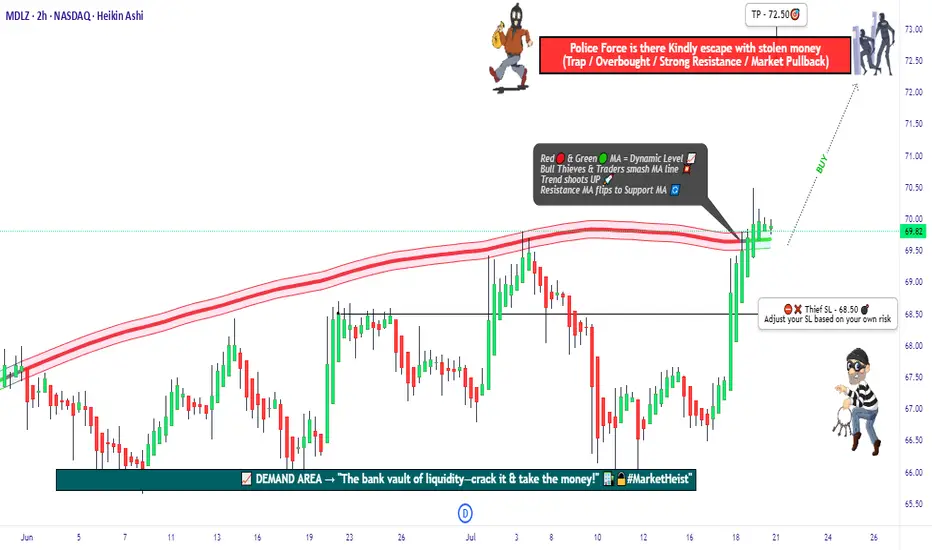
"MDLZ Heist LIVE! Quick Profit Grab Before Reversal!"🚨 MONDELEZ HEIST ALERT: Bullish Loot Zone! (Swing/Day Trade Plan) 🚨
Thief Trading Strategy | High-Risk, High-Reward Play
🌟 Greetings, Market Pirates! 🌟
Hola! Oi! Bonjour! Hallo! Marhaba!
To all Money Makers & Strategic Robbers 🤑💸—this is your blueprint to plunder "MONDELEZ INTERNATIONAL, INC" with precision.
🔎 THIEF TRADING ANALYSIS (Technical + Fundamental)
The Vault is Open! Bullish momentum detected, but caution—this is a high-risk police barricade zone (resistance level).
Overbought? Consolidation? Reversal? Yes. Bears lurk here, but we’re stealing profits before the trap snaps.
🎯 Target: 72.50 (or escape earlier if momentum fades).
🚨 Scalpers: Long-only! Use trailing stops to protect gains.
📈 ENTRY: How to Swipe the Loot
"Buy the Dip" Strategy: Optimal entries on pullbacks (15m/30m timeframe).
DCA/Layering Tactics: Spread limit orders for better risk control.
Aggressive Robbers: Enter now. Patient Thieves: Wait for retests.
🛑 STOP LOSS: Survival Rules
SL at 68.50 (nearest swing low wick on 2H chart).
Adjust based on risk/lot size—protect your capital!
⚡ CRITICAL ALERTS
📰 News Volatility: Avoid new trades during major releases. Lock profits with trailing stops!
📊 Fundamental Drivers: Check COT reports, macro trends, and sector sentiment Klick the 🔗.
⚠️ Reminder: This is NOT financial advice. DYOR and manage risk!
💥 BOOST THE HEIST!
Like 👍 + Boost 🔄 to fuel our next market robbery plan. Together, we trade smarter, steal bigger, and profit faster!
🚀 Stay tuned—more heists coming soon! 🤑🔥
Is the NASDAQ Vault Open for a Full Bullish Heist?🧠 NASDAQ Heist Masterplan: Thieves Eye on 24,500 🎯💰
🚨 Asset: NASDAQ100 / US100 / NDX
📊 Plan: Bullish | 🔁 Layering Strategy
🎯 Target: 24,500
🛑 Stop Loss: 22,600
📍 Entry: Any level – the vault’s wide open!
💼 Thief Trader's NASDAQ High-Stakes Robbery Is LIVE! 🤑📈
Welcome, money bandits & market looters! 💼💰
The time has come to launch a full-scale bullish raid on the NASDAQ fortress. We’re not just taking entries — we’re stacking them like a pro with our layered limit order strategy across swing zones. 🔫📉➡️📈
🔓 Entry:
Pick any price! We break in anytime, anywhere.
🔁 Stack your buy limits on 15m–30m swing lows.
🔔 Set your alerts – don’t let the opportunity slip.
🛑 Stop Loss:
Guard your loot at 22,600.
Risk management is the bulletproof vest in this raid. 🎯
Adjust your SL based on lot size and order volume. 📏🔐
🎯 Profit Target:
Thieves retreat at 24,500.
But hey – smart robbers use trailing SL to squeeze every last drop of gold! 🏆💸
💡 Scalpers & Swingers:
Stick to the long side only.
If your pockets are deep – full-send mode ON.
If not, tag along with swing entries. Patience pays big! 💎⏳
📢 Heads Up, Heist Crew:
News drops = landmines. Step carefully.
🚷 No new entries during major announcements.
🛡️ Use trailing SL to defend your profit bags.
🚨 Daily Reminder:
This market isn’t a playground. It’s a battlefield.
Use COT data, macro reports, sentiment scans, and index-specific triggers to fortify your robbery blueprint. Stay smart, stay updated! 📊🧠
💥 Boost Our Loot Crew 💥
Hit that LIKE ❤️ to support the Thief Army!
Stronger visibility = Bigger Loots = More Victory Runs.
See you at the next robbery – we move in silence, but the market hears us loud! 🐱👤💸🔥🚀

NASDAQ 100 TECH HEIST: Bullish Loot Before the Bear Trap!🚨 E-MINI NASDAQ 100 HEIST: Tech Rally or Bear Trap? (Thief Trading Blueprint) 🚨
🌟 Hola! Oi! Bonjour! Hallo! Salam! 🌟
Attention all Market Bandits & Tech Raiders! 🏴☠️💻💰
🔥 Thief Trading Intel: We're targeting the E-MINI NASDAQ 100 for a bullish loot grab! Long entry only—high-risk Red Zone ahead: overbought, consolidating, and primed for a reversal. Don’t let the bears ambush your profits!
"Claim your tech treasure and run—you’ve earned this steal!" 💰🚀
🚪 ENTRY: The Tech Vault is Open!
📈 "Swipe bullish loot at any price—the heist is LIVE!"
Buy Limit orders at recent swing lows/highs (15-30 min TF).
📌 Pro Thief Move: SET ALERTS! Don’t miss the breakout.
🛑 STOP LOSS: Escape Plan
📍 Thief SL (Smart Crew): Recent swing low (20,700.00, 4H TF).
📍 Adjust based on your risk, lot size, and orders.
🎯 TARGET: Loot & Exit!
🎯 22,600.00 (or bail early if the market flips!)
⚡ SCALPERS’ QUICK HIT
👀 Long scalps ONLY!
Deep pockets? Raid now.
Light wallet? Join swing traders.
Trailing SL = Your Profit Shield! 🛡️
📢 WHY THIS HEIST? (NASDAQ Bullish Momentum)
Tech rally brewing! Key drivers:
Fundamentals (COT, Macro, Geopolitics)
Sentiment & Intermarket Trends
Index-Specific Analysis & Positioning
🔗 Full intel? Bio linkss checkk! 👉🏻👉🏻👉🏻
⚠️ WARNING: News = Danger Zone! 📡🚨
Tech news moves FAST! Protect your loot:
❌ Avoid new trades during news.
🔒 Trailing SL = Lock profits.
💖 SUPPORT THE TECH HEIST CREW!
💥 SMASH THAT BOOST BUTTON! 💥
More boosts = bigger future heists!
Stronger crew = more $$$ for all!
Profit daily with Thief Trading Style! 📈🏆
Next tech raid coming soon—stay tuned! 🖥️🤑

Possible push down for NAS100After A strong Bearish push, price action is filling the inefficiency left behind. Price is currently testing the structure lows previous support. The bearish move and retracement is the 78.6% PRZ
Wait for your lower time frame play to enter. This is an over all counter trend trade, however this could have a nice quick move down to retest the Daily previous structure high area of 21,843
Daily Chart has a Bearish Divergence that is playing out.
**Caution** on the macro bullish trend, this recent pull back retraced back to the 23.6 lvl with a wick while "retesting" the previous structure high on the H4 time frame....Enter with caution.

ENPHASE ENERGY (ENPH) Short Play: Bearish Momentum Building!Technical Analysis:
Enphase Energy (ENPH) on the 15-minute timeframe signals a solid short trade setup. The price is moving steadily below the Risological dotted trendline, showing sustained bearish pressure with room for the price to descend further.
Key Levels:
Entry: 78.13
Stop Loss (SL): 85.38
Target 1 (TP1): 69.18
Target 2 (TP2): 54.69
Target 3 (TP3): 40.20
Target 4 (TP4): 31.2
5
Observations:
The price is consolidating near the entry, showing potential to test the lower targets.
The Risological dotted trendline continues to act as overhead resistance, indicating a strong bearish outlook.
Enphase Energy is positioned for a potential decline with all targets set. Traders should watch for a breakdown below TP1 to confirm continued bearish momentum and aim for deeper targets!

NAS100 BUYSBuys on NAQ100 TP7800PIPS Watch Out On Monday Or Tuesday For a Fake Out But Keep looking out a Discount
KEEP SL BELOW 4H FVG

NASDAQ SHORT 1500+ pips (UPDATE....FLOATING 700+ PIPS IN PROFIT)Good evening gents so today has been EXCELLENT. My previous analysis that was posted on JULY 29th has gone perfectly. During NEW YORK session today at 16:00pm (south African time), market gave us a beautiful drop out of our POI DAILY SIBI....We are now currently running 700+ pips in profit! If you were one of the viewers to see my previous post, give me a heads up if you got in on this trade. COMMENTS ON THIS POST IS MUCH APPRECIATED.

Honeywell: Nearly There!Honeywell almost made it to the resistance at $210.61, which it should overcome as part of the current magenta wave (3). However, there is still a 32% chance that the price will pull back down into our magenta Target Zone between $188.24 and $180.93. This short-term bearish alternative scenario will be triggered if HON drops below the support at $189.66 before reaching a new high.

nasdaqPair : NASDAQ ( US 100 )
Description :
Completed " 12345 " Impulsive Waves
Break of Structure
Rising Wedge as an Corrective Pattern in Short Time Frame
RSI - Divergence
Fibonacci Level - 261.8%

Nas100 Trading setup Institutional tacticsHello traders this my trading setup in the higher time frame
My tactics ;
TECHNICAL ANALYSIS
Key Support & Resistance
Market Structure , Price Swings
Open Interest
Order Blocks & breaker block=> Expansion
liquidity => Reversal
imbalance => Retracement
Consolidation => Equalibrium
Market Maker Models buy and sell
Weekly Profiles
If you like my content please follow and hit the like button and show some love
wish you good luck and good trading

Nasdaq Pair : NASDAQ
Description :
Rising Wedge as an Corrective Pattern in Long Time Frame
RSI - Divergence
Break of Structure
Completed " 12345 " Impulsive Waves and " ABC " Corrective Waves
Resistance Level

NASDAQThis Is Another Perspective On The Nasdaq Analysis I Just Shared, What Can Also Happen Is Nasdaq Trading Above Monday's High To Form A Classic Tuesday High Of The Week, We'll See Tomorrow What Is Likely To Happen Between The Two Anticipations.

US100 SHORT, NASDAQ SHORTPrice has recently into an area of resistance, I'll be expecting price to trade down as marked on the chart. My setup for the week to come until take profit is hit. HAPPY TRADING

NAS100 4H NAS100 is in a bearish move over two weeks. LH and LL are keep forming. Now any signs of BOS (break of structure). There is a huge gap between last week High and last week Low. We can see a possible correction reversal move. A lot of imbalances are also to be taken out as we can see a lot of single print moves. This week we wait for FED decision about rates. Be careful with your trades and use tight SL.
